3931
Multi-parametric imaging based differentiation of primary CNS lymphoma from Glioblastoma using T1-Perfusion, Diffusion and Susceptibility-weighted MR Imaging1Department of Radiology and Imaging, Fortis Memorial Research Institute, Gurgaon, India, 2Department of Neuroimaging & Interventional Radiology, National Institute of Mental Health and Neurosciences, Bangalore, India, 3Indian Institute of Public Health, Gandhinagar, India, 4Biostatistics, Sanjay Gandhi Post Graduate Institute of Medical Sciences, Lucknow, India, 5Center for Biomedical Engineering, Indian Institute of Technology Delhi, Delhi, India, 6Department of Neurosurgery, Fortis Memorial Research Institute, Gurgaon, India, 7SRL Diagnostics, Fortis Memorial Research Institute, Gurgaon, India, 8Department of Neurosurgery, National Institute of Mental Health and Neurosciences, Bangalore, India, 9Neuropathology, National Institute of Mental Health and Neurosciences, Bangalore, India
Synopsis
Glioblastoma and primary CNS lymphoma (PCNSL) need differentiation on pre operative imaging as management strategies for these two pathologies are diverse. Due to the presence of atypical imaging findings in a significant number of cases, it becomes difficult to differentiate these two pathologies on conventional MRI. We utilized multi-parametric imaging methods (T1-perfusion, DWI, and SWI) for possible differentiation of these two entities. In linear discriminant analysis using various imaging parameters we achieved 84% accuracy with AUC 90.14%. We conclude that multi-parametric imaging may prove to be useful in accurate preoperative discrimination of these two pathologies.
Introduction:
Primary Glioblastoma (GB) and primary CNS lymphoma (PCNSL) are intracranial mass lesions which require pretreatment differentiation because of substantial differences in the treatment strategies used for these two tumors1-4. Aim of the study was to investigate the diagnostic performance of multi parametric MRI for differentiation of glioblastoma from lymphoma using multiple imaging indices derived from diffusion weighted imaging (DWI), contrast enhanced T1-perfusion MRI and susceptibility weighted imaging (SWI).Methods:
Total 100 (GB=70 and PCNSL=30) adult patients (66M/34F; age range 18-82 years; mean age= 51.81±15.86 years) were included in this study. All the patients with PCNSL were immunocompetent. Multi-parametric MRI including contrast enhanced T1-perfusion, DWI, and SWI were performed on these patients at 3.0T MRI (Philips HealthTech, The Netherlands) scanner using 15/32-channel head-coils. Following acquisition parameters were used for various imaging sequences: T1-perfusion (3D TFE): TR/TE/flip-angle=4.4/2.1/100, slice-thickness=6mm, FOV=240×240mm2, matrix size=128×128, temporal-resolution=3.9s, dynamic=32, slices=12), SWI (TR/TE =31/7.2 ms, slice thickness=2 mm over contiguous slices, flip angle =17°, acquisition matrix = 288 ×288, FOV=230×230mm2), and DWI (TR/TE=4,156/114ms, number of signal averages=4, flip angle=90°, slice thickness=5mm, acquisition matrix=152×121, and FOV=230×184mm2 , b values= 0 and 1,000) were acquired in all the included subjects. At the fourth time point of the T 1 perfusion data acquisition, 0.1 mmol/kg body weight of Gd-BOPTA (Multihance, Bracco, Italy) was administered intravenously at a rate of 3.0 ml/sec, followed by a 30-ml saline flush.
Image processing and data analysis: ADC was quantified using vender supplied tool (Intellispace Portal, Philips Medical systems, ver 9.0) while T1-perfusion indices i.e. relative CBV, permeability (Ktrans and Kep), fractional extracellular extravascular volume (Ve), fractional plasma volume (Vp) and the leakage rate (λ tr) were estimated using in house developed program5. CBV value was normalized by the mean of normal white matter CBV value to generate the normalized CBV_corr map6. Intratumoral susceptibility signal (ITSS) scores on SWI images were calculated for each tumor as described elsewhere7. Leakage corrected CBV (CBV_corr) maps were co-registered with DWI derived ADC maps, FLAIR and SWI images, and multiple ROIs were drawn to extract the highest CBV_corr values from the tumor. Similarly, values for other kinetic parameters were extracted from the co-registered maps and ROI’s were placed in the regions showing the highest values. DWI derived ADC map s areas showing the lowest values were used for recording the values from the ROI.
Statistical analysis: Discriminant function analysis was used to identify discriminatory variables using a multivariable procedure. The independent variables identified by this correlation analysis were used in the model for classification using discriminant function analysis. Receiver operating characteristic (ROC) curve analysis was used to evaluate the performance of various parameter and discriminant function to predict GB. All the statistical computations were carried out using Statistical Package for the Social Sciences (IBM, SPSS version 23.0). A p value of ≤0.05 indicated a statistically significant difference for two tailed alternate hypothesis.
Results:
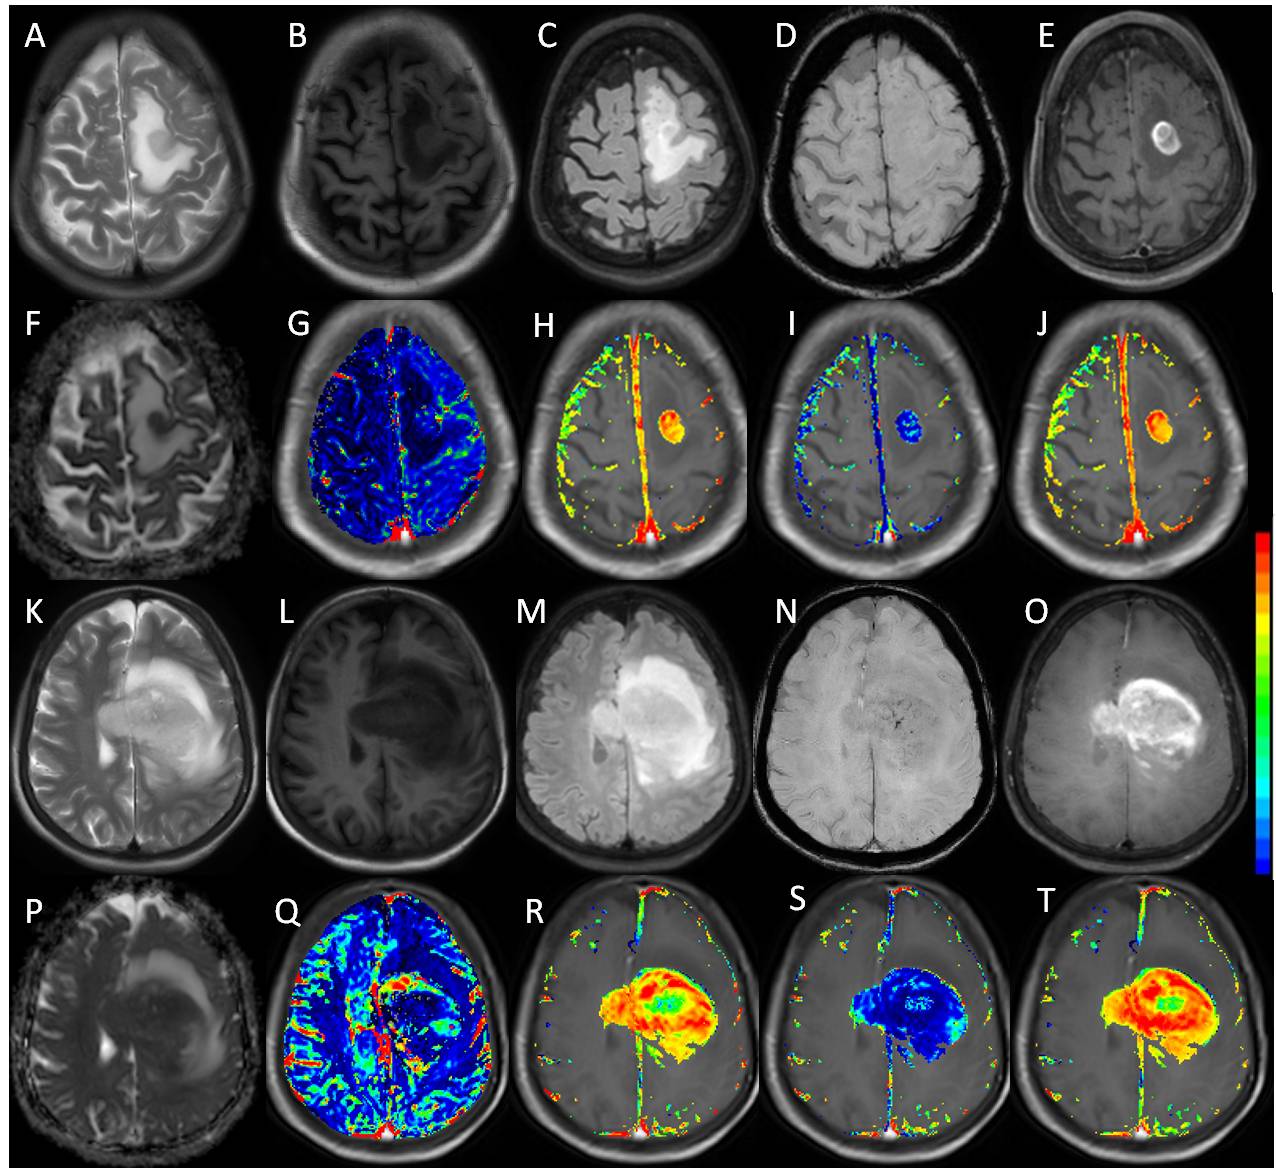
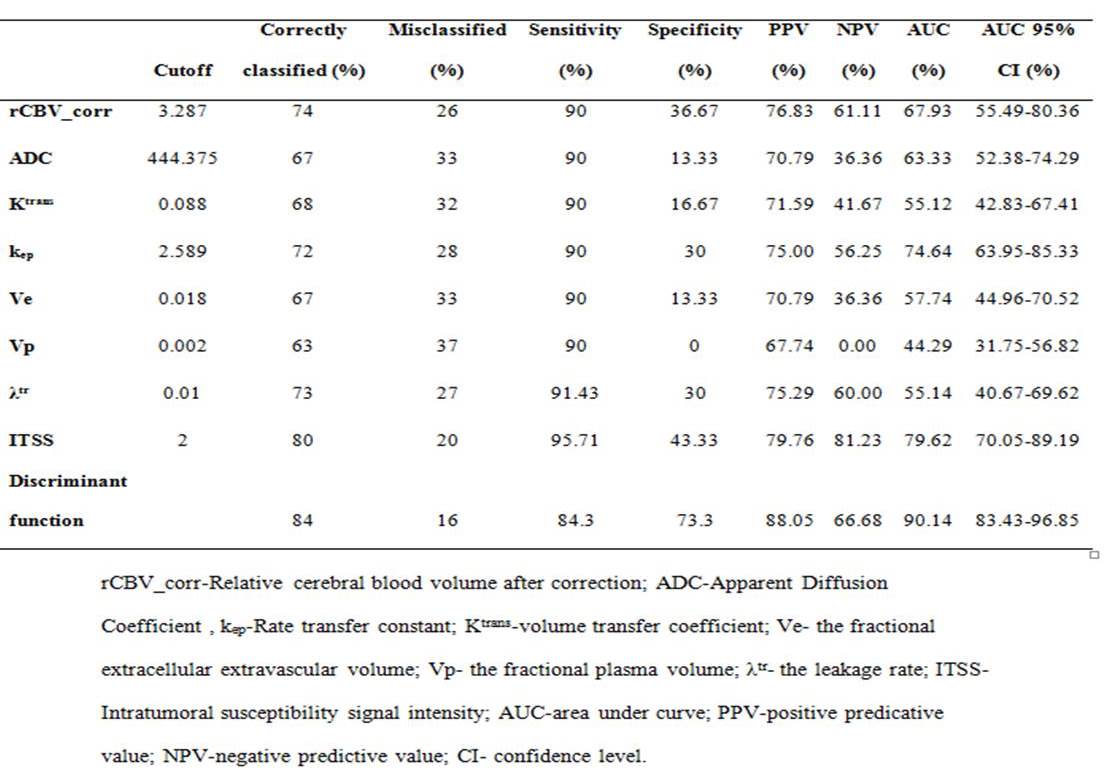
Figure 1 shows multiparametric images of atypical GB and PCNSL on conventional MRI. Various imaging indices used for classification using ROC analysis are summarized in table 1. A discriminant function was derived for differentiating between PCNSL and GB using multiple imaging parameters. The form of the function estimated is “D=0.355*CBV_corr+0.002*ADC+1.087*ITSS-0.6091*Ve-5.055”. This function classified overall 84 % of the cases correctly, with 84.3% sensitivity and 73.3% specificity and area under curve as 0.90 (p<0.01).Discussion:
In this study, T1-perfusion derived hemodynamic and kinetic metrics along with diffusion and SWI were used for characterizing and differentiating the GB from PCNSL. Our study showed that T1-perfusion metrics Ve, CBV_corr, DWI derived ADC maps along with ITSS score derived from SWI are useful indices to discriminate PCNSL from GB. DSC perfusion is the most commonly used perfusion method in previous study which has some inherent limitations such as presence of blood, postsurgical artifacts, calcifications, or lesions proximity to skull-base8. While T1-perfusion is less susceptible to above mentioned conditions and provides both blood brain barrier permeability and hemodynamic information thus allowing more reliable characterization of lesions4,9.Conclusion:
We conclude that differentiating of PCNSL from GB using multi-parametric imaging can be improved by combining T1 perfusion, DWI derived ADC maps and ITSS score derived from SWI in the imaging protocol.Acknowledgements
NoneReferences
- Mansour A, Qandeel M, Abdel-Razeq H, Abu Ali HA. MR imaging features of intracranial primary CNS lymphoma in immune competent patients. Cancer Imaging. 2014;14:22.
- Ding Y, Xing Z, Liu B, Lin X, Cao D. Differentiation of primary central nervous system lymphoma from high grade glioma and brain metastases using susceptibility-weighted imaging. Brain Behav. 2014;4:841-9.
- Lu S, Wang S, Gao Q, Zhou M, Li Y, Cao P, Hong X, Shi H. Quantitative Evaluation of Diffusion and Dynamic Contrast-Enhanced Magnetic Resonance Imaging for Differentiation Between Primary Central Nervous System Lymphoma and Glioblastoma. J Comput Assist Tomogr. 2017 Aug 12. doi: 10.1097/RCT.0000000000000622. [Epub ahead of print]
- Gupta PK, Saini J, Sahoo P, et al. Role of Dynamic Contrast-Enhanced Perfusion Magnetic Resonance Imaging in Grading of Pediatric Brain Tumors on 3T. Pediatr Neurosurg. 2017; 52: 298-305.
- Singh A, Singh A, Haris M, et al. Quantification of physiological and hemodynamic indices using T(1) dynamic contrast-enhanced MRI in intracranial mass lesions. J Magn Reson Imaging. 2007; 26: 871-880.
- Sahoo P, Gupta RK, Gupta PK et al. Diagnostic accuracy of automatic normalization of CBV in glioma grading using T1- weighted DCE-MRI. Magn Reson Imaging 2017;44:32–37.
- Saini J, Gupta PK, Sahoo P, Singh A, Patir R, Ahlawat S,Beniwal M, Thennarasu K, Santosh V, Gupta RK.Differentiation of grade II/III and grade IV glioma by combining “T1 contrast-enhanced brain perfusion imaging” and susceptibility-weighted quantitative imaging. Neuroradiology, 2017 (online) [https://doi.org/10.1007/s00234-017-1942-8]
- Conte GM, Castellano A, Altabella L, et al. Reproducibility of dynamic contrast-enhanced MRI and dynamic susceptibility contrast MRI in the study of brain gliomas: a comparison of data obtained using different commercial software. Radiol Med. 2017; 122: 294-302.
- Sahoo P, Gupta PK, Awasthi A, et al. Comparison of actual with default hematocrit value in dynamic contrast enhanced MR perfusion quantification in grading of human glioma. Magn Reson Imaging. 2016; 34: 1071-7.
Figures