3930
Diffusion-Weighted MRI Apparent Diffusion Coefficient (ADC) Histogram Changes In Primary Rectal Cancer Treated With Chemotherapy + Anti-Angiogenic Therapy Versus Neoadjuvant Chemoradiation1Paul Strickland Scanner Centre, Mount Vernon Hospital, Northwood, United Kingdom, 2Cancer Imaging, School of Biomedical Engineering & Imaging Sciences, King's College London, London, United Kingdom, 3CRUK-EPSRC Cancer Imaging Centre, Institute of Cancer Research & Royal Marsden Hospital, Sutton, United Kingdom, 4Mount Vernon Hospital, Northwood, United Kingdom
Synopsis
Changes in the apparent diffusion co-efficient (ADC) histogram parameters in primary rectal cancers treated with neoadjuvant chemotherapy + anti-angiogenic therapy (NAC) differ substantially to those treated with chemoradiation (CRT), reflecting the differing mechanisms of action of these therapies. Higher diffusivity and lower variance post-CRT compared to NAC in responders likely reflects radiotherapy-related inflammation.
Background
Neoadjuvant chemoradiation (CRT) improves the likelihood of a clear surgical resection margin (‘R0’ resection) in locally advanced in primary rectal cancer1. Nevertheless, it is recognised that CRT can result in significant side-effects including anal incontinence requiring a stoma; and in some patients may amount to ‘overtreatment’. Neoadjuvant chemotherapy (NAC) is being investigated as an alternative strategy in trials, potentially mitigating the side-effects of radiotherapy2. MRI response criteria including tumour regression grading (TRG) developed for chemoradiation3 may be less representative of early chemotherapy effect. We aimed to determine if diffusion-weighted MRI ADC histogram parameters have potential for assessing the early effects of NAC; and if ADC histogram changes differ from CRT.Methods
Institutional review board approval and informed consent were obtained for these prospective studies. Patients underwent either neoadjuvant CRT (45 Gy in 25 fractions with capecitabine 850 mg/m2 bd) or NAC (either folinic acid + fluorouracil + oxaliplatin (FOLFOX) or FOLFOX + irinotecan (FOLFOXIRI)) together with the anti-angiogenic, bevacizumab. For patients undergoing CRT, MRI was performed before (Tm0), immediately post (Tm1), and 12 weeks (Tm2) post CRT (n=12/12 with 3 time-point data). For patients undergoing NAC, MRI was performed before (Tm0), at 6 weeks (Tm1, post cycle 3) and 12 weeks (Tm2, post cycle 6) of NAC (n=9/12 with 3 time-point data). The diffusion weighted MRI acquisition parameters are summarised in Table 1. Additionally, standard clinical sequences were obtained including T1 axial, T2 axial and sagittal TSE pelvic sequences and T2 axial and coronal oblique TSE sequences centered on the rectal tumour.
Images were analysed offline using post-processing software (Adept, ICR, London). A tumour volume of interest (VOI) was defined by a radiologist (>15 year’s MRI experience) for each patient’s MRI and monoexponential ADC histogram parameters (median, mean, variance, kurtosis, skewness, range) derived. Changes in ADC parameters within group were compared using a paired samples t-test; differences between therapy groups by independent samples t-test. Statistical significance was at 5%.
Results
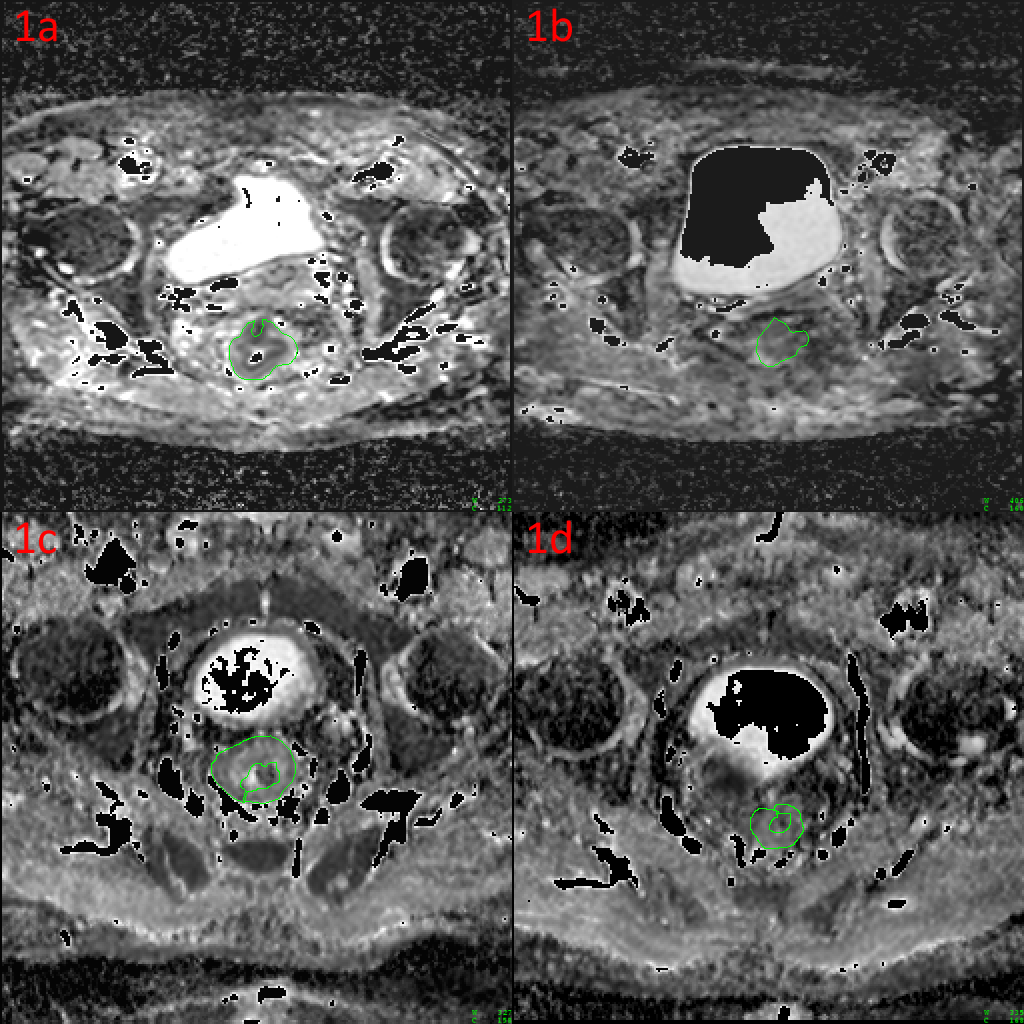
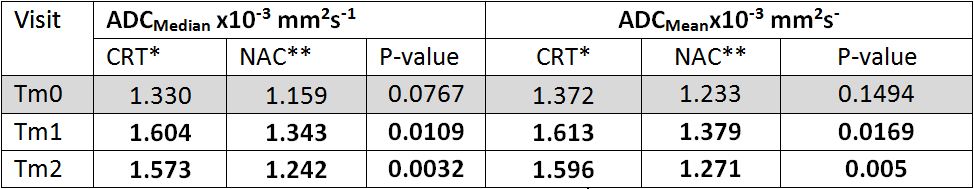
Figure 1 illustrates typical ADC maps pre- and post-CRT (1a, b) and NAC (1c, d) . All CRT patients underwent surgery at a median of 12.3 weeks post-therapy. 10/12 (83%) had responded to therapy (2/10 pathological complete responders); 2/12 (17%) were not downstaged, with distant metastases subsequently. 11/12 NAC patients underwent surgery at a median of 7.5 weeks post-NAC. 7/12 (58%) had responded to therapy (2/7 pathological complete responders). 3/12 had tumour (n=1) or nodal progression (n=2) whilst on therapy. Cohort mean ADCMedian and ADCMean values were significantly higher for CRT than NAC patients at all post-therapy time-points (Table 2).
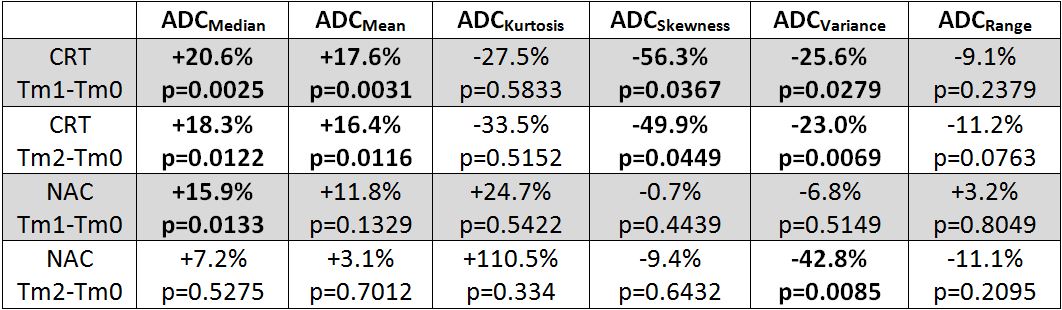
CRT resulted in a sustained increase in ADCMedian, only noted transiently with NAC; and ADCMean, not significantly altered with NAC (Table 3). A sustained decrease in ADCVariance was noted post chemoradiation; a decrease in ADCVariance was noted only after 12 weeks (6 cycles) of chemotherapy. ADCSkewness decreased (a reduction in the tail of values to the right) with CRT but not after NAC.
Discussion
Difference in the mechanism of action of CRT and NAC are reflected by the differences in ADC histogram parameters. These differences in ADC with CRT versus NAC were noted even amongst the subgroup of responders. ADC is sensitive to the effects of CRT in rectal cancer. Higher ADCMedian and ADCMean post CRT with a reduction in variance and skewness reflected the radiotherapy-related inflammation and cellular apoptosis with increased water diffusivity. In comparison, ADC changes post-NAC were much less apparent. ADCMedian increased only transiently after cycle 3 of NAC with FOLFOX or FOLFOXIRI + bevacizumab and this was not sustained after cycle 6, likely due to the cytostatic versus cytoreductive nature of the NAC regime.Conclusion
ADC histogram changes differed for CRT versus NAC. Early changes were noted within 3 cycles of NAC but not sustained due to its cytostatic mechanism of action.Acknowledgements
The authors would like to thank Ian Simcock and David Collins for their help with these projects.References
[1] Glynne-Jones R, et al. Ann Oncol. 2017;28(suppl_4):iv22-iv40.
[2] Glynne-Jones R, et al. BMC Cancer. 2015;15:764.
[3] Patel, UB et al. Ann Surg Oncol. 2012;19(9):2842-52.
Figures