3929
PERFUSION MRI AS A MARKER OF GLIOBLASTOMA INFILTRATION INTO HEALTHY TISSUE1Centre for Clinical Brain Sciences, University of Edinburgh, Edinburgh, United Kingdom, 2Glasgow experimental MRI centre (GEMRIC), Institute of Neuroscience and Psychology, University of Glasgow, Glasgow, United Kingdom, 3Wolfson Wohl Translational Cancer Research Centre, Institute of Cancer Sciences, University of Glasgow, Glasgow, United Kingdom
Synopsis
We investigate the ability of perfusion MRI to probe glioblastoma infiltration into healthy brain tissue, on a patient-derived mouse model presenting infiltrative tumour margins. Using a high SNR Arterial Spin Labelling sequence and a multiple slice in-plane histology method, we show that perfusion imaging can probe lower tumour cell density regions than conventional MRI. Voxel-to-voxel comparison between perfusion and tumour cell density images, allows identifying a negative relation between tumour cell burden and perfusion at the invasion margins. This relation, related to vascular co-option mechanisms, could be used as a marker of tumour cell infiltration into healthy tissue.
INTRODUCTION
The ability of tumour cells to invade healthy brain tissue is a major challenge to successful treatment of glioblastoma (GBM). Conventional MRI fails to detect regions of low tumour cell density that may be responsible for subsequent tumour recurrence, and novel techniques are generally not reliable due to a lack of robust evaluation protocols. Invading tumour cells often progress along blood vessels and even individual cells can disrupt the normal function of the blood-brain barrier1. Probing such effects could allow detecting very low tumour cell density. In this study, we perform a quantitative analysis of the relation between perfusion MRI and tumour cell infiltration on a realistic mouse GBM model presenting infiltrative margins. We concentrate on infiltrated regions, not easily detected by standard clinical imaging techniques, and interrogate MRI sensitivity limits in comparison with perfusion weighted images provided by a recently developed high SNR multiple-boli ASL sequence (mbASL). The ability of MRI techniques to probe low tumour cell density is quantitatively assessed using a multiple slice in-plane histology method. This technique allows going beyond the standard evaluation tests to consider a voxel-to-voxel comparison between MRI and histopathology, giving a deeper insight into the relation between local perfusion and tumour cell density.
METHODS
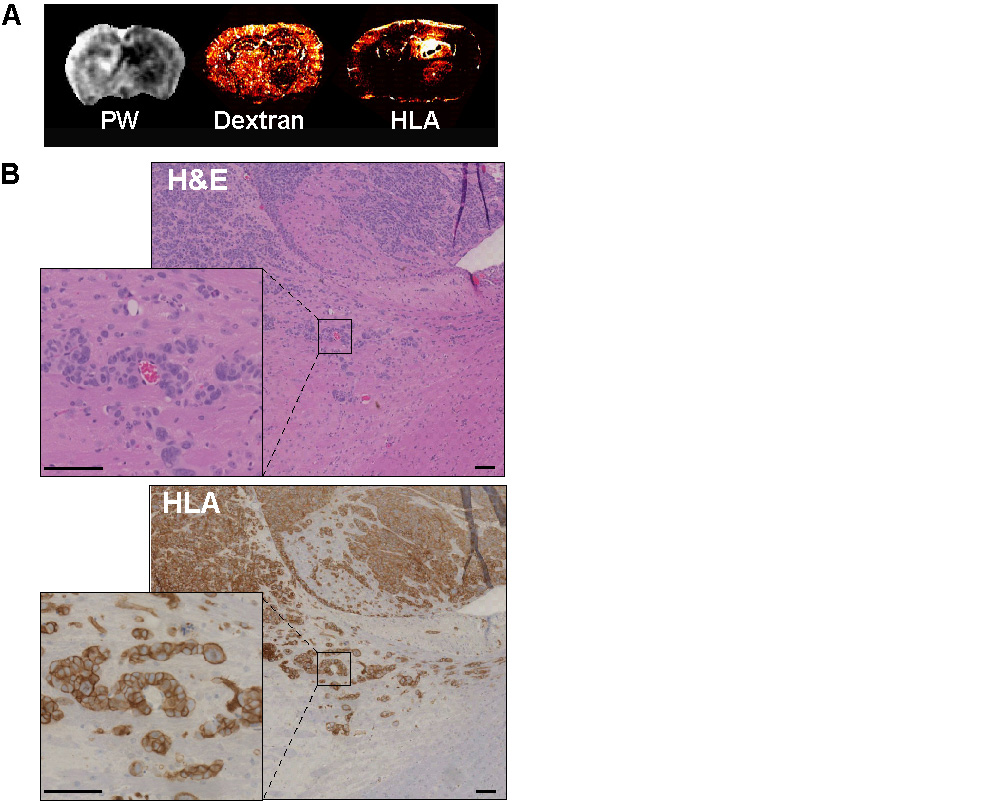
Nude mice (20-25g) were injected intracranially with 5x10⁵ G7 patient-derived glioblastoma cells. MRI experiments were performed 9 ,12 and 15 weeks post injection using a Bruker 7T Biospec with 72 cm resonance birdcage and phase array surface coils.Perfusion weighted images (PW) were acquired using a multiple adiabatic boli Arterial Spin Labelling technique (mbASL)2 implemented and optimised for rodent brain perfusion imaging. Conventional MRI techniques (cT1, T2, DW, ADC) were also used to acquire images using the same slice thickness (1.5 mm) and different resolutions. Following the second imaging session (week 12), ten animals were injected with FITC-Dextran tracers (70kDa) to probe blood delivery and sacrificed. Staining for HLA (Human Leukocyte Antigen) allowed determining the cellular burden of human-derived tumour cells. To achieve a quantitative MRI evaluation, multiple histological slices were cut in the MRI plane, registered and stacked to account for MRI slice thickness. This approach led to the production tumour cell density maps (TCD) in the MRI plane. The processing and analysis of 3D matrices combining MRI and histology data was performed using MATLAB code developed in-house.
RESULTS
By week 12 post injection, while significant abnormal regions can be observed on T2, most cT1 showed no significant signal change (Fig.1A). Only three cases of low contrast enhancement were identified at this early invasion stage while later in the G7 model tumour development (week 15)(Fig.1B), most cT1 images present the typical features of clinical MRI, with a non-enhancing necrotic core surrounded by a contrast enhancing invasion region. Significantly greater tumour-related abnormal volumes were observed in PW images compared to conventional imaging techniques in both week 9 and 12 post-injection (Fig.2), while no significant difference was found with the "ground truth" tumour cell density maps. For all imaging modalities, comparison tests (Dice score and Accuracy index) presented values above 0.7, indicative of a very good segmentation. This allowed going beyond standard evaluation tests to consider a voxel-to-voxel comparison between perfusion MRI and histology (Fig.3A-B). Our analysis identified a negative correlation between perfusion and tumour cell burden at the tumour margins (Fig.3C-D), while no significant correlation was found closer to the core. This negative relation between perfusion and marginal tumour cell infiltration was also validated by comparison between Dextran and HLA stained histology slices (Fig.4A).
DISCUSSION
Perfusion measurements exhibited the greater abnormal regions in this early invasion/infiltration model, confirming the strong links between tumor infiltration and small host vessels reported elsewhere1. Analysis of histological data at the tumor margins (Fig.4B) shows several cases of vascular cuffing from invading tumor cells at detached locations from the tumor front. This suggests that vascular co-option could be the cause of the the perfusion drop observed in the PW images.
CONCLUSION
Combining a robust quantitative MRI evaluation protocol with a high SNR ASL sequence, we demonstrated the ability of perfusion MRI to probe lower tumour infiltration regions than conventional MRI techniques. By identifying an MRI-detectable quantitative relation between perfusion and infiltration at the tumor margins this work set the basis for future preclinical or clinical investigations aiming at a better tumour delineation based on perfusion MRI techniques.
Acknowledgements
No acknowledgement found.References
1. Watkins S, Robel S, Kimbrough IF, Robert SM, Ellis-Davies G, Sontheimer H. Disruption of astrocyte-vascular coupling and the blood-brain barrier by invading glioma cells. Nat Commun. 2014.
2. Vallatos A, Gilmour L, Chalmers A.J, Holmes W.M. Multiple boli Arterial Spin Labelling for high signal-to-noise rodent brain perfusion imaging. Magn Reson Med. 2017.
Figures
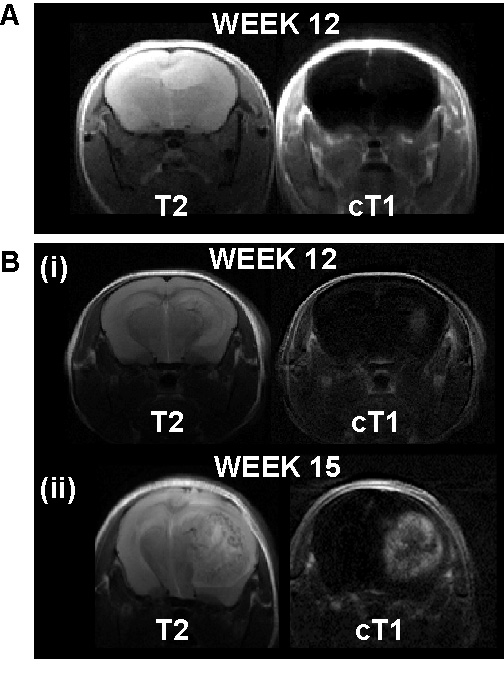
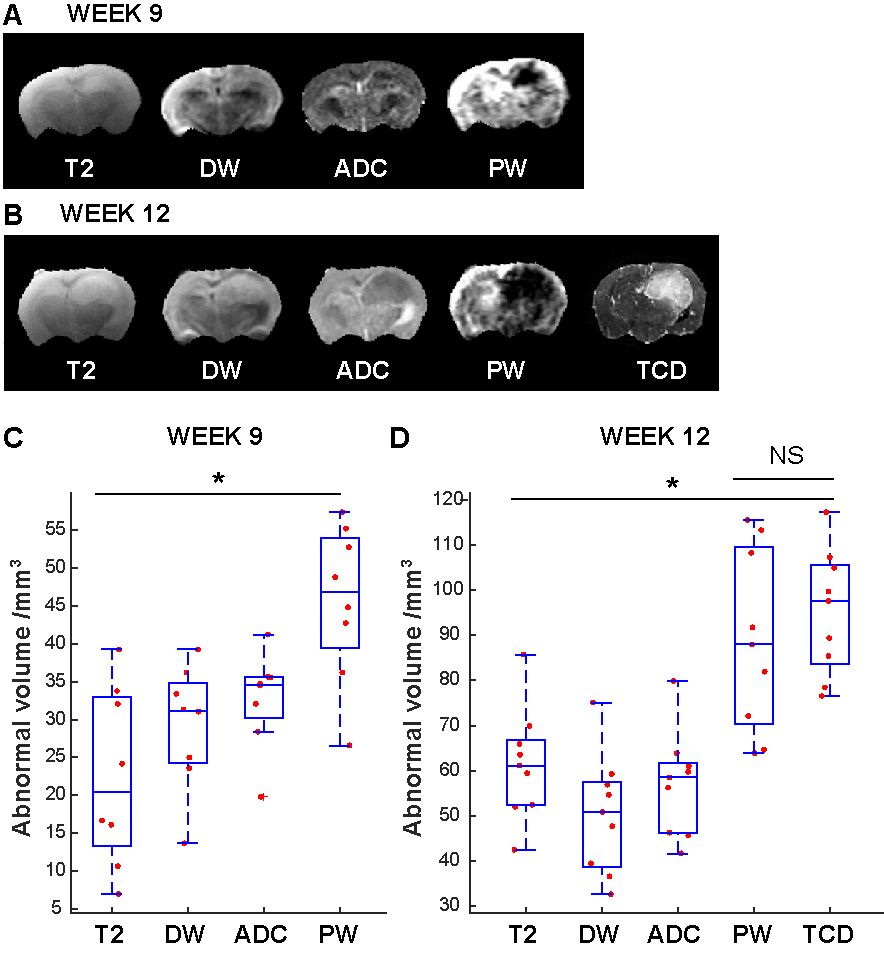
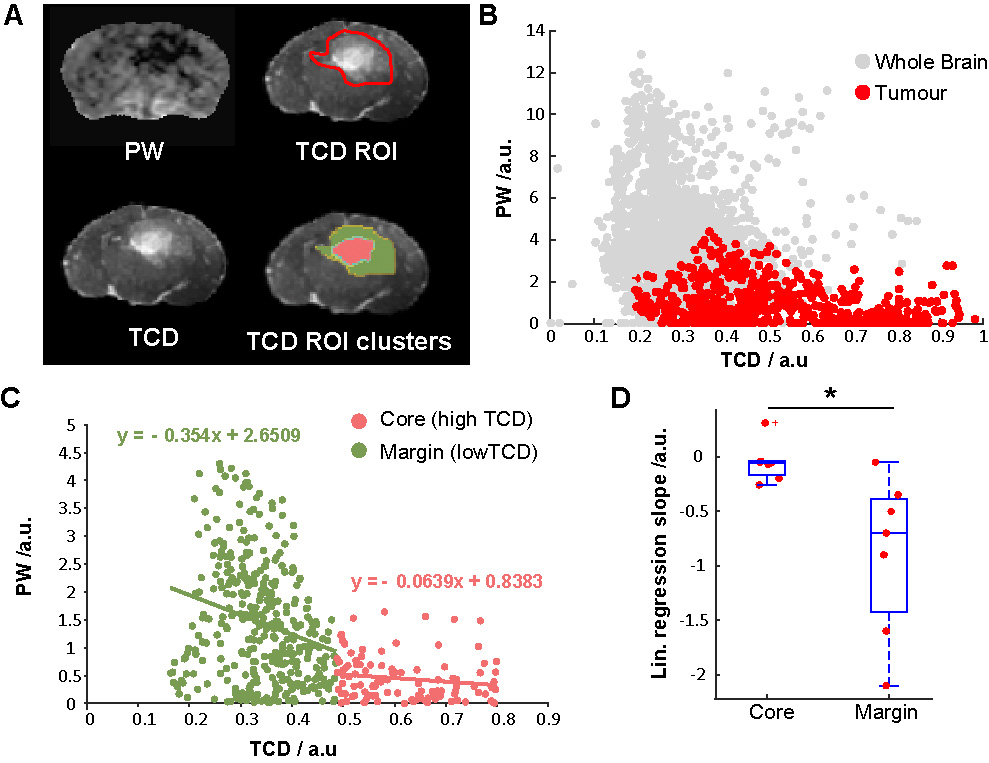
Figure 3. (A) PW, TCD , TCD ROI (manual selection of the tumour-positive region) and TCD ROI clusters for high and low TCD values ("core" and "margin" tumour regions). (B) Voxel-to-voxel scatter plot of PW against TCD signal, the red points correspond to voxels situated within the TCD ROI (C) scatter plot of PW against TCD signal for the tumour-positive voxels only, with separate linear regression fits for the “core” and “margin” regions. (D) box plots of the linear regression slopes obtained. Statistical analysis: two tailed, paired T-test, * p < 0.05.