3928
Multi-Resolution Fractal Analysis of DCE-MRI Parametric Maps for Early Prediction of Breast Cancer Therapy Response1Oregon Health and Science University, Portland, OR, United States
Synopsis
DCE-MRI data from 54 breast cancer patients collected before and after one cycle of neoadjuvant chemotherapy were subjected to Shutter-Speed pharmacokinetic analysis. A new texture feature, multi-resolution fractal dimension (FD), was extracted from DCE-MRI parametric maps and compared with single-resolution FD for early prediction of therapy response. The multi-resolution approach appears to provide a richer description of the underlying tumor heterogeneity in perfusion/permeability than the single-resolution FD method, and has higher accuracy in early discrimination of pathologic complete response (pCR) from non-pCR.
Introduction
Tumor vasculature is far more complex and chaotic than normal vasculature and this heterogeneity is a major characteristic of tumor. Texture analysis of heterogeneity of tumor perfusion/permeability as measured by dynamic contrast-enhanced (DCE) MRI has been shown to be capable of providing early prediction of breast cancer response to neoadjuvant chemotherapy (NACT)1, 2. Fractal analysis can provide useful measures of complex structures3. However, a single-resolution analysis may not be able to capture the entire complex nature of tumor heterogeneity. A multi-resolution approach used in analysis of ultrasound images demonstrated capability of breaking down statistical complexity to distinguish different texture regions4. In this preliminary study, we evaluated the potential of multi-resolution fractal analysis of DCE-MRI parametric maps for early prediction of breast cancer pathologic response to NACT.Methods
Fifty-four patients who were diagnosed with breast cancer, and underwent NACT as standard of care consented to participate in a longitudinal DCE-MRI study during the NACT course. DCE-MRI data taken at visit-1 (before NACT) and visit-2 (after the first of 6-8 cycle of NACT) were analyzed in this study to evaluate early prediction of response. Experienced radiologists delineated the breast tumor regions of interest (ROIs) on post-contrast DCE images. The DCE time-course data from each voxel within the ROIs were fitted with the Shutter-Speed pharmacokinetic model (SSM)5, which takes into account inter-compartmental water exchange kinetics. Voxel-based parametric maps were generated for Ktrans (contrast agent plasma/interstitium transfer rate constant), ve (extravascular and extracellular volume fraction), kep (=Ktrans/ve, intravasation rate constant), and τi (mean intracellular water lifetime). NACT response was classified as pathologic complete response (pCR) or non-pCR according to pathological analysis of post-NACT surgical specimens.
For each of the 3D tumor parametric maps, its fractal dimension (FD) was estimated based on the power spectrum (Pf) of the 3D Fourier transformation of the parametric map6. The least square fit of log(Pf) vs log(f) (f - frequency space) was estimated and its slope (β) and FD are related as FD=(11-β)/2. A multi-resolution analysis decomposes the parametric map into a set of frequency bands, which enables investigation at various spatial-frequency scales. In this work, wavelet analysis was used to provide multi-resolution decomposition. Each parametric map was decomposed down to four levels of resolution, using FD to guide the sub-band tree-structure decomposition. At each level the most significant sub-band (with the highest FD), which best describes the texture heterogeneity, was chosen as base for further decomposition. The concatenation of the highest and lowest FD at each level formed the feature vector for multi-resolution FD analysis.
Percentage change in FD values between the two DCE-MRI visits was calculated for each DCE-MRI parameter. Support Vector Machine (SVM)7 was then used to generate a predictive model for classification of pCR vs non-pCR, using concatenated FD percent changes from all the parameters. The entire data sets were split into a training and testing cohort for the SVM model. ROC (receiver operating characteristic) analysis was performed to assess accuracy of response prediction for both the single- and multi-resolution FD analysis.
Results
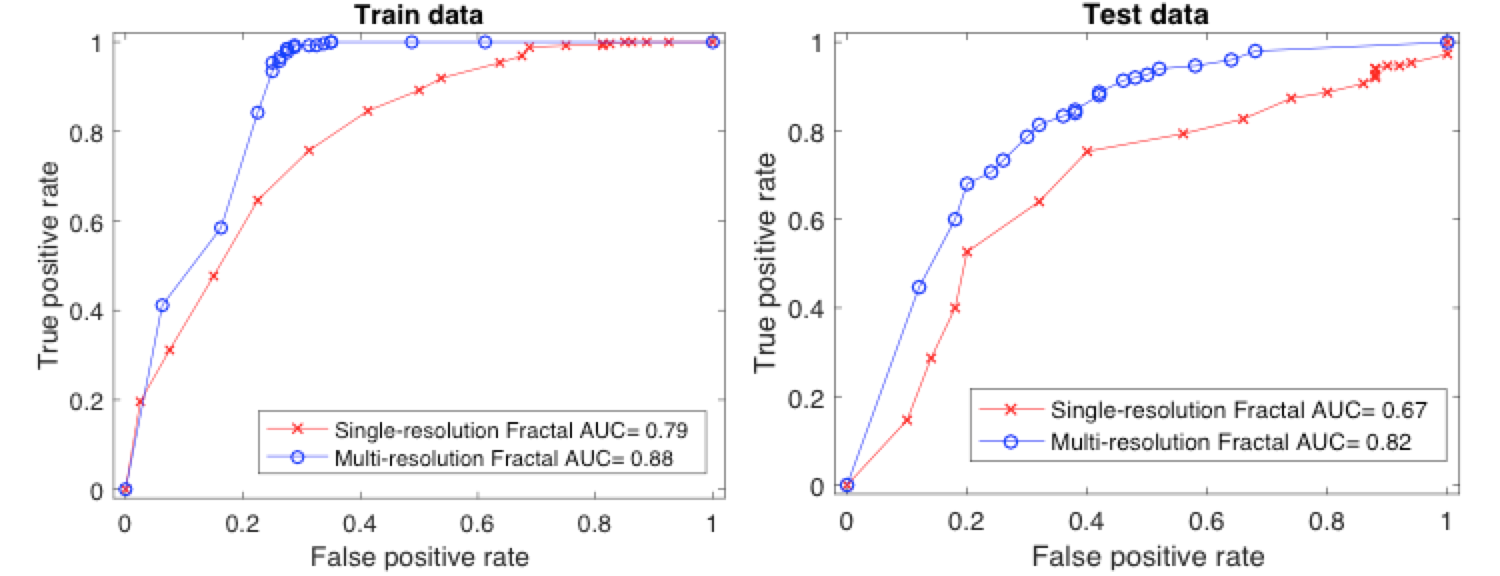
Thirteen patients were pCRs and the other 41 non-pCRs. The number of train-test data split was 8-5 for pCR and 26-15 for non-pCR. Single-resolution FD analysis generated a 4-dimensional feature vector for each patient (from 4 DCE-MRI parameters), whereas multi-resolution FD resulted in a 32-dimensional feature vector. Ten-fold classification8 using SVM provided an accuracy of 71% for single-resolution and 80% for multi-resolution FD analysis, respectively, in prediction of pCR and non-pCR in the test set. The mean ROC curves obtained by 10-fold cross-validation for both approaches are shown in Figure 1. Multi-resolution FD demonstrated better predictive performance than single-resolution FD in both the training and testing data sets.Discussion
This study shows that multi-resolution FD estimated from voxel-based DCE-MRI parametric maps provided good (ROC AUC > 0.8) early prediction of breast cancer response to NACT, and had better predictive ability than single-resolution FD, though the difference in ROC AUC was not statistically significant (P = 0.15) in this small data sets. The advantage of multi-resolution FD analysis may be due to its capability of filtering out irrelevant features and noise at different resolutions and simultaneously rendering more emphasis on distinct features. Our encouraging preliminary results need to be validated with a larger data set. Furthermore, we will compare fractal analyses of the commonly used standard Tofts model (TM)9 and SSM parametric maps for prediction of breast cancer response. With one parameter less (without τi), TM fractal feature vectors have smaller dimensions, which may result in different predictive performance.Acknowledgements
NIH grant support: U01 CA154602References
[1] Ashraf A, Gaonkar B, Mies C, DeMichele A, Rosen M, Davatzikos C, et al. Breast DCE-MRI kinetic heterogeneity tumor markers: preliminary associations with neoadjuvant chemotherapy response. Transl Oncol 2015; 8: 154-162.
[2] Thibault G, Tudorica A, Afzal A, et al. DCE-MRI Texture Features for Early Prediction of Breast Cancer Therapy Response. Tomography. 2017;3(1):23-32
[3] Baish JW, Jain RK. Fractals and cancer. Cancer research. 2000; 60(14): 3683-8.
[4] Al-Kadi OS, Chung DY, Carlisle RC, et al. Quantification of ultrasonic texture intra-heterogeneity via volumetric stochastic modeling for tissue characterization. Medical image analysis. 2015; 21(1): 59-71.
[5] Yankeelov TE, Rooney WD, Li X, and Springer CS. Variation of the relaxographic “Shutter-Speed” for transcytolemmal water exchange affects the CR bolus-tracking curve shape. Magn Reson Med. 2003; 50: 1151-1169.
[6] Kontos D, Bakic PR, Carton AK, et al. Parenchymal texture analysis in digital breast tomosynthesis for breast cancer risk estimation: a preliminary study. Academic radiology. 2009; 16(3): 283-98.
[7] C. Cortes and V. Vapnik, Support-Vector Networks, Machine Learning, 1995; 20(3): 273-297.
[8] Tibshirani, Robert, et al. "Diagnosis of multiple cancer types by shrunken centroids of gene expression." Proceedings of the National Academy of Sciences, 2002; 99(10): 6567-6572.
[9] Tofts PS, Brix G, Buckley DL, Evelhoch JL, Henderson E, Knopp MV, et al. Estimating kinetic parameters from dynamic contrast-enhanced T1-weighted MRI of a diffusable tracer: standardized quantities and symbols. J Magn Reson Imaging 1999;10:223-232.
Figures