3927
Imaging immunotherapy resistance in melanoma in vivo and in vitro employing magnetic resonance1Cancer Systems Imaging, University of Texas MD Anderson Cancer Center, Houston, TX, United States, 2Immunology, University of Texas MD Anderson Cancer Center, Houston, TX, United States
Synopsis
Identifying immunotherapy resistance and underlying molecular mechanisms of resistance will help in stratifying immunotherapy treatment effectively. However, identifying immunotherapy resistance and its causative mechanisms are elusive. Here we have developed mouse models of immunotherapy resistance and identified molecular mechanisms indicating immunotherapy resistance employing magnetic resonance. In vitro studies showed adaptations in metabolic pathways of glycolysis, fatty acid and purine synthesis in resistant cell lines. In vivo experiments with 1-13C hyperpolarized pyruvate revealed higher pyruvate to lactate conversion in immunotherapy resistant mice compared to responding ones. Hence, pyruvate to lactate ratio can be a potential biomarker to identify immunotherapy resistance in vivo.
Introduction
Cancer immunotherapy stands unique among the other available cancer therapies since it triggers our own immune system to fight cancer. Cancer immunotherapy mainly works on blocking the immune checkpoint proteins: either Cytotoxic T- Lymphocyte-1 (CTLA4) or Programmed death -1 (PD1) or both1. The technique has witnessed successful application in melanoma. However, not all melanoma patients respond to immunotherapy. The biological molecular mechanisms which drive resistance to immunotherapy are elusive. To understand this crucial knowledge gap, immunotherapy resistant melanoma mouse strains are developed, and underlying biological molecular mechanisms to resistance are unraveled employing Nuclear Magnetic Resonance Spectroscopy (NMR) and Magnetic Resonance Imaging (MRI). The immunotherapy resistant melanoma strains were developed by an in vivo serial passage approach. The cell lines derived from parental (TMT) and resistant (F4) strains were used for in vitro NMR studies.
Methods
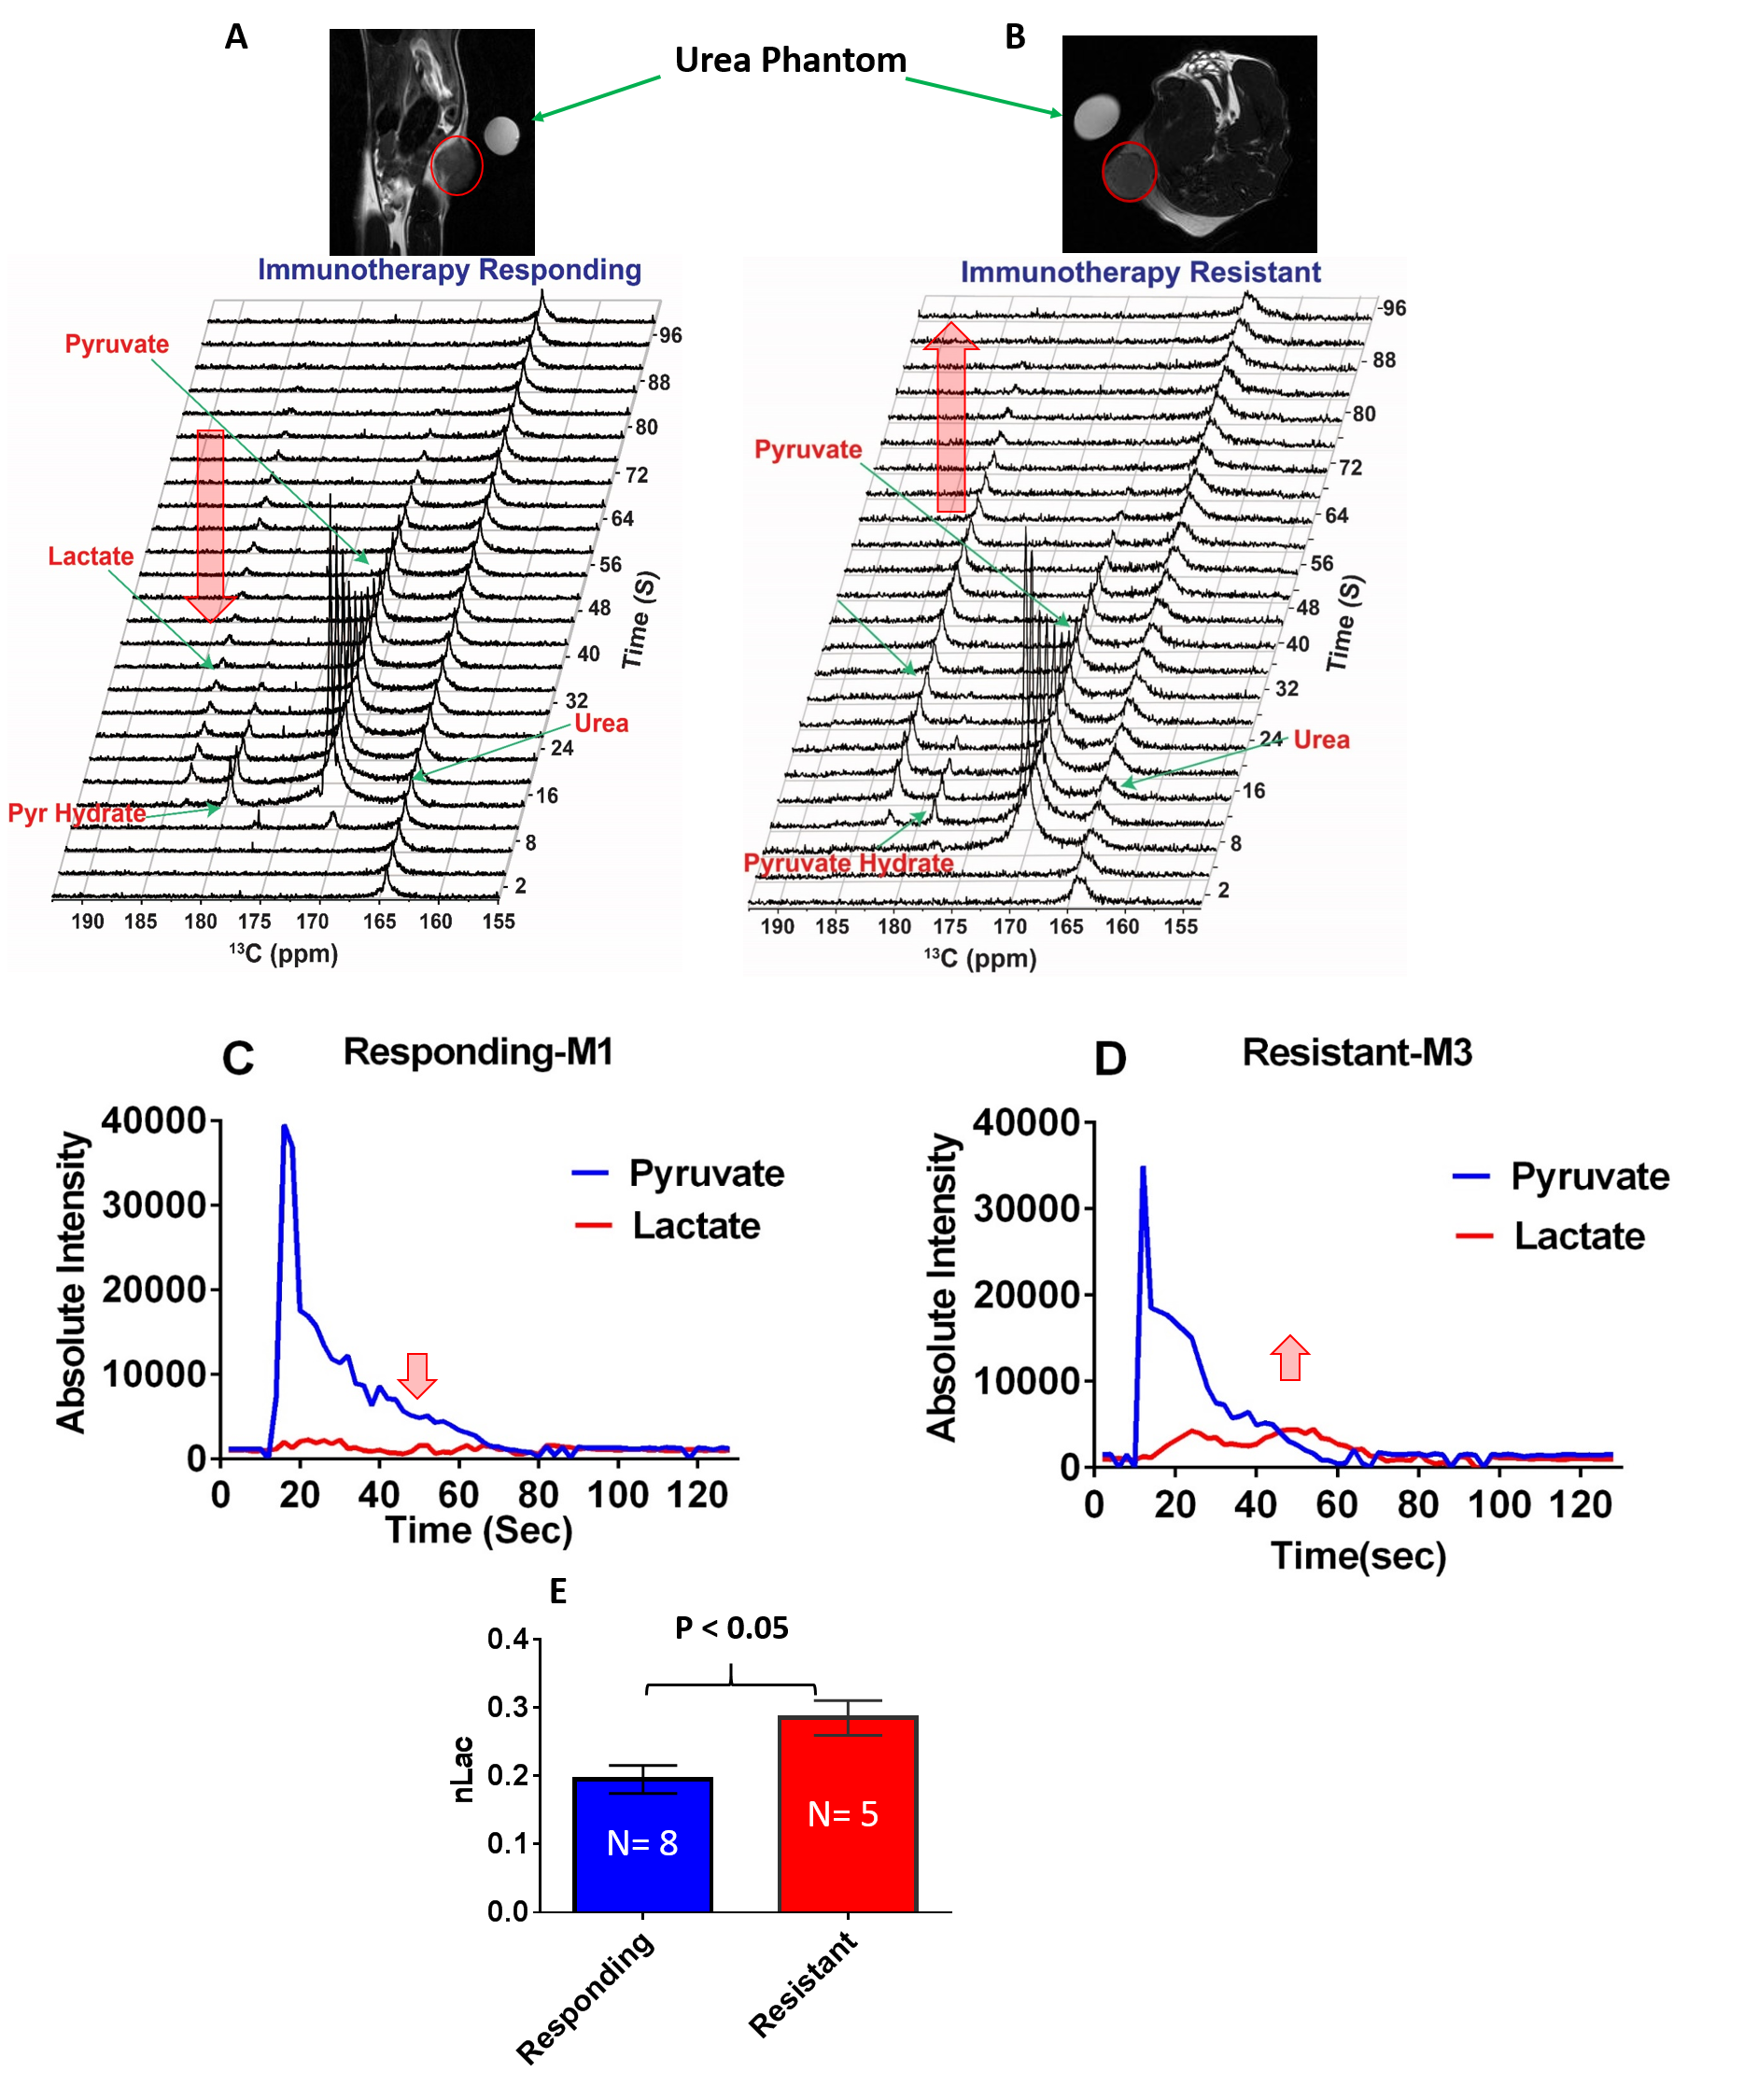
Nuclear Magnetic Resonance (NMR) spectroscopy is employed as an analytical tool to understand the metabolic responses of immunotherapy resistant and responding melanoma cell lines and tissues in vitro and ex vivo respectively. The metabolites were extracted using 2:1 methanol-water solvent extraction by mechanical vertex and freeze-thaw. The samples were prepared for NMR spectroscopy by dissolving the sample in 2H2O containing the reference compound 4, 4-dimethyl-4-silapentane-1-sulfonic acid-d6 (DSS). The data were acquired on a Bruker NMR spectrometer operating at 500 MHz 1H resonance frequency equipped with a cryogenically cooled triple resonance (1H, 13C, 15N) TXI probe2. Identification of metabolite peaks was done through Chenomx and the Human Metabolomic Database (HMDB); finally, the peaks were integrated in Topspin and normalized to the reference compound (DSS). All spectra were normalized to cell count before analysis. Hyperpolarized 1-13C pyruvate magnetic resonance spectroscopy (MRS) was employed to study immunotherapy response and resistance in vivo in mice model3. The dissolution DNP (HyperSense, Oxford Instruments) operating at 3T was employed to hyperpolarize 1-13C pyruvate. The 13C magnetic resonance spectra of hyperpolarized 1-13C pyruvate were acquired at 7T Bruker MRI scanner on intact, live immunocompetent mice models with melanoma tumor implanted in flank.Results
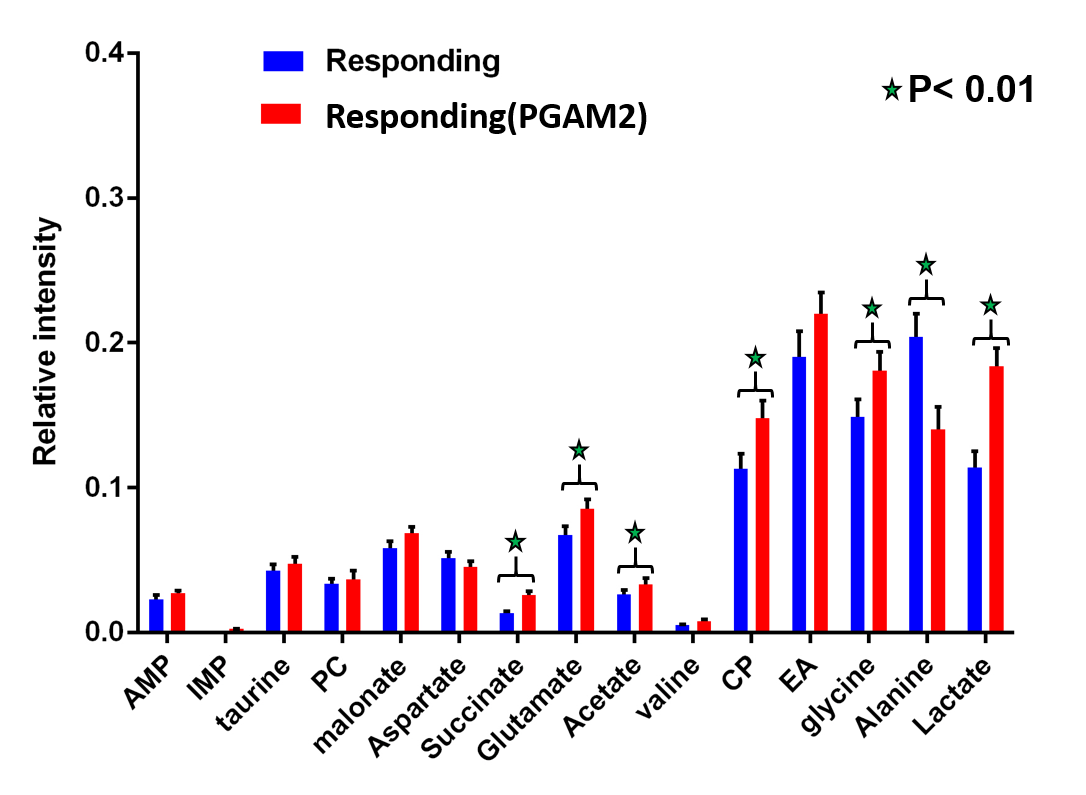
NMR results revealed upregulation in concentration of lactate, acetate, alanine and glycine in resistant cell lines compared to responding cell lines (Figure 1). Whereas adenosine mono phosphate (AMP) and phosphocholine are down regulated in resistant cell lines compared to responding, the ex vivo tissue analysis of resistant and responding mice tumors confirmed the up regulation in concentration of lactate in the resistant mice. Metabolic imaging by hyperpolarized 1-13C pyruvate using magnetic resonance (MR) revealed higher pyruvate to lactate conversion in immunotherapy resistant mice compared to responding ones in vivo (Figure 2).Discussion
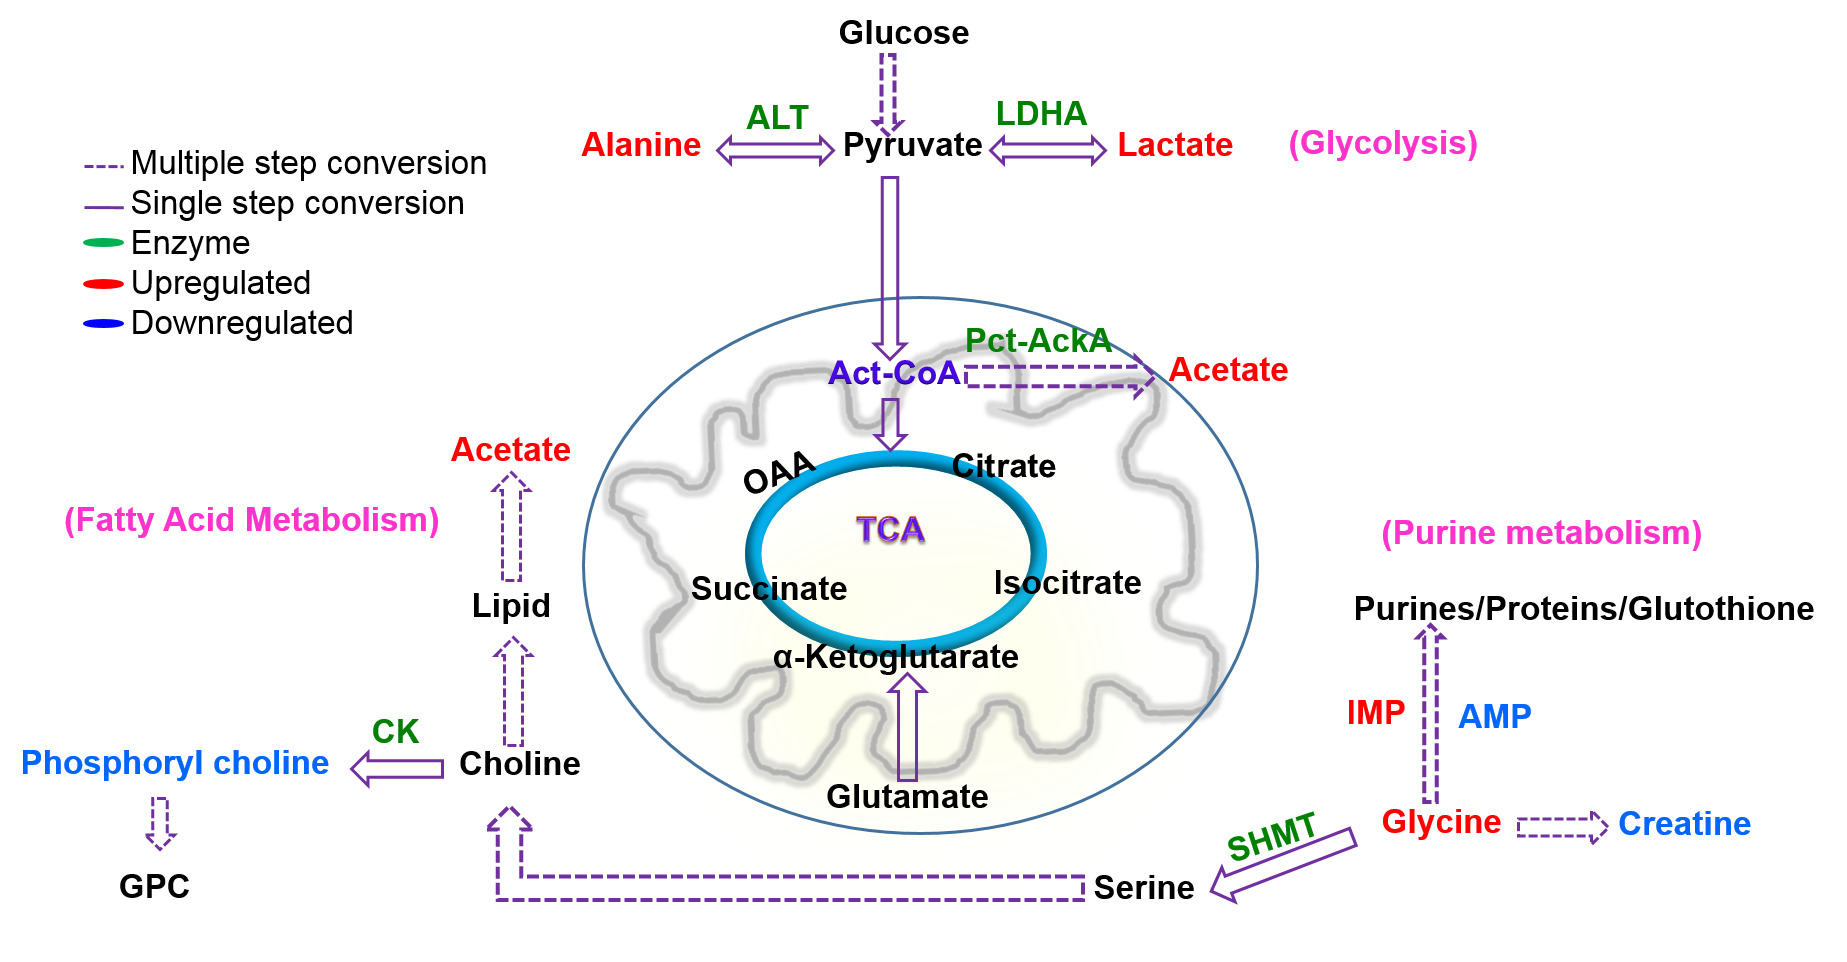
The concentration of lactate, acetate, alanine and glycine are up regulated and adenosine mono phosphate (AMP) and phosphocholine are down regulated in resistant cell lines compared to responding cell lines. This demonstrates adaptations in metabolic pathways of glycolysis, fatty acid synthesis and purine synthesis. These data are correlated with up regulation of Phosphoglycerate mutase-2 (PGAM2) and Alcohol dehydrogenase-7 (ADH7) genes in resistant strains. Furthermore, the mice bearing resistant tumors showed higher real-time pyruvate to lactate conversion compared to responding ones in vivo in the hyperpolarized metabolic imaging studies of intact animals. This suggests that tumor cells adapt to more glycolytic pathways which is one of the dominant mechanisms for immunotherapy resistance. The lactate to pyruvate ratio calculated from hyperpolarized 1-13C pyruvate MR spectroscopy in vivo will serve as a metabolic biomarker to distinguish immunotherapy resistant and responding mice.Conclusion
Altered metabolism in glycolysis, purine metabolism and fatty acid metabolism validated by NMR spectroscopy in vitro and hyperpolarized MR spectroscopy in vivo are important metabolic pathways to be targeted for effective immunotherapy (Figure 3). NMR and hyperpolarized MR are promising tools that may be employed to distinguish patients responding and resistant to immunotherapy in melanoma in the near future.Acknowledgements
SP and PB thank the Department of Cancer Systems Imaging and Small Animal Imaging Facility (SAIF) at The University of Texas MD Anderson Cancer Center for imaging resources supported by NIH/NCI CCSG grant P30CA016672. SP acknowledge Computational Cancer Biology Training Program (CCBTP) Fellowship, training grant award RP170593 from the Cancer Prevention & Research Institute of Texas (CPRIT). This research has been funded in part by CPRIT RP 150701, MD Anderson Institutional Research Grants , MD Anderson Institutional Startup, Brain SPORE Developmental Research Award, John S. Dunn Foundation and Koch Foundation.References
1. Wolchok, J. D.; Kluger, H.; Callahan, M. K.; Postow, M. A.; Rizvi, N. A.; Lesokhin, A. M.; Segal, N. H.; Ariyan, C. E.; Gordon, R.-A.; Reed, K.; Burke, M. M.; Caldwell, A.; Kronenberg, S. A.; Agunwamba, B. U.; Zhang, X.; Lowy, I.; Inzunza, H. D.; Feely, W.; Horak, C. E.; Hong, Q.; Korman, A. J.; Wigginton, J. M.; Gupta, A.; Sznol, M., Nivolumab plus Ipilimumab in Advanced Melanoma. New England Journal of Medicine 2013, 369 (2), 122-133.
2. Pudakalakatti, S. M.; Uppangala, S.; D'Souza, F.; Kalthur, G.; Kumar, P.; Adiga, S. K.; Atreya, H. S., NMR studies of preimplantation embryo metabolism in human assisted reproductive techniques: a new biomarker for assessment of embryo implantation potential. NMR in Biomedicine 2013, 26 (1), 20-27.
3. Albers, M. J.; Bok, R.; Chen, A. P.; Cunningham, C. H.; Zierhut, M. L.; Zhang, V. Y.; Kohler, S. J.; Tropp, J.; Hurd, R. E.; Yen, Y.-F.; Nelson, S. J.; Vigneron, D. B.; Kurhanewicz, J., Hyperpolarized (13)C Lactate, Pyruvate, and Alanine: Noninvasive Biomarkers for Prostate Cancer Detection and Grading. Cancer research 2008, 68 (20), 8607-8615.
Figures