3926
Spatial comparison of in vivo MRI with digital histology validates R2* as a biomarker of vascular hemodynamics in the Th-MYCN model of neuroblastoma1Division of Radiotherapy and Imaging, Institute of Cancer Research, London, United Kingdom, 2Division of Clinical Studies, Institute of Cancer Research, London, United Kingdom, 3Division of Molecular Pathology, Institute of Cancer Research, London, United Kingdom
Synopsis
This study explores the use of automated image analysis pipelines and kernel density estimation (KDE) analysis for hotspot mapping as a generic methodology to spatially evaluate MRI biomarkers with corresponding high-resolution whole-slide digital histology, used here to validate the transverse relaxation R2* as a biomarker of vascular hemodynamics in the Th-MYCN transgenic mouse model of childhood neuroblastoma.
Introduction / Purpose
MRI biomarkers can noninvasively inform on both spatial and temporal changes in key hallmarks of tumour patho-physiology and can potentially assist in the delivery of precision medicine to patients with cancer. This noninvasive potential is of particular importance in the pediatric population where the difficulty of obtaining post-surgical biopsy often prevents the assessment of conventional pharmacodynamic biomarkers of response to treatment.1 MRI biomarkers require robust histopathological cross-validation before they can routinely be deployed in clinical trials,2 a process that can often only be meaningfully done in animal models of cancer.
In this study, we explore the use of automatic image analyses pipelines developed with publicly available software tools and kernel density estimation (KDE) 3,4 for hotspot mapping, as a generic methodological pipeline to spatially evaluate MRI biomarkers with corresponding histology. We specifically use this approach to demonstrate the spatial association of the native MRI transverse relaxation rate R2* (which is sensitive to endogenous paramagnetic deoxyhemoglobin) with aggregated red blood cells (RBC), a characteristic of the hypervascular and hemorraghic phenotype of the Th-MYCN transgenic mouse of childhood neuroblastoma, and which can be exploited to stratify tumours with genetic variants and predict long-term response to vascular-targeted therapies.5,6
Methods
All experiments were performed in accordance with the UK Home Office Animals (Scientific Procedures) Act 1986 and the United Kingdom National Cancer Research Institute guidelines for the welfare of animals in cancer research.7
MRI. Tumor bearing Th-MYCN mice (n=12) were imaged on a 7T Bruker MicroImaging system. Intrinsic-susceptibility MRI was performed and R2* was calculated voxel-wise with a robust Bayesian approach, as previously described (multi-gradient echo sequence, FOV 3x3cm2, 128x128 matrix, TE=6-30ms, 8 TEs, TR=200ms, NEX=8).6
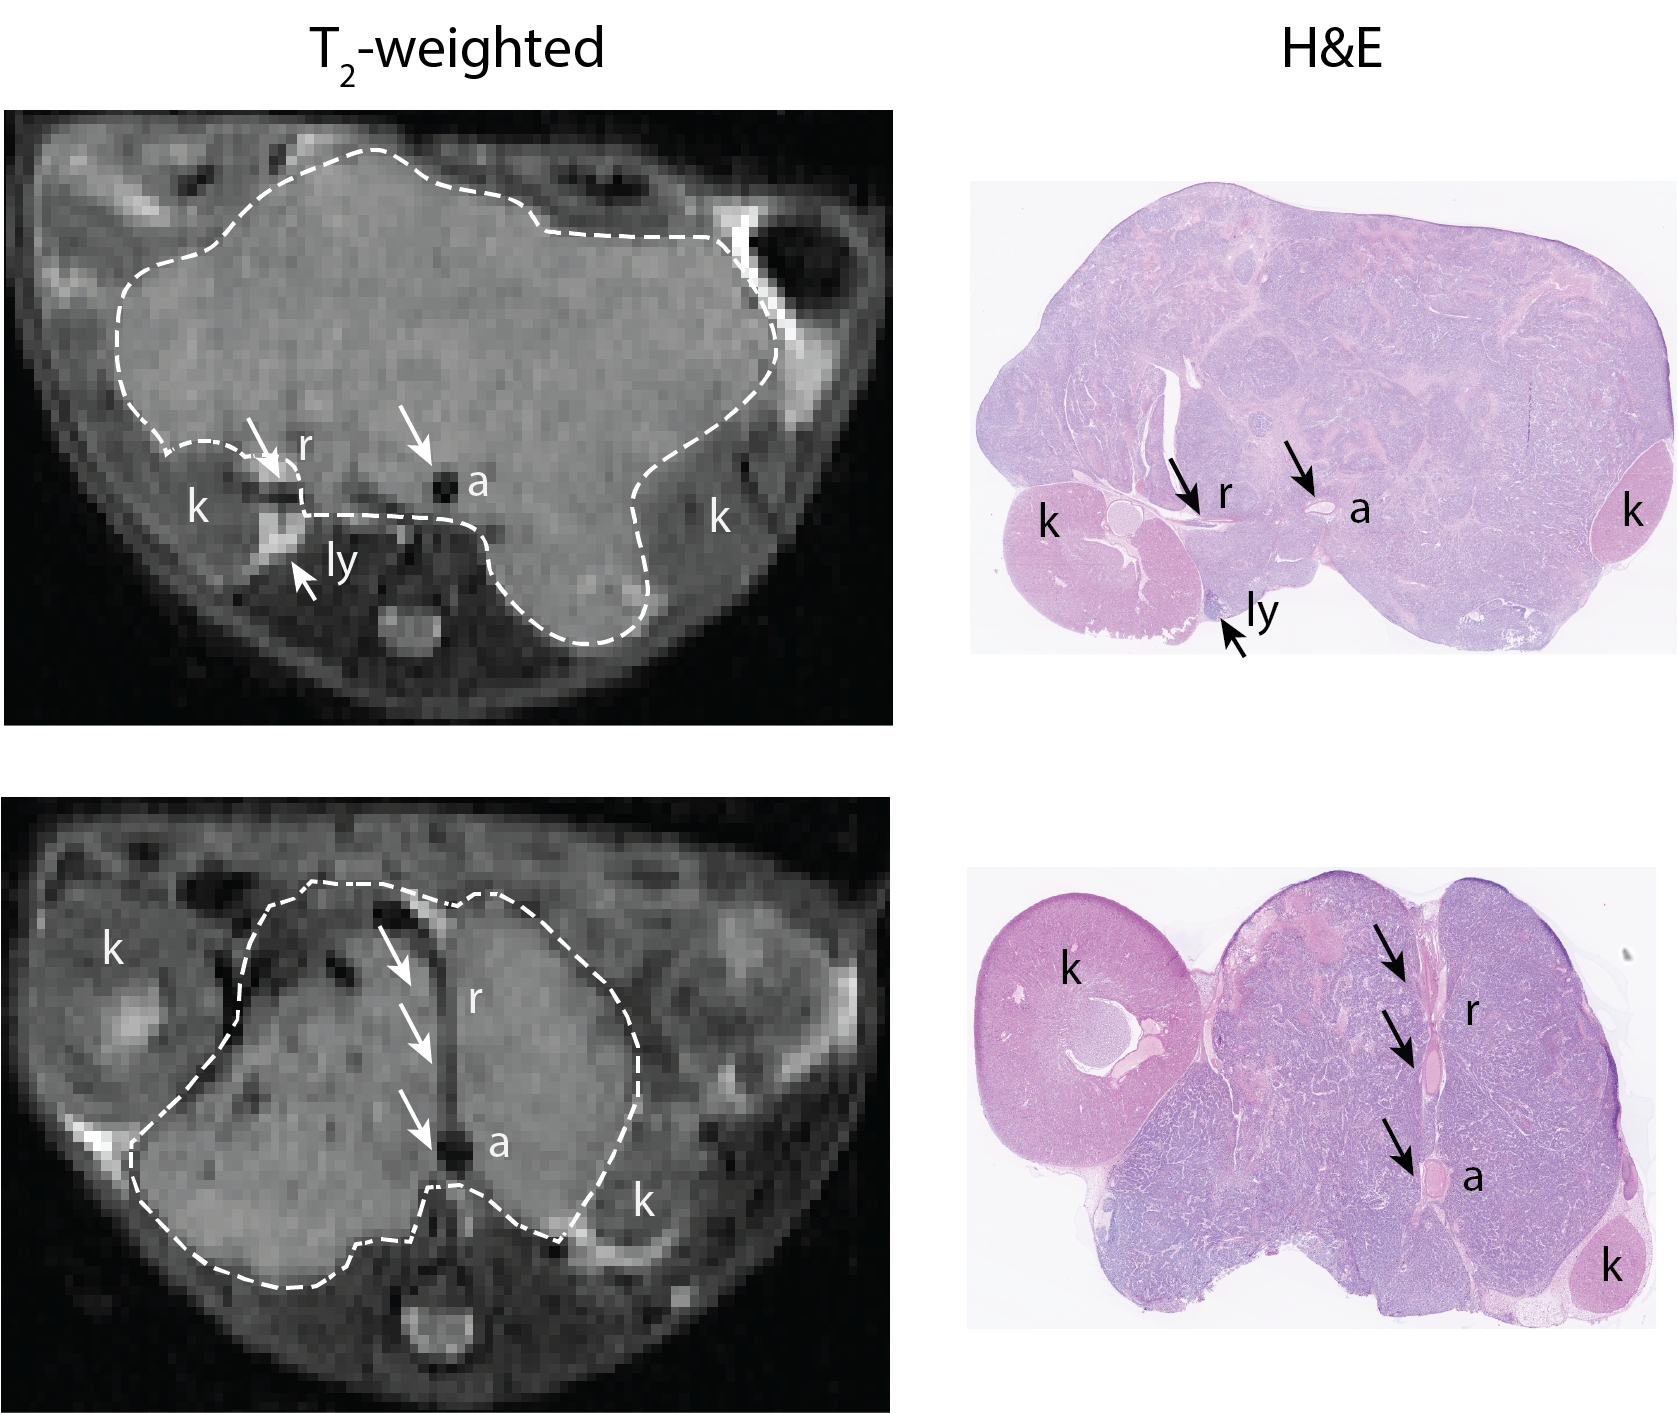
Tissue preparation. Guided by T2-weighted anatomical images, tumors were carefully excised and orientated for subsequent histopathological processing. Formalin-fixed and paraffin embedded tumors were cut in 3μm sections and were stained with hematoxylin and eosin (H&E).
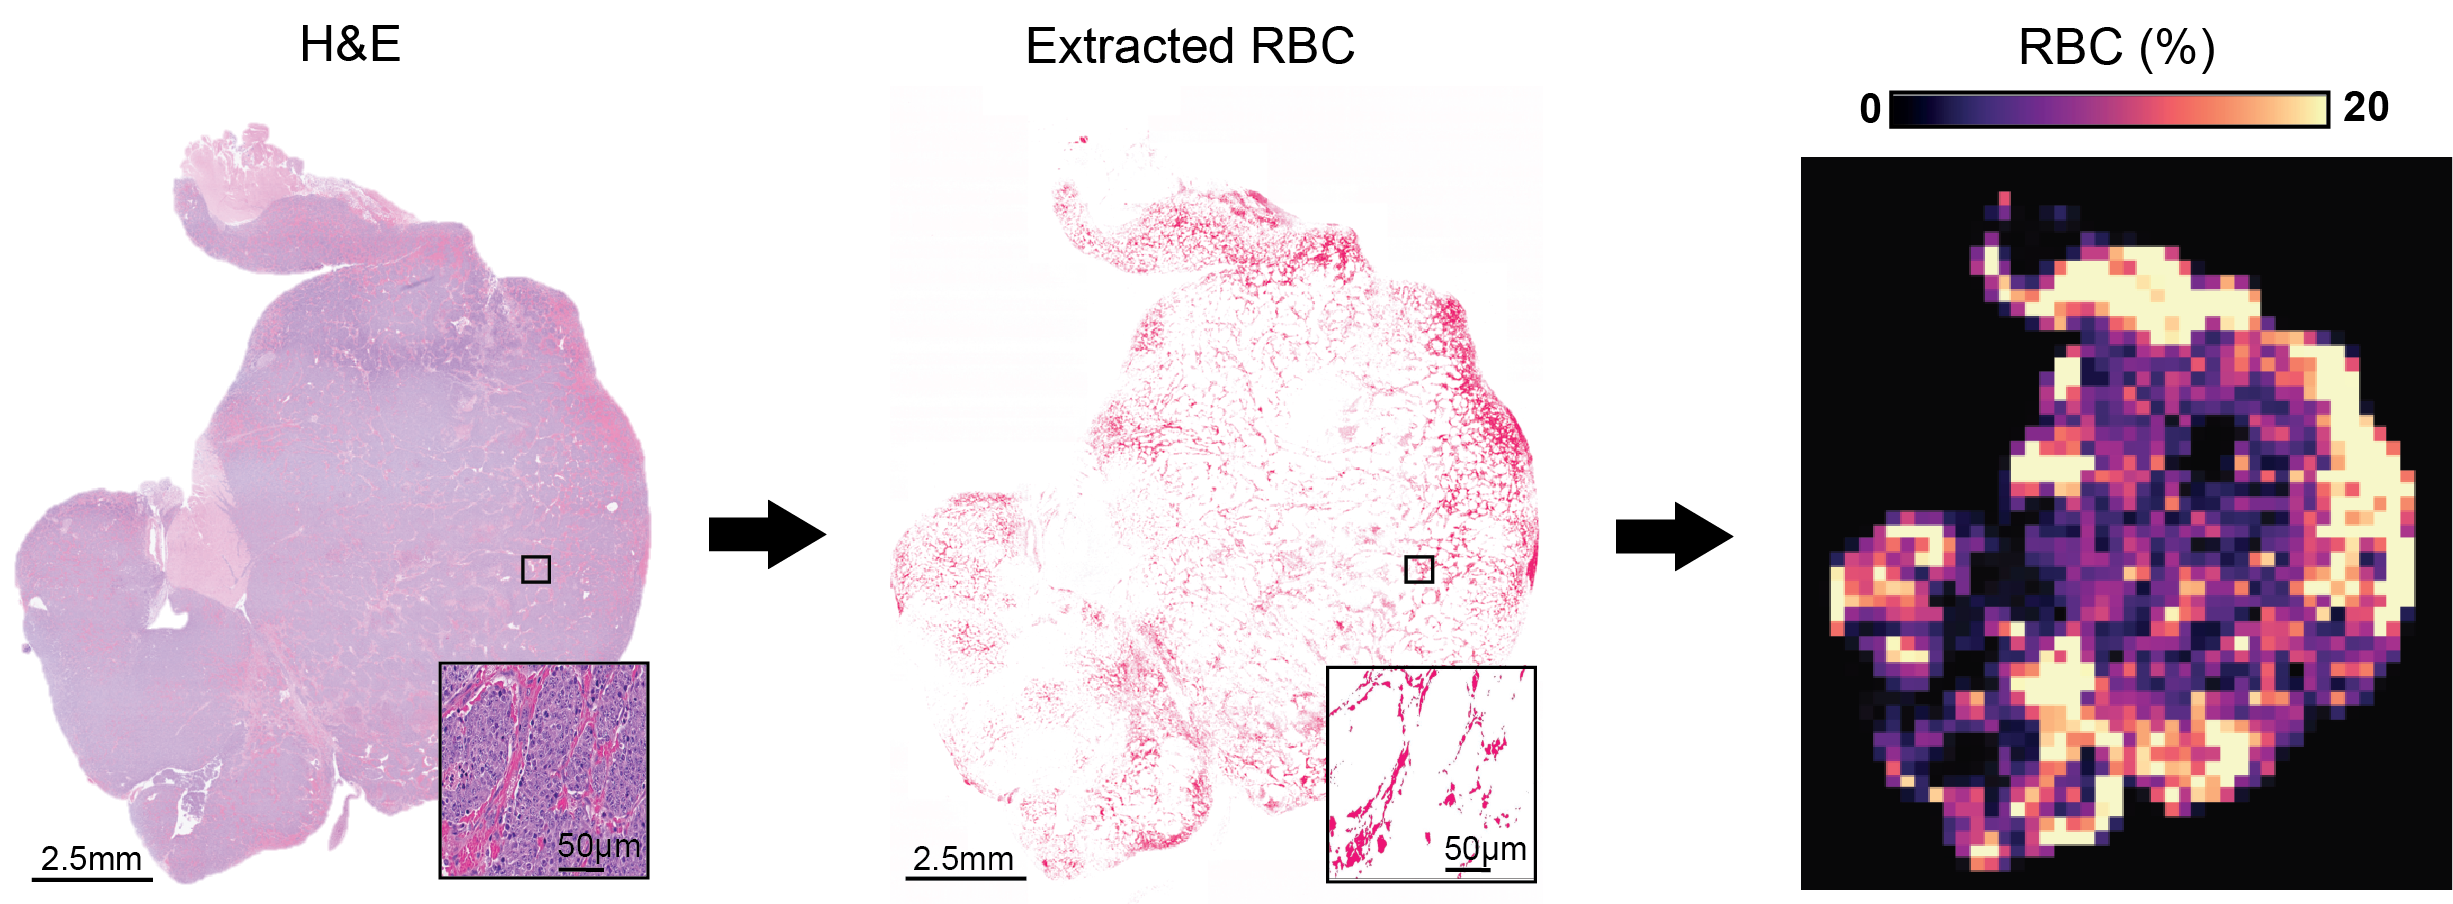
Digital pathology. Algorithm was developed to extract RBC and was performed on digitized whole-slide histopathological H&E slides (20x magnification, Hamamatsu NanoZoomer XR) showing good spatial correspondence with T2-weighted images (Fig 1). RBC parametric maps were generated as described in Fig 2. Algorithm accuracy was evaluated using independent annotation of 561 RBC and 591 non-RBC points in 9 samples.
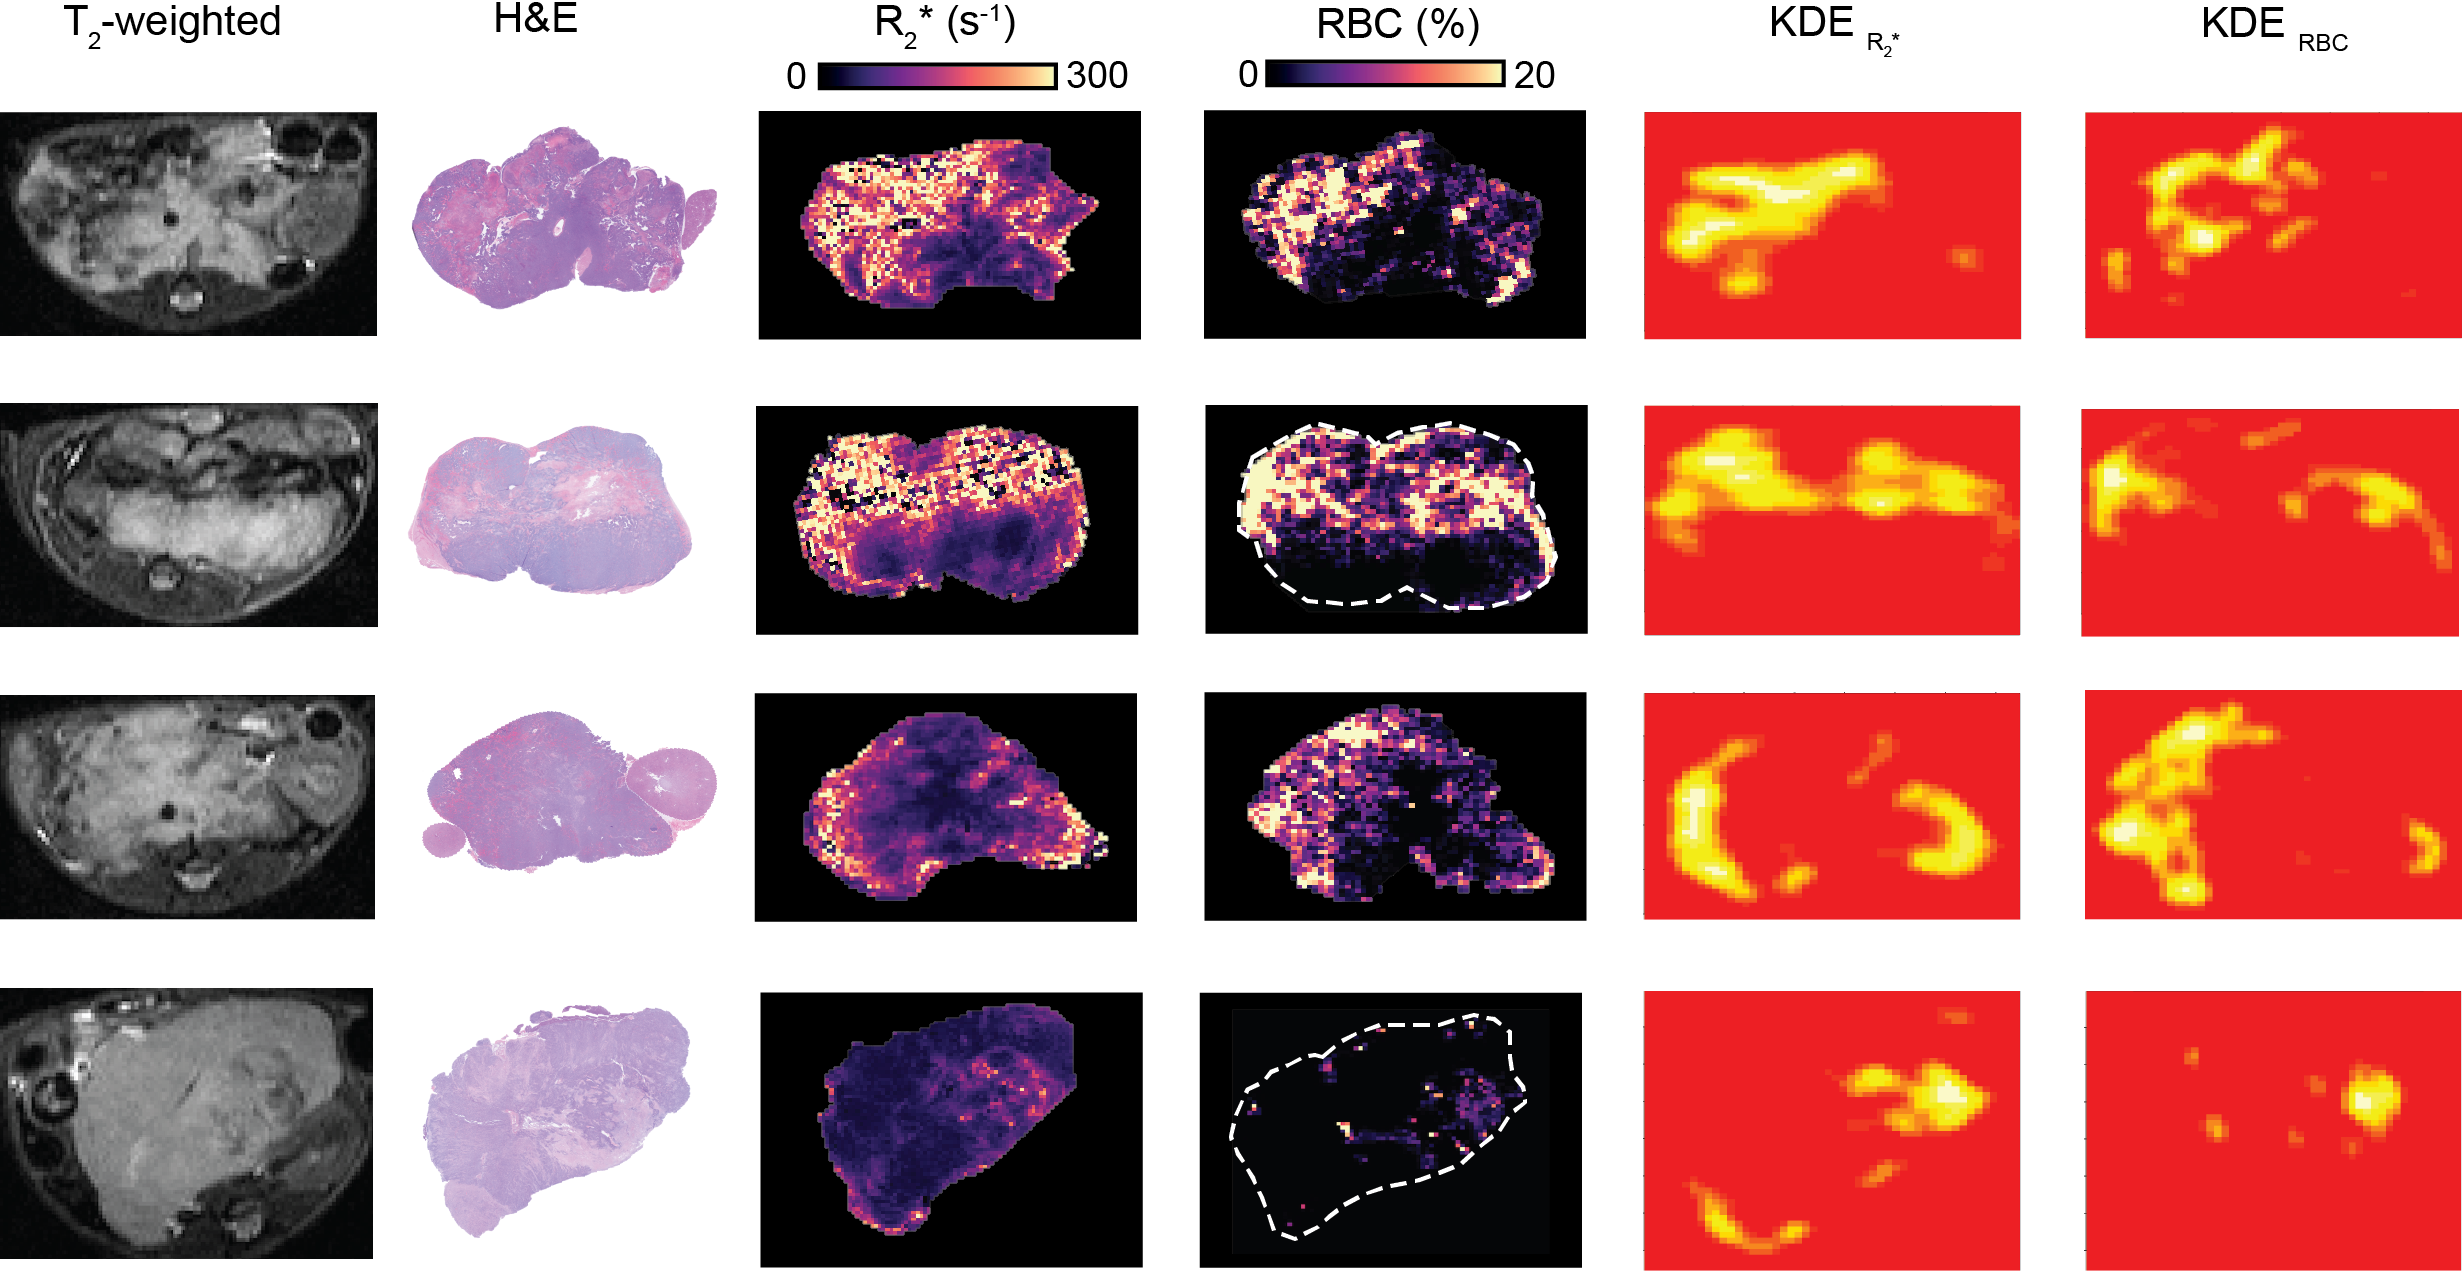
R2* and RBC parametric maps comparison was performed visually following the application of KDE to display hotspots of high, above the 85th percentile, R2* and RBC % values using the ‘MASS’ package in R.
Results
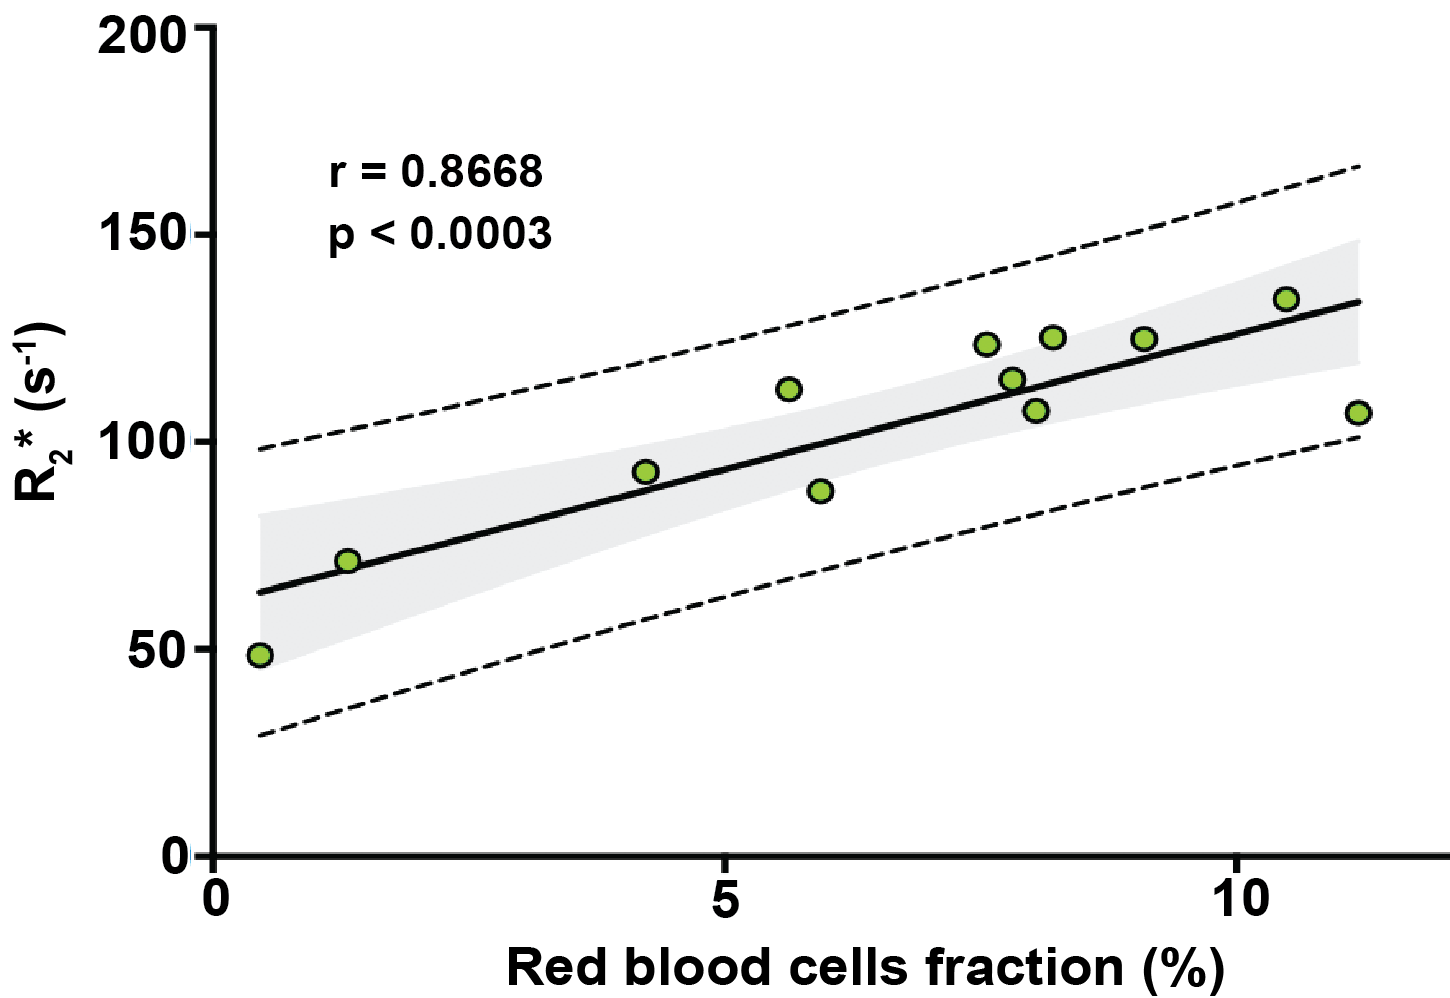
The accuracy of the algorithm for RBC extraction was 99.74%. Regional differences in R2* maps visually reflected regional variation in RBC aggregation on both parametric maps which was corroborated by the location, size and shapes of hotspots on both KDE maps of R2* and RBC (Fig 3). Calculated median values of R2* correlated strongly with mean values of RBC fraction area (r=0.8668, p<0.0003) (Fig 4).Discussion
In this study, we demonstrate that i) MRI-pathology correspondence in the Th-MYCN model of neuroblastoma can improve biomarker validation through the interrogation of regional variation and that ii) the ability of KDE to show hotspot location, orientation, size and shape can be used to visually evaluate spatial correspondence between MRI and histology generated maps. KDE thus provides an alternative to pixel-to-pixel MRI-pathology registration, which is extremely difficult due to the marked deformation associated with tissue fixation and processing, in addition to cutting angles both at excision and during section cutting.
This MRI/histology comparison study also demonstrates that R2* robustly maps the characteristic network of aggregated RBC in the tumour of the Th-MYCN model, which warrants its current evaluation in early-phase pediatric clinical trials in neuroblastoma.
Conclusion
Our MRI/histopathology pipeline validates R2* parameter as a biomarker of vascular hemodynamics in the Th-MYCN model of neuroblastoma. The generic application of our digital pathology-based pipeline should provide a better understanding and robust validation of noninvasive MRI biomarkers for the noninvasive characterization and mapping of neuroblastoma pathology.Acknowledgements
Rosetrees Trust grant A1091, The Institute of Cancer Research Cancer Research UK Cancer Imaging Centre in association with the MRC and Department of Health grant C1060/A16464, Children with Cancer UK, NHS funding to the NIHR Biomedical Research Centre and an Experimental Cancer Medicine Centre Network award C51/A7401&C12540/A15573.References
1. Daldrup-Link, H.E., Sammet, C., Hernanz-Schulman, M., et al. White paper on P4 concepts for pediatric imaging. Journal of the American College of Radiology 13, 590-597. e592 (2016).
2. O'Connor, J.P., Aboagye, E.O., Adams, J.E., et al. Imaging biomarker roadmap for cancer studies. Nat Rev Clin Oncol 14, 169-186 (2017).
3. Parzen, E. On Estimation of a Probability Density Function and Mode. Ann. Math. Statist. 33, 1065-1076 (1962).
4. Chainey, S., Tompson, L. & Uhlig, S. The utility of hotspot mapping for predicting spatial patterns of crime. Security Journal 21, 4-28 (2008).
5. Jamin, Y., Poon, E., Jerome, N.P., et al. Intrinsic susceptibility MRI predicts response to the vascular endothelial growth factor receptor inhibitor cediranib in the Th-MYCN model of neuroblastoma. Proc Int Soc Magn Med, #4467 (2017).
6. Jamin, Y., Glass, L., Hallsworth, A., et al. Intrinsic susceptibility MRI identifies tumors with ALK F1174L mutation in genetically-engineered murine models of high-risk neuroblastoma. PloS one 9, e92886 (2014).
7. Workman, P., Aboagye, E.O., Balkwill, F., et al. Guidelines for the welfare and use of animals in cancer research. Br J Cancer 102, 1555-1577 (2010).
8. Otsu, N. A threshold selection method from gray-level histograms. IEEE transactions on systems, man, and cybernetics 9, 62-66 (1979).
9. Schindelin, J., Arganda-Carreras, I., Frise, E., et al. Fiji: an open-source platform for biological-image analysis. Nature methods 9, 676-682 (2012).
10. Schindelin, J., Rueden, C.T., Hiner, M.C., et al. The ImageJ ecosystem: An open platform for biomedical image analysis. Molecular reproduction and development 82, 518-529 (2015).
Figures