3925
Assessment of Tumor Microenvironment to Determine the Most Suitable Therapeutic Window in an Ovarian Cancer Model1Imaging and Pathology, KU Leuven, Leuven, Belgium, 2UZ Leuven, Leuven, Belgium, 3ESAT - STADIUS, Stadius Centre for Dynamical Systems, Signal Processing and Data Analytics, KU Leuven, Leuven, Belgium, 4Imec, Leuven, Belgium
Synopsis
Multimodal imaging, i.e. combining (simultaneous) positron emission tomography (PET)-magnetic resonance imaging (MRI) and bioluminescence imaging (BLI) allows in-depth assessment of changes in tumor microenvironment over time. In this study, the development of human ovarian xenografts in mice was longitudinally monitored using BLI and PET-MRI to identify the most suitable time window to test nanomaterial-based therapies. Under these conditions, xenografts are viable, vascularized and metabolically active tumor masses with leaky blood vessels after four weeks, indicating a suitable time point for nanomaterial administration. This suggests that a combination of PET, MRI and BLI allows the identification of potential therapeutic windows.
Purpose
As ovarian cancer is a major cause of cancer-related deaths, it is key to develop new treatments to battle the disease1. To optimally deliver novel therapeutics, understanding how tumors and their microenvironment change over time is essential. In a conventional clinical setting, tumor evolution can be assessed using whole-body MRI or PET, providing only limited information. Therefore, we developed a preclinical, longitudinal, non-invasive multimodal imaging approach, combining MRI or simultaneous PET-MRI and BLI, to characterize a xenograft model of ovarian cancer. Ultimately, these results will be used to determine changes in tumor metabolism, vascularization, blood vessel integrity and morphology to define the most suitable strategy for nanomaterial-based therapy.Methods
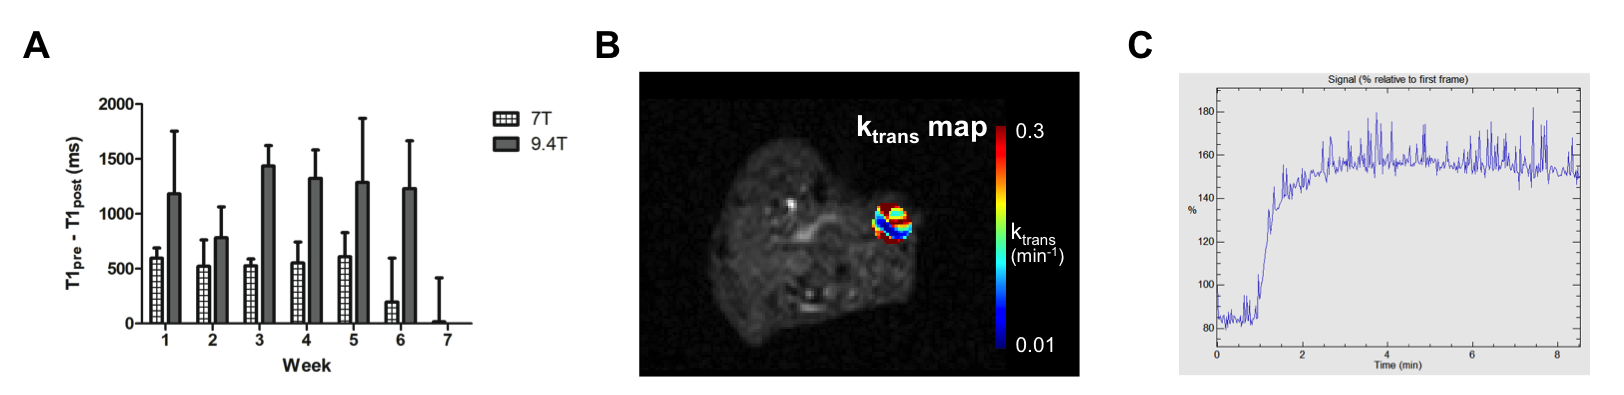
Xenografts were generated in Swiss nude mice (n=9) by subcutaneous injection of 107 firefly luciferase-expressing human ovarian cancer (SKOV-3) cells and were imaged weekly. Data were acquired on a preclinical 9.4T MRI with clear bore size of 20 cm (n=6, Bruker Biospec) and on a 7T small-animal horizontal bore (30 cm) MRI (n=3) with a PET insert for simultaneous data acquisition (Bruker PCI) using a quadrature transmit-receive coil (Bruker Biospin). Tumor microstructure, vascularization and perfusion were characterized using 2D T2-weighted fast spin echo (RARE), diffusion-weighted (RARE) and dynamic contrast enhanced protocols (FLASH, scan parameters: see Fig. 1). For the latter, 0.2 – 0.4 mmol/kg of Magnevist® (Bayer) was injected IV while scanning. Furthermore, T1 (variable repetition time fast spin echo) and T2 quantitative maps (multi-slice multi-echo) were acquired and generated in Paravision 6.0.1 (Bruker Biospin). To identify clusters of different apparent diffusion coefficients (ADC) and T2 values, a k-means clustering algorithm was used. Simultaneously with MR acquisition on the 7T MRI system, one hour static PET scans were acquired one hour after IV injection of 2.66 – 7.28 MBq 18F-FDG after fasting the mice overnight. The PET scans were co-registered with 3D anatomical MRI images (T2-weighted fast spin echo, RARE) using PMOD version 3.8. Xenograft viability was evaluated via BLI (IVIS Spectrum, Perkin Elmer). Hereby, total flux was determined using Living Image software version 4.5.2 (Perkin Elmer). Statistical analyses were performed in GraphPad Prism version 5.04.Results
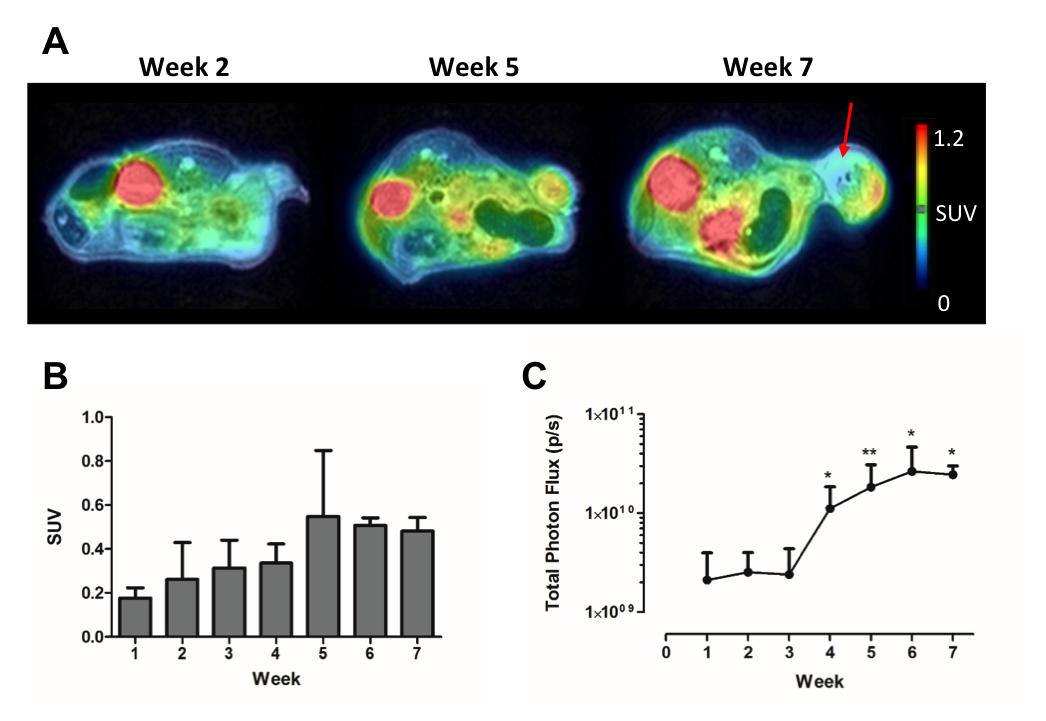
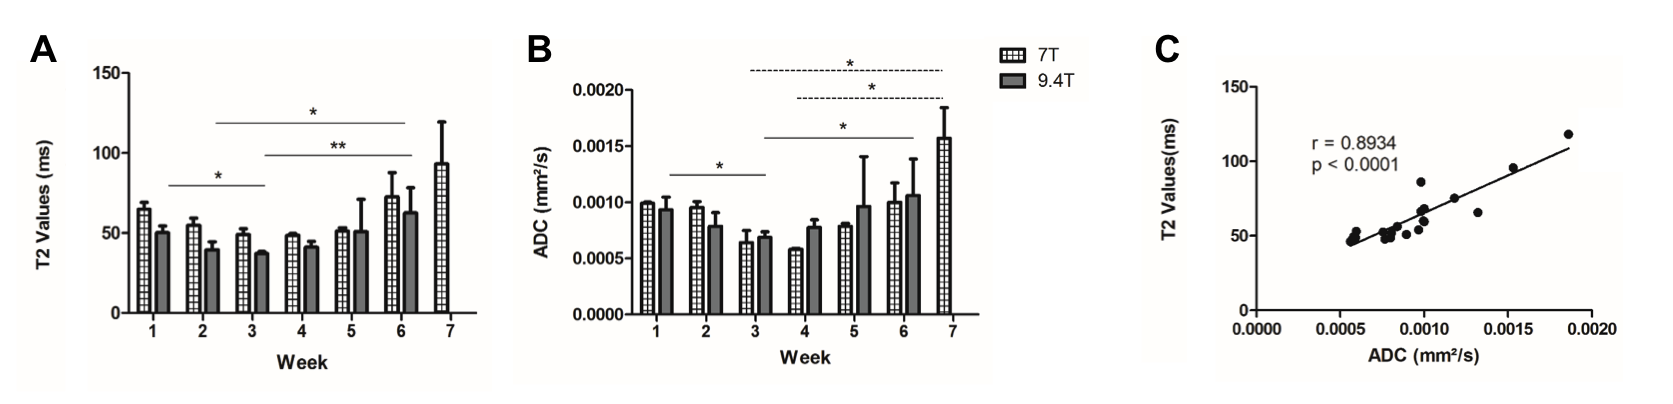
The number of viable cells increased during the first 6 weeks (w), while 18F-FDG uptake augmented until w5 of tumor development (Fig. 2). In contrast, T2 and ADC values only decreased early in tumor development (w2 – w4), indicating a dense tumor mass and tumor growth. From w5, both parameters increased, which was further supported by the presence of hyperintense tumor areas on T2-weighted images (Fig. 2A and 3A-B). A significant correlation was found between both parameters (two-way Spearman correlation, on 7T: r = 0.8934, on 9.4T: r = 0.6370 (both p < 0.0005), Fig. 3C). Furthermore, T2 and ADC clustering showed largely homogeneous tumors at initial time points. However, tumor heterogeneity increased at the end-stage of tumor growth (w5-w7), with tracer uptake correlating with areas of lower T2 and ADC values (Fig. 4). Lastly, tumors appeared vascularized from the beginning, as Magnevist® was taken up from w1, and blood vessels were leaky at later time points (Fig. 5).Discussion and Conclusions
In this study, we show that early time point tumors are largely homogeneous dense tumor masses. However, increase in 18F-FDG uptake and cell viability, and rapid tumor growth is only visible from w4. From w5, tumors become more heterogeneous with large areas of edema and necrosis. Furthermore, a large intra- and inter-animal variability at different time points is visible at different time points. For novel therapeutic approaches, e.g. theranostic nanoparticles, deciding on the optimal time point to start treatment in this xenograft model is a balancing act, as therapy will fail if the tumor is not reached. Currently, translation of nanoparticle therapy to the clinic is prevented due to less than 1% of particles reaching the tumor², therefore, the presence of tumor vascularization and leaky blood vessels is essential. However, prolonged growth could lead to edema and necrosis, as shown here, making it difficult to test any new therapy. In conclusion, these results show that our multimodal imaging approach provides dynamic information on tumor development in a non-invasive manner on an individual basis. The presence of leaky blood vessels and a growing metabolically active tumor mass suggest that, overall, w4 is a suitable time point to administer nanomaterial-based therapy. However, the large variability between subjects may warrant a more personalized approach. More automated assessment of tumor subtypes using non-negative matrix factorization, as previously described3, which may further improve prediction of potential therapeutic windows in this model of ovarian cancer.Acknowledgements
The research leading to these results received funding from the KU Leuven Funding Program ‘In Vivo Molecular Imaging Research’ (IMIR) and the IWT Strategic Basic Research Grant n°140061 from the Flemish Government. SB also received support from the Academische Stichting Leuven.References
1 Siegel et al., Cancer Statistics, 2017, Ca Cancer J Clin 2017;67:7–30, ² Wilhelm et al., Analysis of nanoparticle delivery to tumours, Nat Rev Mat 2016;1:1-12, 3 Sauwen et al., Semi-automated brain tumor segmentation on multi-parametric MRI using regularized non-negative matrix factorization, BMC Med Imaging 2017;17:29.Figures

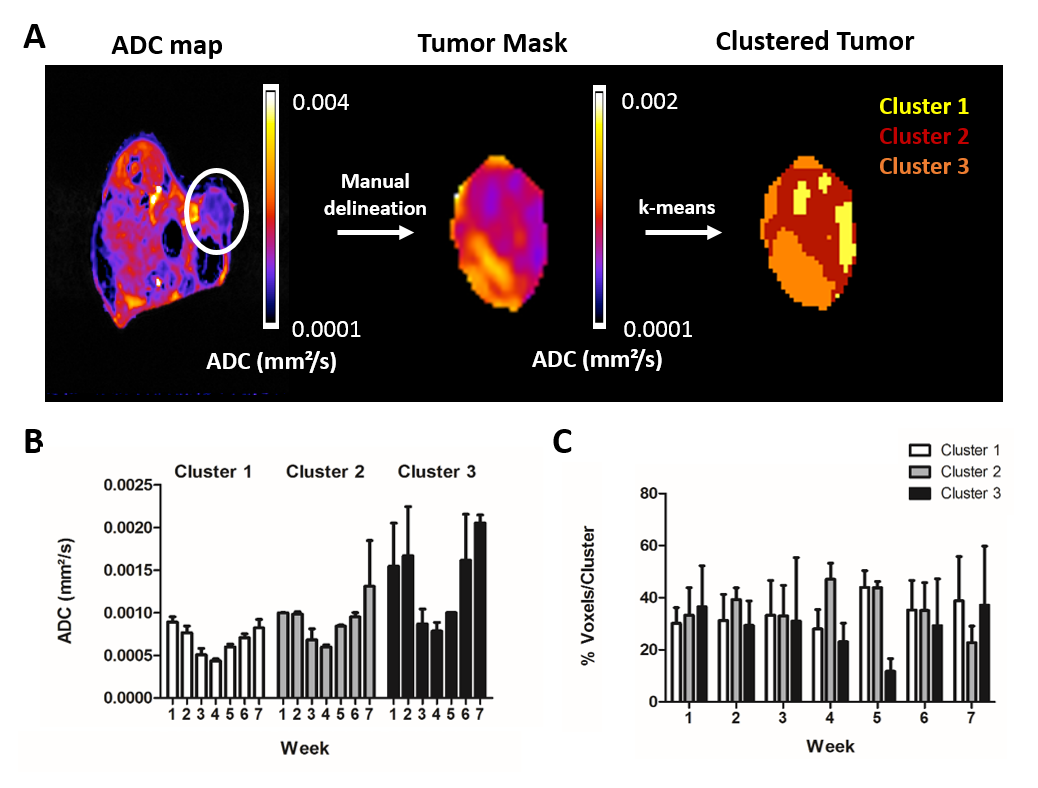
Clustering of ADC map of a masked tumor (w5, 7T). A) Workflow for clustering a tumor: after creating parametric maps, the tumor (white circle) was manually delineated and a tumor mask was created. Afterwards, the k-means clustering algorithm was applied to define 3 different clusters within one tumor. B-C) The average value per cluster and the average number of voxels with high ADC values increased over time. No significant differences were found between the different groups (two-way ANOVA with Bonferroni correction). Similar results were obtained for clustering T2 maps and for the parametric maps acquired on the 9.4T MRI.