3923
Early Prediction of Soft Tissue Sarcoma Response to Preoperative Therapy Using DCE-MRI Texture Features1Saratoga High School, Saratoga, CA, United States, 2OHSU, Portland, OR, United States
Synopsis
23 patients with soft tissue sarcoma (STS) (25 tumors) underwent DCE-MRI before and after one cycle of preoperative chemoradiotherapy. Extended Tofts model (ETM) and Shutter-Speed model (SSM) were used for pharmacokinetic (PK) analysis of DCE-MRI data and generating voxel based PK parametric maps, from which texture features were extracted using different statistical matrix methods. Changes in SZM and RLM features consistently provided good early prediction of therapy response, while more features from the SSM PK maps were good predictors of response than the ETM maps.
Introduction
Because soft tissue sarcoma (STS) is often heterogeneous in composition, radiographic tumor size shrinkage from preoperative therapy is uncommon and does not necessarily correlate with clinical outcome (1). Quantitative imaging methods, such as dynamic contrast-enhanced (DCE) MRI, that can measure tumor biological functions have the potential to provide early prediction of STS response to preoperative therapy, an important prerequisite for sparing non-responding patients from ineffective therapies and associated toxicity, initiating alternative treatment regimen, and achieving the goal of personalized medicine. Texture features extracted from DCE-MRI have demonstrated promises for cancer detection, characterization, and therapeutic monitoring (2). We have previously shown that texture analysis of voxel-based parametric maps of DCE-MRI pharmacokinetic (PK) parameters can predict with high accuracy breast cancer response to neoadjuvant chemotherapy after only one of 6-8 cycles of chemotherapy (3). In this preliminary study, we investigated if texture analysis of changes in tumor perfusion/permeability as measured by DCE-MRI can provide early prediction of STS response to preoperative chemoradiotherapy.Methods
23 patients with intermediate- to high-grade STS in the thigh underwent three cycles of preoperative chemoradiotherapy with an interval of 3 weeks as per standard of care and consented to research DCE-MRI studies (4) using a 3T Siemens system pre-therapy (visit 1, V1), after one therapy cycle (V2), and after the completion of therapy but before surgery (V3). Voxel DCE-MRI time-course data within the tumor ROI (manually defined by an experienced radiologist) were subjected to PK analysis using an extended Tofts model (ETM) (5) and Shutter-Speed model (SSM) (6), with the latter taking into account inter-compartmental water exchange kinetics. Parametric maps of Ktrans (contrast agent transfer rate constant), ve (extravascular extracellular volume fraction), and vb (blood volume fraction) were generated for each PK model, from which texture features were extracted (3). These features include moments and statistical matrix representations of the texture using the co-occurrence, run length (RLM), size zone (SZM), and distance zone matrices (DZM) (7), as well as their respective new fuzzy versions (8). Percent changes in features between V1 and V2 were examined for early prediction of therapy response.
Pathologically measured necrosis percentage (NP) in the surgical specimens was used as the clinical response endpoint with NP ≥ 95% classified as optimal response and NP < 95% sub-optimal response (4). The ability of each pair of feature/PK map for early prediction of NP was evaluated using a ridge regression after outlier detection, and validated with leave-one-out cross validation (3). Pearson, Spearman, Goodman-Kruskall, and Kendall correlation coefficients (CCs) were used to assess the predictive performance for NP. The ability of each pair of feature/PK map for early discrimination of optimal vs. sub-optimal response was assessed using area under the curve (AUC) of receiver operating characteristic (ROC) analysis.
Results
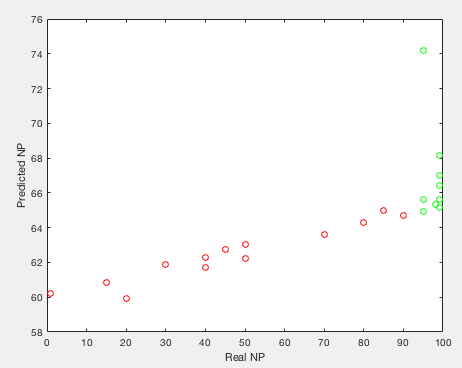
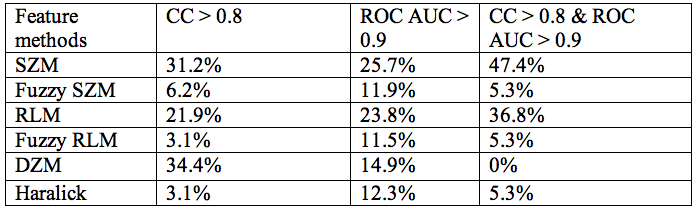
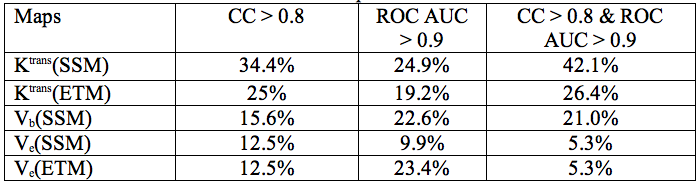
According to pathology analyses of tumor resection specimens, 7 patients (9 STS tumors) were optimal responders (NP > 95%), while the remaining 16 (16 tumors) were sub-optimal responders with NP ranging from 1% to 90%. 32 pairs of feature/PK map provided good prediction of NP values with all four CCs > 0.8, while 261 pairs delivered excellent early classification of optimal vs sub-optimal response with ROC AUC > 0.9. Among them, 19 pairs met both the correlation and ROC AUC thresholds. The percent distributions of the texture feature methods and PK maps that met one or both thresholds are shown in Tables 1 and 2, respectively. As an example, Figure 1 shows a scatter plot of predicted NP by the SRHLGE feature extracted from the Ktrans(ETM) map using fuzzy RLM, against pathologically measured NP. This pair has a ROC AUC = 0.98 and a specificity of 94% at 100% sensitivity for early prediction of optimal response.Discussion
This preliminary study demonstrates that changes in texture features extracted from voxel-based DCE-MRI PK parametric maps can provide effective early prediction of STS response to preoperative chemoradiotherapy. SZM and RLM methods systematically provide good predictors. Furthermore, two PK maps (Ktrans and vb) from the SSM analysis, compared to only one (Ktrans) from the ETM analysis, had large number of features meeting both the correlation and classification thresholds. There are also more features from Ktrans(SSM) than Ktrans(ETM) maps that provided good prediction of response (Table 2). This may be due to SSM correction of ETM underestimation of Ktrans (3,6), resulting in larger Ktrans(SSM) range and consequently more robust feature changes in response to therapy. Our encouraging preliminary findings from a small cohort need to be validated with a significantly larger patient population.Acknowledgements
NIH grant support: U01 CA154602.References
1. DeLaney TF, Spiro IJ, Suit HD, Gebhardt MC, Hornicek FJ, Mankin HJ, Rosenberg AL, Rosenthal DI, Miryousefi F, Ancukiewicz M, Harmon DC. Neoadjuvant chemotherapy and radiotherapy for large extremity soft tissue sarcomas. Int J Radiat Oncol Biol Phys 2003;56:1117–1127.
2. Gillies RJ, Kinahan, PE, Hricak H. Radiomics: images are more than pictures, they are data. Radiology 2016;278: 563–577.
3. Thibault G, Tudorica A, Afzal A, Chui SYC, Naik A, Troxell ML, Kemmer KA, Oh KY, Roy N, Jafarian N, Holtorf ML, Huang W, Song X. DCE-MRI Texture Features for Early Prediction of Breast Cancer Response. Tomography 2017;3:23-32.
4. Huang W, Beckett BR, Tudorica A, Meyer JM, Afzal A, Chen Y, Mansoor A, Hayden JB, Doung YC, Hung AY, Holtorf ML, Aston TJ, Ryan CW. Evaluation of soft tissue sarcoma response to preoperative chemoradiotherapy using dynamic contrast-enhanced magnetic resonance imaging. Tomography 2016;2:308-316.
5. Tofts PS, Brix G, Buckley DL, Evelhoch JL, Henderson E, Knopp MV, et al. Estimating kinetic parameters from dynamic contrast-enhanced T1-weighted MRI of a diffusable tracer: standardized quantities and symbols. J Magn Reson Imaging 1999;10:223-232.
6. Li X, Rooney WD, Springer CS. A unified pharmacokinetic theory for intravascular and extracellular contrast agents. Magn Reson Med 2005;54:1351-1359.
7. Thibault G, Angulo J, Meyer F. Advanced Statistical Matrices for Texture Characterization: Application to Cell Classification. IEEE Transaction on Biomedical Engineering 2014, vol. 61, n° 3, pp. 630-637.
8. Thibault G, Shafran I. Fuzzy Statistical Matrices for Cell Classification. arXiv 1611.06009.
Figures