3922
Rectal cancer: multi-parametric MRI 3-dimensional assessment of intra-tumour heterogeneity and chemoradiotherapy response prediction1Radiation Oncology, Liverpool Cancer Therapy Centre, Liverpool Hospital, Sydney, Australia, 2Sydney West Radiation Oncology Network, Westmead, Blacktown and Nepean Hospitals, Sydney, Australia, 3Faculty of Medicine, University of New South Wales, Sydney, Australia, 4Ingham Institute for Applied Medical Research, Sydney, Australia, 5School of Medicine, Western Sydney University, Sydney, Australia, 6Anatomical Pathology, Liverpool Hospital, Sydney, Australia, 7Department of Statistics, Macquarie University, Sydney, Australia, 8NHMRC Clinical Trials Centre, Sydney, Australia, 9Radiology, Liverpool Hospital, Sydney, Australia
Synopsis
This study investigated 3D quantitative histogram assessment of diffusion weighted imaging (DWI) and dynamic contrast enhanced (DCE) MRI in the prediction of chemoradiotherapy (CRT) response in locally advanced rectal cancer. Histopathologic response assessment was centralised and defined according to AJCC tumour regression grade. A whole tumour histogram analysis and combined multiparametric scatterplots of ADC and Ktrans were used to assess tumour heterogeneity and prediction of CRT response. Post-CRT ADC 75th and 90th histogram quantiles were the most promising parameters for prediction of CRT response. However, DCE-MRI and multi-parametric scatterplots combining ADC and Ktrans did not add value in predicting response.
Introduction
Imaging prediction of chemoradiotherapy (CRT) response in locally advanced rectal cancer would enable stratification of management. Tumours are heterogeneous in their response to treatment and summary measures such as mean ADC or Ktrans do not reflect tumour heterogeneity. 3-dimensional (3D) MRI with a quantitative histogram analysis may better depict subtle differences in tumour heterogeneity between responders and non-responders. The purpose of this study was to prospectively evaluate multi-parametric MRI, combining diffusion weighted imaging (DWI) and dynamic contrast enhanced (DCE), and a 3D quantitative histogram analysis for assessment of tumour heterogeneity and response to CRT in rectal cancer.Methods
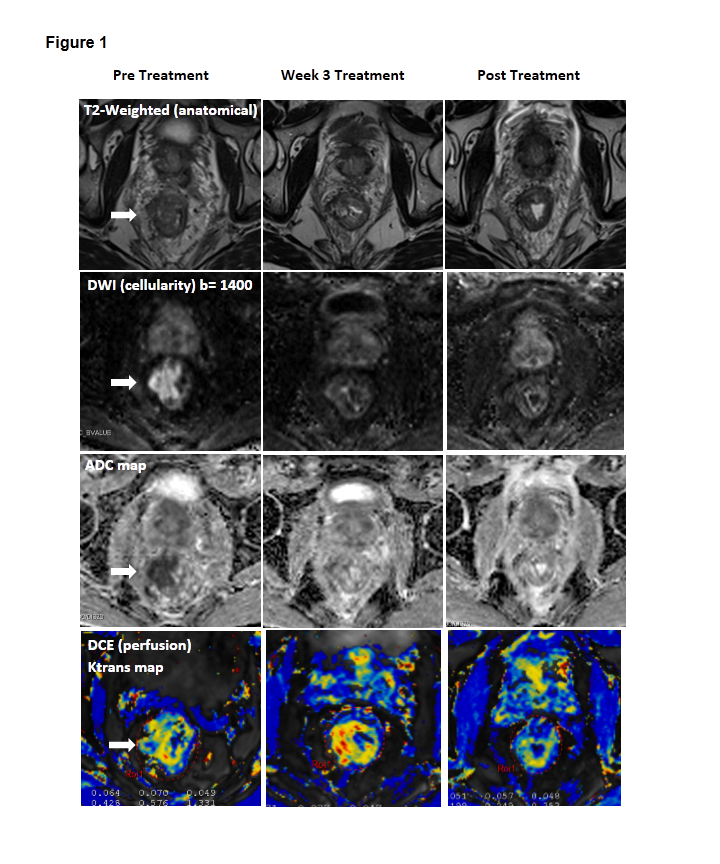
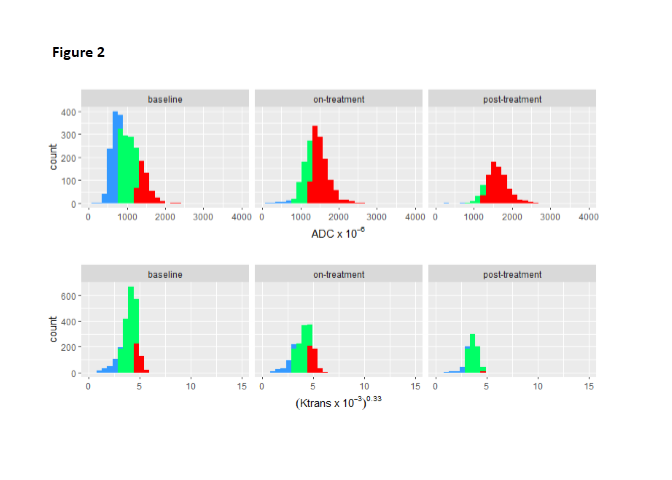
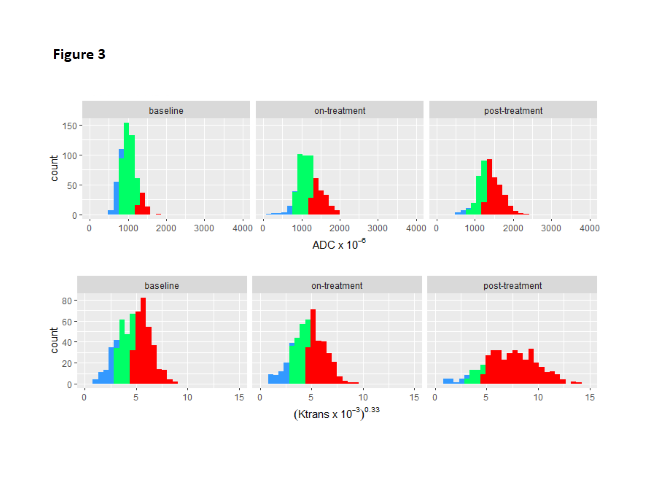
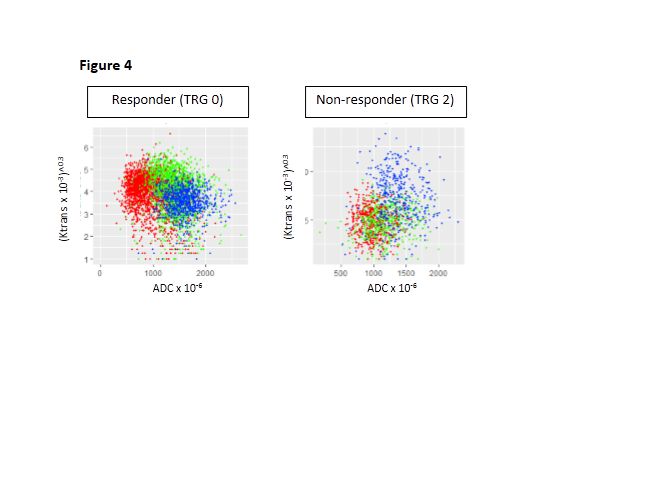
Thirty-nine patients with locally advanced (Stage II – III) rectal cancer undergoing preoperative CRT followed by surgery were enrolled on this study. MRI was performed at 3 time-points: pre-CRT, week 3 CRT, and post CRT (pre-surgery). The protocol consisted of (i) T2W images, (ii) DWI using a read-out segmented sequence (RESOLVE) with b-values 50 s/mm2, 800 s/mm2 and calculated 1400 s/mm2, 1&3 averages, and ADC maps produced as part of protocol (iii) DCE with pre-contrast VIBE T1-weighted scans for T1 calculation followed by injection of 0.1mM/kg gadolinium (Gadoversetamide) and 60 phases TWIST with a 5s temporal resolution. Butylscopolamine 20mg IV was administered prior to functional MRI sequences. CRT response was defined according to modified Ryan et al set out in the AJCC Cancer Staging Manual 7th Edition tumour regression grade (TRG). The entire original tumour site was embedded for microscopic assessment. Two dedicated gastrointestinal pathologists examined each case and reached consensus on TRG. TRG 0–1 were classified as responders and TRG 2–3 as non-responders. Semi-automated segmentation was used to define the entire hyperintense tumour on b-value 1400s/mm2 images. A voxel-by-voxel analysis of whole tumour was used to produce histograms of ADC and Ktrans, and combined scatterplots for each time-point. The ADC and Ktrans percentiles, skewness and kurtosis by response status were assessed using two-sample t-tests.Results
Of 39 patients, 6 had Stage II and 33 had Stage III disease at diagnosis. Three patients had pathologic complete response TRG 0 (7.7%), 12 had TRG 1 (30.8%), 14 had TRG 2 (35.9%), and 3 had TRG 3 (7.7%). One patient who refused surgery had a clinical complete response (2.6%) on colonoscopy and biopsy at 18 months, and was classified as a responder. Five patients with mucinous pathology (12.8%) and 1 patient (2.6%) who did not have response status were excluded from analysis. The histograms showed skewness of ADC was an approximately symmetric distribution that became more symmetric over time. Ktrans had a highly skewed distribution at each time-point that decreased from baseline to on-treatment, then remained stable. Of the histogram quantiles tested, post-CRT ADC 75th (responders vs. non-responders 1620x10-6 vs. 1547x10-6, p=0.036) and 90th percentiles (responders vs. non-responders 1859x10-6 vs 1753x10-6, p=0.019) were significant for predicting response. All Ktrans quantiles were higher in non-responders than responders at all time-points however, this was not significant (p>0.10). There was no bivariate pattern in change over time on combined scatterplots of ADC and Ktrans by response status.Discussion
Accurate prediction of response would allow for appropriate selection of patients for a more conservative surgical technique, or a wait-and-watch approach, thereby minimising or avoiding surgical morbidity.1,2 This protocol allowed for 3D characterization of diffusion (DWI) and perfusion (DCE) changes in tumour in response to CRT. Histopathology analysis in this study was rigorous, with entire tumour bed embedded for analysis and consensus readings by 2 gastrointestinal pathologists. In this study post-CRT ADC 75th and 90th percentiles were the best histogram parameters for the prediction of CRT response. DCE-MRI Ktrans did not assist in the prediction of CRT response, despite standardization of the DCE protocol in this study. Rectal peristalsis was minimized by butylscopolamine, and rigid pre-registration of flip angle to dynamic images, which had to be performed outside of commercial software, was done to correct for patient motion and ensure accurate voxel-wise analysis over 60 phases. An increase in Ktrans during CRT was seen on DCE-MRI, indicating increased perfusion in response to CRT. Post-CRT Ktrans was higher in non-responders than responders, suggesting greater residual perfusion following CRT in non-responders, however this was not significantly different by response status.Conclusion
Post-CRT DWI ADC 75th and 90th quantiles were promising parameters for prediction of CRT response in patients with locally advanced rectal cancer. DCE-MRI and multiparametric scatterplots combining ADC and Ktrans did not add value in predicting response.Acknowledgements
No acknowledgement found.References
1Pham et al. BJR 2017;90(1072).
2Maas et al. J Clin Oncol 2011;29(35):4633
Figures