3919
Noninvasive prediction of tumor-fibrosis using texture analysis of multiparametric MRI in pancreatic cancer model1Radiology, Yonsei University, Seoul, Republic of Korea, 2Radiology, University of Washington, Seattle, WA, United States, 3Software Convergence, Seoul Women’s University, Seoul, Republic of Korea
Synopsis
Authors want to evaluate the correlations between texture features of tumor on multi-parametric MRI (mp-MRI) and tumor-fibrosis in animal model of pancreatic cancer. mp-MRI was performed in a genetically engineered mice model of human pancreatic cancer. Texture features of tumors were extracted from each parametric map using texture analysis. Linear regression with LASSO method was used to evaluate the correlations between the texture features and percentage of fibrosis on histologic slides. Several texture features were correlated with tumor fibrosis. Statistical learning showed preliminary prediction model. Texture analysis of mp-MRI is helpful for predicting and monitoring tumor-fibrosis in pancreatic cancer model.
INTRODUCTION
Noninvasive prediction of microscopic characteristics of tumors has been an unmet need in management of cancer patients. Recently, multiparametric magnetic resonance imaging (mp-MRI) can provide quantitative information regarding underlying pathophysiological processes such as hemorrhage, necrosis, inflammation and collagen deposition. However, it is still difficult to predict microscopic process using only MR parameters due to low specificity [1-4]. In order to find the more specific imaging parameters, we applied texture analysis on mp-MRI. We hypothesized that various texture features extracted from MR texture analysis could play a role as additional MR parameters in predicting pathologic characters of tumor. The purpose of the present study is to evaluate the correlations between texture features of tumor on multi-parametric MRI (mp-MRI) and tumor-fibrosis in animal model of pancreatic cancer.
METHODS
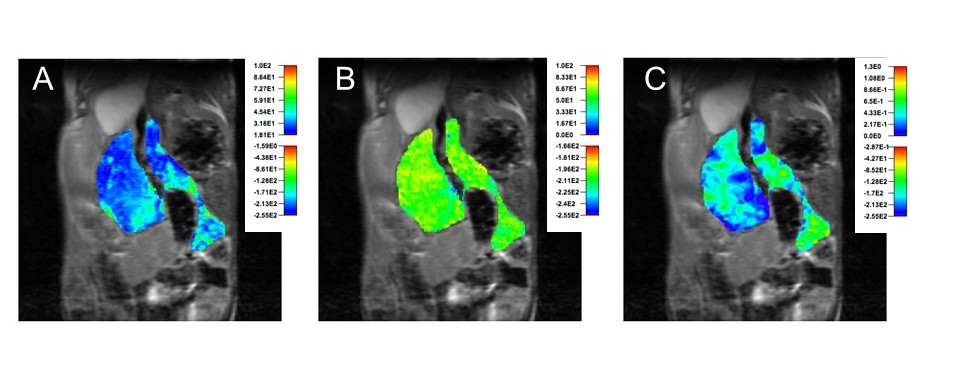
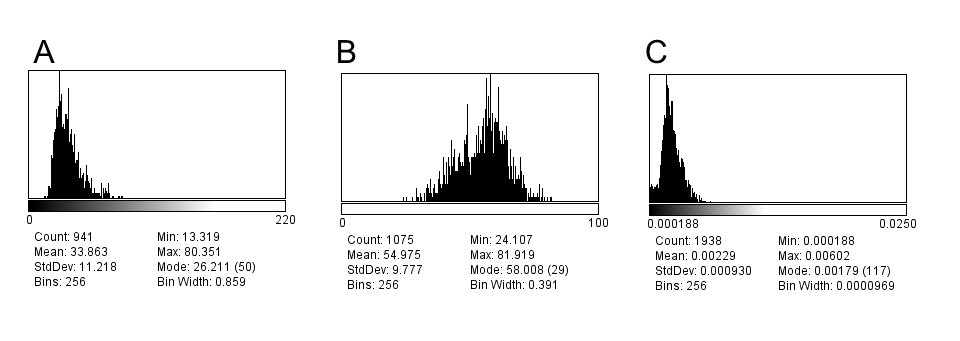
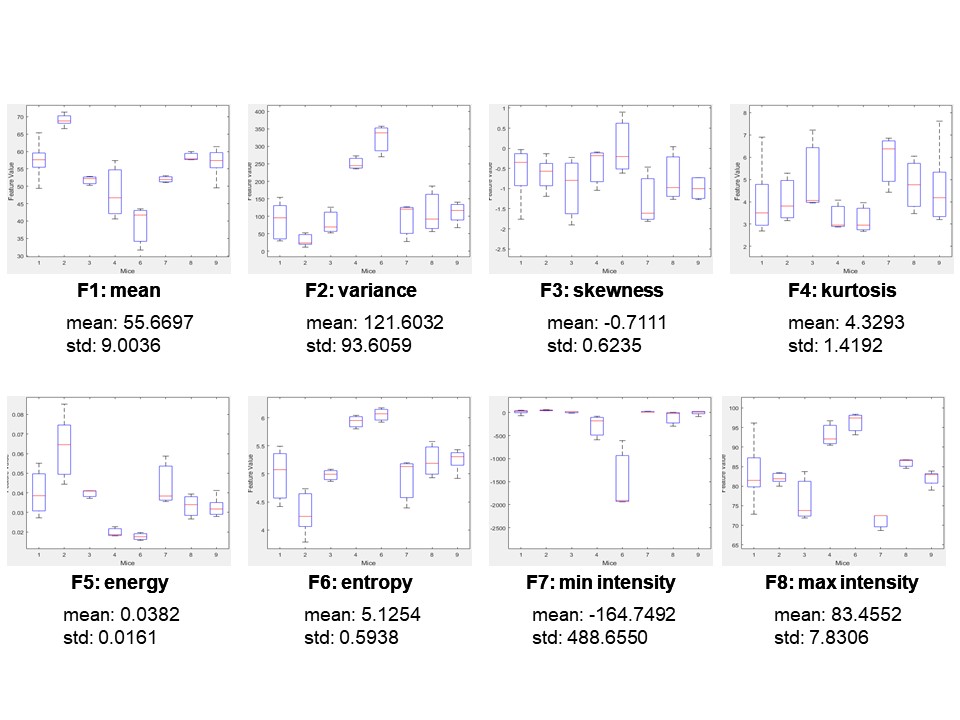
The study was conducted with the approval from the University of Washington institutional animal care and use committee. mp-MRI including T1- & T2-weighted imaging, magnetic transfer ratio (MTR), Diffusion weighted images (DWI), Chemical Exchange Transfer Saturation (CEST) imaging was performed in a genetically engineered mice tumor model (n=8) that recapitulate human pancreatic ductal adenocarcinoma. mp-MRI were performed on a 14T Bruker Avance 600 MHz/89 mm wide-bore vertical MR spectrometer. All mice were euthanized and the tumor and associated pancreatic tissue was excised and prepared for histological evaluation. Images of whole sections stained with Masson’s trichrome were acquired for collagen quantification. Collagen, identified by blue staining, was separated by thresholding of the hue, saturation, and brightness values using ImageJ (ImageJ 1.42 National Institutes of Health, Bethesda, MD). The collagen content is presented as the percent area of collagen over the whole tumor area. Anatomical Images were used to measure tumor volume in the mice. T1 and T2 maps were generated using T1 and T2 weighted images. MTR maps and ADC (apparent diffusion coefficient) maps were generated. In addition to mono-exponential model, a bi-exponential model was used to estimate intravoxel incoherent motion (IVIM) related parameters of perfusion fraction and diffusion. Three lowest 3 b values of 0, 30 and 60 s/mm2 were used to calculate perfusion component (PD). Finally, APT-MR images were quantified using the following equation: MTRasym (3.5 ppm) = [MTR (3.5 ppm) - MTR (-3.5 ppm)] = [Ssat (-3.5 ppm) – Ssat (3.5 ppm)]/S0 where Ssat and S0 are the water signal intensities measured with and without saturation pulse (CEST). Images were analyzed using ImageJ software (Fig.1). Eight texture features of tumors (F1: mean, F2: variance, F3: skewness, F4: kurtosis, F5: energy, F6: entropy, F7: minimum value, F8: maximum value) were extracted from each parametric maps of mp-MRI using texture analysis (Fig. 2 & 3). Uni- and multi-variable linear regression was used to evaluate the correlations between the texture features and percentage of fibrosis (%fibrosis) on histologic slides. Statistical learning method using penalized linear regression with a least absolute shrinkage and selection operator (LASSO) analysis was also applied to develop the prediction model.
RESULTS
Among total 48 texture features we obtained (8 features x 6 parametric maps), 17 were correlated with %fibrosis (p<.2, univariable analysis). Using multivariable linear regression, Predicted %fibrosis = 1.7873 - 0.0037 X [T1 F2] - 0.4624 X [T2 F1] - 1.7001 X [T2 F3] + 0.3206 X [T2 F4] + 69.1731 X [T2 F5] - 0.2003 X [T2 F7] + 3549.953 X [ADC F1] + 5156.17 X [ADC F7] + 1.1297 X [PD F3] + 0.1138 X [PD F4] + 0.0814 X [PD F8] - 0.0666 X [CEST F2] - 3.1557 X [CEST F4] - 109.963 X [CEST F5] + 2.566 X [CEST F6] - 0.8137 X [CEST F7] + 0.3351 X [CEST F8]. Using penalized logistic regression with LASSO analysis, 3 features were selected to develop the prediction model, Predicted %fibrosis = -0.4460102 + [T2 F1] X -0.1689571 + [T2 F7] X -0.0439015 + [CEST F6] X 5.60113
DISCUSSION
Pancreatic ductal adenocarcinoma (PDA) is one of the most lethal cancer with low survival rate [5]. A typical pathologic finding of PDA is desmoplasia, characterized by dense fibrotic connective tissue that penetrates and envelopes the neoplasm [6]. Previous studies show that MRI technique can be used to study the heterogeneous nature of tumor fibrosis [7,8]. In present study, we have demonstrated that mp-MRI texture features are sensitive to %fibrosis. Our results shows that texture analysis of quantitative mp-MRI has a potential role in the predicting microscopic characteristics of pancreatic tumor. Future studies will focus not only on understanding the other underlying patho-physiological processes in tumor development but also on monitoring of dynamic change of them.
CONCLUSION
In conclusion, texture analysis of mp-MRI is helpful for predicting and monitoring tumor-fibrosis in pancreatic cancer model.Acknowledgements
This work was supported by the National Research Foundation of Korea grant funded by the Korean Government (MEST) (NRF-2016R1D1A1B03935144).References
[1] Li W, Zhang Z, Nicolai J, Yang GY, Omary RA, Larson AC. Magnetization transfer MRI in pancreatic cancer xenograft models. Magnetic resonance in medicine 2012;68(4):1291-7
[2] Sagiyama K, Mashimo T, Togao O, Vemireddy V, Hatanpaa KJ, Maher EA, et al. In vivo chemical exchange saturation transfer imaging allows early detection of a therapeutic response in glioblastoma. Proc Natl Acad Sci U S A 2014;111(12):4542-7
[3]. Jones CK, Schlosser MJ, van Zijl PCM, Pomper MG, Golay X, Zhou JY. Amide proton transfer imaging of human brain tumors at 3T. Magnetic Resonance in Medicine 2006;56(3):585-92
[4]. Yin T, Peeters R, Feng Y, Liu Y, Yu J, Dymarkowski S, et al. Characterization of a rat orthotopic pancreatic head tumor model using three-dimensional and quantitative multi-parametric MRI. NMR in biomedicine 2017;30(2)
[5] Siegel R, Ma J, Zou Z, Jemal A. 2014. Cancer statistics, 2014. CA Cancer J. Clin. 64:9–29.
[6] Yang S, Wang X, Contino G, Liesa M, Sahin E, Ying H, et al. Pancreatic cancers require autophagy for tumor growth. Genes Dev 2011;25(7):717-729
[7] Olive KP, Jacobetz MA, Davidson CJ, Gopinathan A, McIntyre D, Honess D, et al. Inhibition of Hedgehog signaling enhances delivery of chemotherapy in a mouse model of pancreatic cancer. Science 2009; 324:1457–1461.
[8] Farr N, Wang Y, D’Andrea S, Gravelle KM, Hwang JH, Lee D. Noninvasive characterization of pancreatic tumor mouse models using magnetic resonance imaging. Cancer Medicine 2017; 6(5):1082–1090
Figures