3917
Correlation of CD31-Based Microvessel Density and Percent Area Measurements against 13C-tert-butanol MRI Perfusion Mapping in a Sunitinib-Resistant RCC Xenograft1Department of Radiology, Beth Israel Deaconess Medical Center, Boston, MA, United States, 2Department of Medicine, Beth Israel Deaconess Medical Center, Boston, MA, United States
Synopsis
Tumor heterogeneity is deeply associated with regional perfusion. Improved evaluation of local perfusion, by imaging or histology, can be useful for tracking tumor progression and treatment. Here we use h13C-tert-butanol, a high-SNR quantitative MRI perfusion marker, to map perfusion in untreated (UT) and sunitinib-resistant (SR) renal cell carcinoma (RCC) xenografts. This study investigates the correlation between these perfusion maps with histologic measures of vascularity using CD31-labeled sections.
Introduction
Most advanced cancers treated with selected targeted therapies, however initially efficacious, inevitably become resistant. Tumor perfusion can be heterogeneous, with local areas of hypoxia that can potentially drive focal proliferation and resistance; however, conventional diagnostic imaging methods do not capture this effect. Microvessel density (MVD) and microvessel area (MVA) are histologic markers of vascularity that have been used to grade tumors, however it is unclear how well this reflects underlying perfusion.
Hyperpolarized 13C-tert-butanol (h13C-TB) is a freely-diffusible novel MRI tracer1 that provides high-SNR tissue perfusion mapping. Here we use h13C-TB MRI to quantify perfusion within untreated (UT) and sunitinib resistant (SR) RCC mouse xenografts. Our goal is to determine if regional perfusion correlates with MVD and MVA measured on CD31-labeled histologic specimens obtained from the same tumors.
Methods
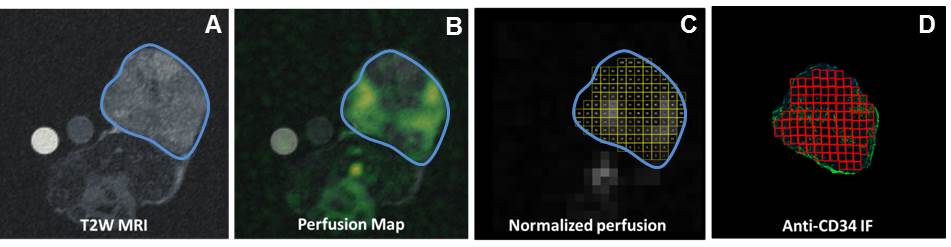
8 nude mice were implanted with A498 RCC tumors. 4 were treated with sunitinib (SR) and 4 were untreated (UT). Imaging was performed when tumors reached 15mm. ST mice received daily sunitinib and were imaged again at resistance when 2mm of growth was detected. UT mice were imaged again at 20 mm. Tumors were harvested after final imaging, CD31 immunofluorescence labeling was performed on sections matched to the imaging plane, and the slides were digitally scanned using an Axio Scan.Z1 (Carl Zeiss). MRI was performed on a Biospec 4.7T (Bruker) using: (1) 1H-T2-weighed RARE sequence, 2mm slice, 270µm2 (Fig 1A), (2) h13C-TB with 2D bSSFP, 500µm2, 3 mm slice, 512ms/frame x 100 frames (Fig 1B). Semi-automatic calculation of MVD and MVA was performed by matching ROIs (1mm2) on CD31 stains to those selected on MRI in the same tumor using the Fiji imaging analysis software from NIH (Fig 1C). Correlation between MVD and MVA and tumor perfusion (as measured by h13C-TB) was calculated using all ROIs that were drawn across the entire section of each tumor (Fig 1D), versus the hot spot method, which focused on the 10 most perfused areas for each tumor.Results
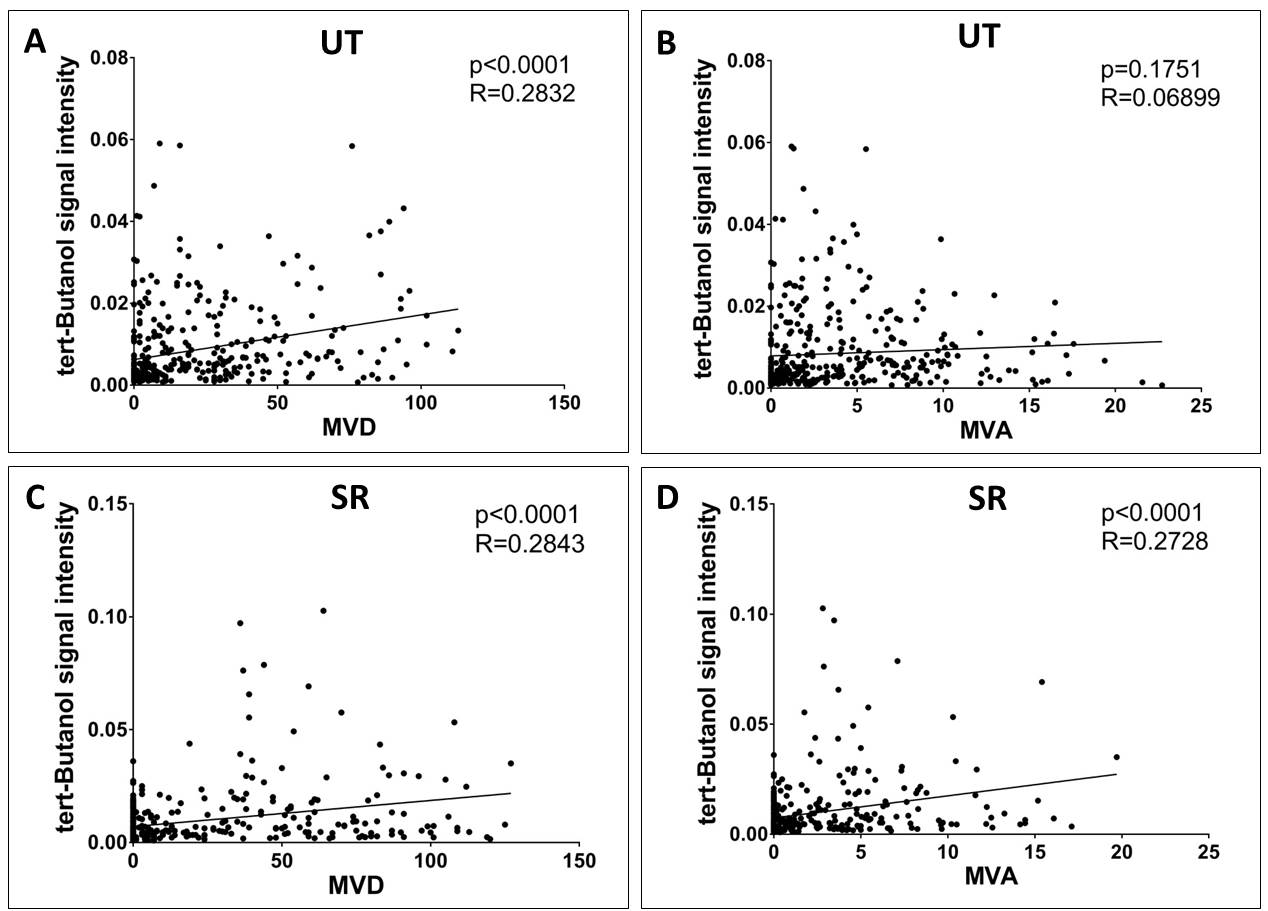
When using all ROIs across all tumors (776 data points total), MVD was positively correlated to perfusion in UT animals (p<0.0001, r=0.28, Fig 2A). However, there was no correlation between MVA and perfusion in the UT group (p=0.18, r=0.069, Fig 2B). MVD (p<0.0001, r= 0.2902, Fig 2C) and MVA (p=0.0070, r=0.1381, Fig 2D) were positively correlated to perfusion in the SR group.
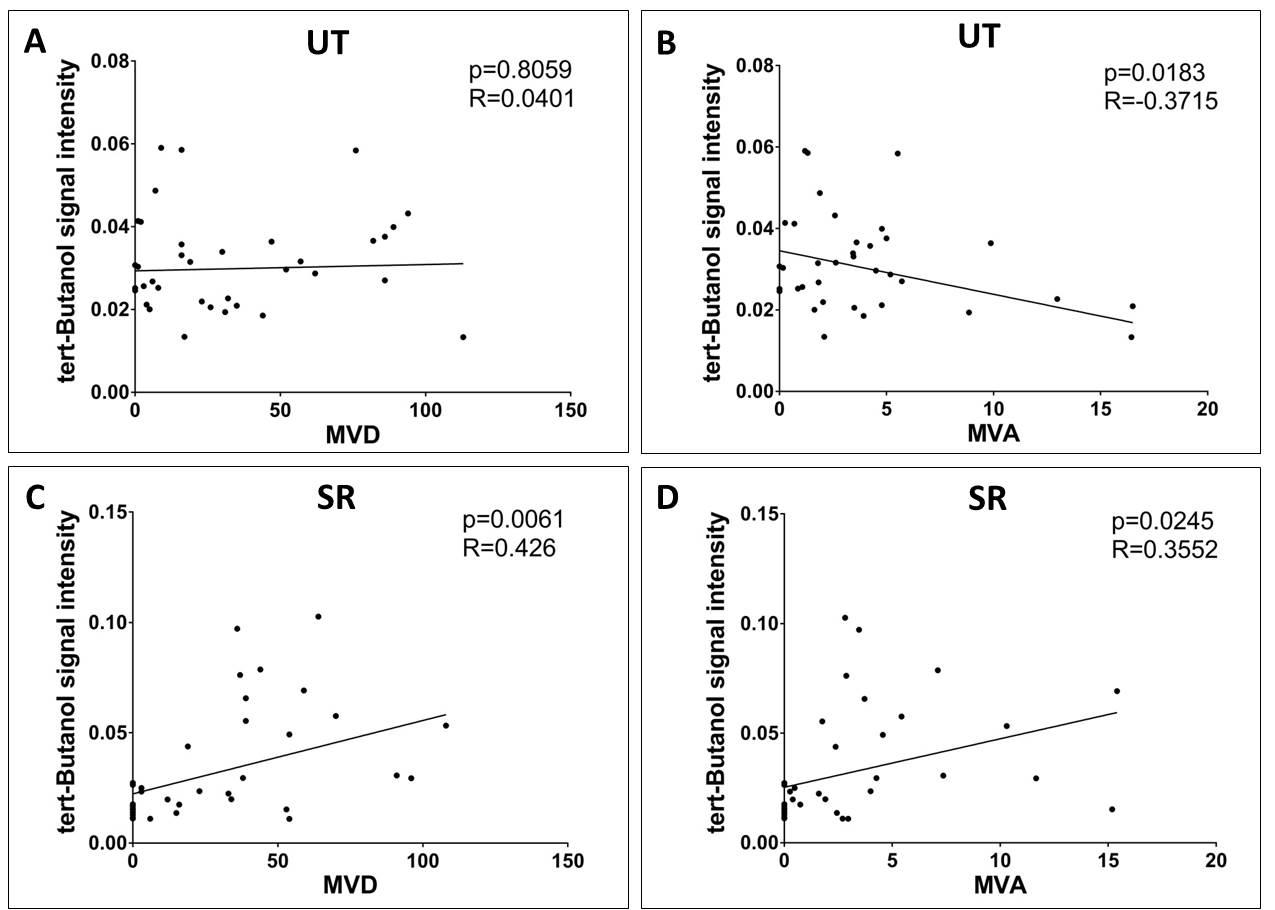
When using hot-spot analysis (80 data points total), there was no correlation between MVD and perfusion in the UT group (p=0.0061, r=0.426, Fig 3A). There was negative correlation between MVA and perfusion in the UT group (p=0.0183, r= -0.3715, Fig 3B). There was positive correlation for MVD (p<0.0001, r=0.2843, Fig 3C) and MVA (p<0.0001, r=0.2728, Fig 3D) against perfusion in the SR group.
Discussion
Although MVD has been attributed to the vascular status of tissue, it does not necessarily indicate angiogenic potential nor the functional performance of the existing neovasculature2. We compared histology to h13C-TB-based perfusion to better understand how well MVD and MVA correlate with vivo perfusion measurements.
Yuan et al recently reported that CD31 may be a better marker to access tumor perfusion in patients with RCCs, when compared to CD343. We previously performed rad-path comparisons using CD34 labeled tumors. Our data also show that CD31 shows relatively improved correlation with h13C-TB-measured perfusion in comparison to CD34-labeled specimens4.
The lack of correlation between perfusion and MVA (Fig 2B) and MVD (Fig 3A) in the UT group is attributed to the increased heterogeneity of the diameter and the tortuosity of tumor vessels and greater variations in vessel permeability, resulting in increased variance in blood flow relative to vessel density5. This is in contrast to the SR group, which demonstrates more morphologic uniformity of the vessels, attributed to vascular normalization, despite greater regional heterogeneity in both perfusion and vessel density.
Our study has several limitations. First, we can minimize but not eliminate mismatches when spatially aligning imaging and histologic ROIs for comparison. We are currently studying the use of computational spatial alignment and distortion correction to improve these comparisons. There is also a difference between MRI (4 mm) and histologic (4 µm) slice thicknesses. Finally, only 8 tumors were studied, potentially limiting the degree of correlation and statistical significance of radiologic-histopathologic comparison, particularly in the UT group.
Conclusion
There is correlation between h13C-TB-measured perfusion and MVD and MVA area using CD31-labeled untreated and sunitinib-resistant A498 tumors. This correlation is better in resistant tumors, likely due to vascular normalization. However, correlation can be influenced by sampling methods.Acknowledgements
No acknowledgement found.References
1. Grant AK, Vinogradov E, Wang X, et al. Perfusion Imaging with a Freely Diffusible Hyperpolarized Contrast Agent. Magnetic Resonance in Medicine 2011;66:746-755.
2. Eberhard A, Kahlert S, Goede V, Hemmerlein B, Plate KH, Augustin HG. Heterogeneity of angiogenesis and blood vessel maturation in human tumors: implications for antiangiogenic tumor therapies. Cancer Res. 2000 Mar 1;60(5):1388-93.
3. Yuan Q, Kapur P, Zhang Y, Xi Y, Carvo I, Signoretti S, Dimitrov IE, Cadeddu JA, Margulis V, Brugarolas J, Madhuranthakam AJ, Pedrosa I. Intratumor Heterogeneity of Perfusion and Diffusion in Clear-Cell Renal Cell Carcinoma: Correlation With Tumor Cellularity. Clin Genitourin Cancer. 2016 Dec;14(6):e585-e594.
4. Souza PC, Grant A, Wang X, Bhatt R, Varma G, Alsop D, Tsai L. Hyperpolarized 13C-Tert-Butanol MRI Perfusion Mapping and Microvessel Density in Sunitnib-Treated Renal Cell Carcinoma Xenografts: Rad-Path Correlation in the Characterization of Intratumoral Heterogeneity and Pre- and Post-Treatment Change. Radiological Society of North America (RSNA) Annual Meeting, Chicago, IL, USA. November 27 - December 2, 2016.
5. Dennie J, Mandeville JB, Boxerman JL, Packard SD, Rosen BR, Weisskoff RM. NMR imaging of changes in vascular morphology due to tumor angiogenesis. Magn Reson Med. 1998;40:793–9
Figures