3916
Oxygen-Enhanced MRI for the Detection of Hypoxia in Patients with Head and Neck Cancer1Nottingham University Hospitals, Nottingham, United Kingdom, 2University of Nottingham, Nottingham, United Kingdom, 3The Royal Marsden NHS Foundation, London, United Kingdom, 4The Institute of Cancer Research, London, United Kingdom, 5The University of Manchester, Manchester, United Kingdom, 6Christie NHS Foundation Trust, Manchester, United Kingdom
Synopsis
Tumour hypoxia is a recognized cause of treatment failure. Noninvasive methods to quantify distribution and extent of hypoxia remain an unmet clinical need. Quantitation of the longitudinal relaxation rate, R1, using oxygen-enhanced MRI (OE-MRI), can be used to monitor differences in levels of paramagnetic molecular oxygen in plasma. In this study, we report a significantly reduced hyperoxia-induced ΔR1 response in HNSCC in comparison to the healthy lymph nodes, revealed by OE-MRI. Such a reduction can be attributed to regions of impaired tumour vasculature and hypoxia, the presence of which may be linked to a poorer outcome.
Purpose
To evaluate the utility of oxygen-enhanced MRI to detect and monitor oxygen changes in healthy head and neck lymph nodes and squamous cell carcinoma tumours.Introduction
Tumour hypoxia is a well-established cause of treatment resistance, and adversely affects the prognosis of head and neck squamous cell carcinoma (HNSCC) [1]. Oxygen enhanced MRI (OE-MRI) is a technique being actively exploited for imaging tumour hypoxia, in which paramagnetic molecular oxygen dissolved in blood plasma, interstitial tissue fluid or intracellular water can induce changes in the longitudinal relaxation rate (R1). The extent and distribution of fraction of perfused tumour tissue refractory to oxygen challenge (“perfused Oxy-R”) has been shown to correlate well with tumour hypoxic subregions [2].Methods
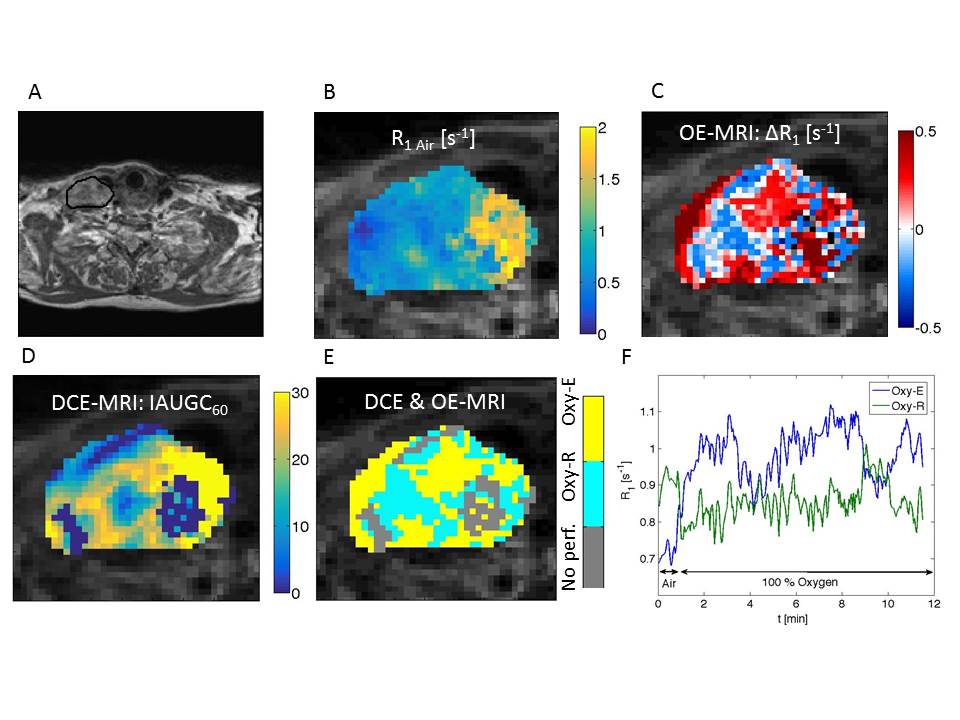
Ten healthy volunteers (mean age: 31 years) and three patients with histologically proven advanced HNSCC (mean age: 58 years) were scanned on a 3T Philips Achieva using an eight-channel phased-array head coil. Patient scans were repeated within 72 hours. Anatomical coronal and axial T2-weighted images were first acquired to identify cervical lymph nodes and tumour sites. A 3D spoiled gradient echo (TE/TR: 4.5/2.3ms, matrix 160, FOV:240x240mm, 24x2.5mm slices) with two flip angles (FA=3/16deg) was then used to calculate R1 values. A series of 20 baseline measurements was acquired first using a non-rebreather face mask (medical air, 12l/min), followed by 210 measurements with 100% oxygen inhalation over 10.5min. In addition DCE MRI was performed at the end of the patient examinations (using the same 3D spoiled GE sequence), using an automatic injector (0.2ml/kg body mass, 2ml s-1 injection rate, Dotarem, Guerbet, France followed by a saline flush 20 ml). Pulse oximetry and blood oxygen saturation were monitored for all subjects.
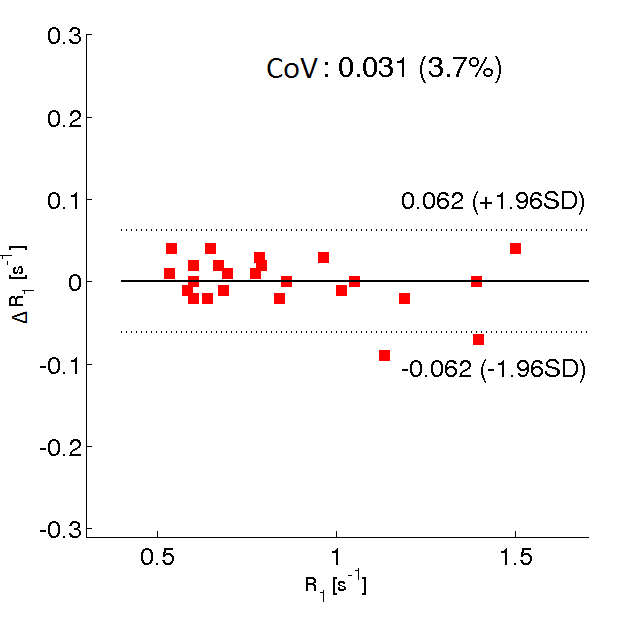
Healthy lymph nodes and tumour volumes within the MRI FOV were delineated on anatomical MR images by a head and neck oncologist. OE-MRI analysis was performed using in-house software written in Matlab (MathWorks). Three sub-sets of 10 motion-averaged images were used to calculate two air-breathing R1 parametric maps (R1Air) and one at the end of oxygen breathing period (R1O2). Bland-Altman analysis [3] was performed and the R1 coefficient of variation CoV calculated for the repeated air-breathing measurements. For OE-MRI, the voxelwise R1 differences (ΔR1=R1O2 – R1Air) were calculated. Oxygen enhancing voxels (Oxy-E) were defined for ΔR1>2*CoV*tumour baseline R1. Oxygen enhancing and refractory voxel fractions were calculated for all ROIs. DCE MRI data were analysed using the MRIW (Institute of Cancer Research, London, UK) [4]. DCE MRI and OE enhancing voxels were binarised and used to classify voxels as perfused Oxy-E, perfused Oxy-R and non-perfused.
The normality of measured R1 and ΔR1 values was measured using the Shapiro-Wilk test. R1, ΔR1 and perfused Oxy-R fractions were compared for healthy and tumour ROIs using Wilcoxon rank test. P values of <0.05 were considered significant.
Results
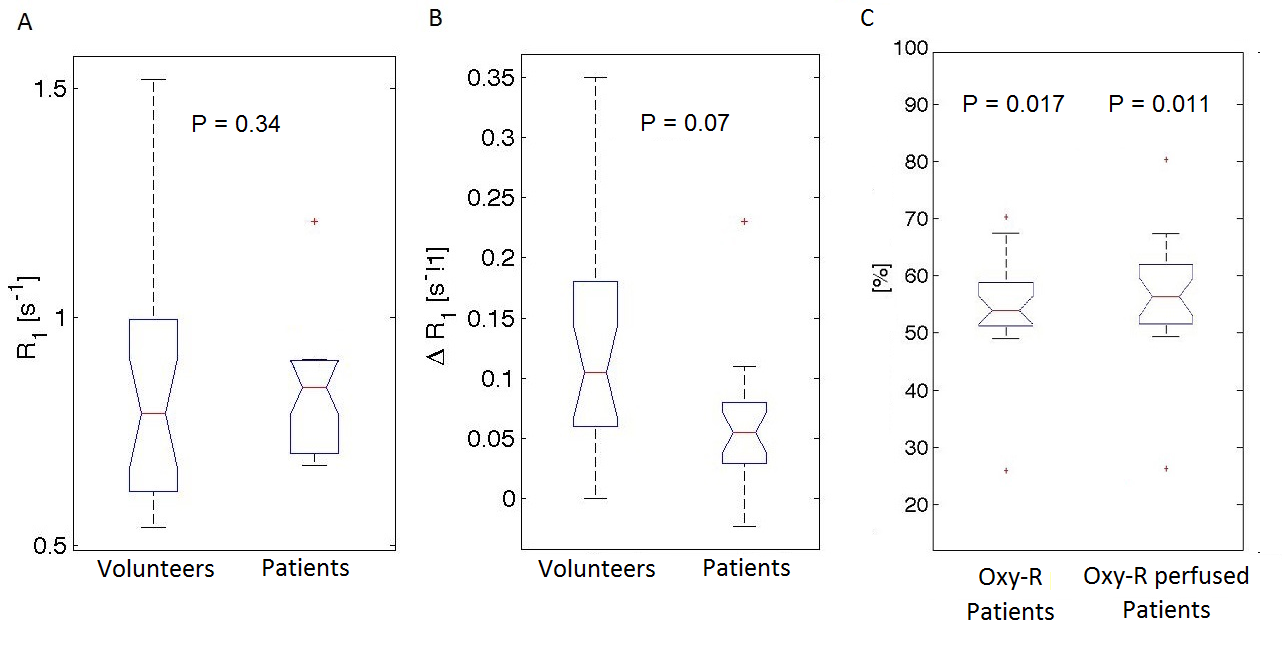
Figure 1 shows differences between median lymph node R1 values in two subsequent air-breathing periods, plotted against the mean value of R1. The lymph node R1 CoV was 3.7%. Representative parametric maps (R1, ΔR1, IAUGC60, Oxy-R and perfused Oxy-R) for a patient with HNSCC are shown in Figure 2. Box plots presenting differences between volunteer and patient ROI values of air-breathing R1, oxygen induced ΔR1, Oxy-R and perfused Oxy-R obtained from perfused tumour regions are shown in Figure 3. There was no difference between healthy and tumour air-breathing R1 (P=0.34). Healthy lymph nodes exhibited a higher hyperoxia-induced increase in R1 compared with tumour however this difference was not statistically significant (P=0.07). Whole tumour Oxy-R and perfused Oxy-R were significantly higher than healthy lymph nodes (P = 0.017 and 0.011 respectively).Discussion and Conclusion
In this study we describe the successful implementation of oxygen-enhanced MRI for the non-invasive assessment of hypoxia in HNSCC at 3T. Our data show that R1 measurements during the air-breathing baseline were stable and repeatable (CoV=3.7%). The oxygen refractory tumour fractions revealed a significantly reduced response to pure oxygen in HNSCC in comparison to the healthy lymph nodes, which can be attributed to abnormal tumour vasculature and associated hypoxia. This finding was further supported by the presence of low or non-perfused tumour regions, identified by DCE-MRI. Our results are compatible with recent pre-clinical findings [2], reporting higher oxygen refractory fractions in more hypoxic and less perfused tumours.
In conclusion, our data shows that OE-MRI can be used to identify hypoxic subregions in HNSCC tumours. This warrants further work to investigate the use of OE-MRI derived imaging biomarkers for identifying HNSCC patients likely to respond to radiotherapy, and mapping the degree of hypoxia for radiotherapy planning.
Acknowledgements
This work was undertaken at The Royal Marsden NHS Foundation Trust which received a proportion of its funding from the NHS Executive; the views expressed in this publication are those of the authors and not necessarily those of the NHS Executive. This work was supported by Cancer Research UK Programme Grant #C46/A10588, C7224/A13407, MRC grant G0701533 and support from the Wolfson Foundation. The authors acknowledge the support of CRUK and EPSRC to the Cancer Imaging Centre at ICR and RMH in association with MRC & Department of Health #C1060/A10334 and C1060/A16464, NHS funding to the NIHR Biomedical Research Centre and the Clinical Research Facility in Imaging,CRUK and EPSRC Cancer Imaging Centre in Cambridge and Manchester funding to the University of Manchester (grant C8742/A18097). M.O.L. is an NIHR Senior Emeritus Investigator.References
1. Brizel DM, Sibley GS, Prosnitz LR, Scher RL, Dewhirst MW. Tumor hypoxia adversely affects the prognosis of carcinoma of the head and neck. Int J Radiat Oncol Biol Phys 1997;38:285–9.
2. O'Connor JP, Boult JK, Jamin Y, Babur M, Finegan KG, Williams KJ, Little RA, Jackson A, Parker GJ, Reynolds AR, Waterton JC, Robinson SP. Oxygen-enhanced MRI accurately identifies, quantifies, and maps tumor hypoxia in preclinical cancer models. Cancer Res. 2016 Feb 15;76(4):787-95.
3. Bland MJ, Altman DG. Statistics notes: measurement error proportional to the mean. Br Med J 1996;313:106
4. d'Arcy JA, Collins DJ, Padhani AR, Walker-Samuel S, Suckling J, Leach MO. Informatics in Radiology (infoRAD): magnetic resonance imaging workbench: analysis and visualization of dynamic contrast-enhanced MR imaging data. Radiographics 2006;26:621–32.
Figures