3915
Low nodal plasma volume is associated with poor treatment response in head and neck cancer treated with induction chemotherapy.1Nottingham University Hospitals, Nottingham, United Kingdom, 2University of Nottingham, Nottingham, United Kingdom, 3The Royal Marsden NHS Foundation, London, United Kingdom, 4The Institute of Cancer Research, London, United Kingdom
Synopsis
Impaired tumour perfusion results in decreased efficacy of cancer treatment. In this work we investigated the optimal timing and predictive value of early chemotherapy induced changes, measured by dynamic contrast enhanced (DCE) and longitudinal intrinsic susceptibility (IS) MRI. We observed lower plasma volume in metastatic nodes responding poorly to the treatment. We found that for HNSCC patients treated with induction chemotherapy, combining DCE and IS-MRI methods improves early predictive value. This methodology could be used to aid patient stratification and subsequent radiotherapy treatment planning.
Purpose
To evaluate combined dynamic contrast enhanced (DCE) and intrinsic susceptibility (IS) MRI methods as pdictivebiomarkers in patients with HNSCC treated with induction chemotherapy and chemoradiation.Introduction
Induction chemotherapy is used in locally advanced head and neck squamous cell carcinoma (HNSCC) to select patients suitable for organ sparing strategy and reduce the likelihood of distant metastases[1]. Abnormal tumour vasculature may lead to impaired treatment agent delivery and hypoxia is a well-recognisedfactor for treatment failure in HNSCC[1]. DCE-MRI allows assessment oftumour perfusion and quantitative measurement of plasma volume[2],employing changes of T1-weighted signal proportional to concentration of injected endogenous gadolinium-based contrast agent. IS-MRI signal utilises changes of transversal relaxation rate, proportional to theconcentration of paramagnetic deoxy-haemoglobin in blood [3].In this work DCE and IS-MRI methods were combined to establish differences between metastatic HNSCC lymph nodes responding (CR) and not responding (NR) to treatment.Methods
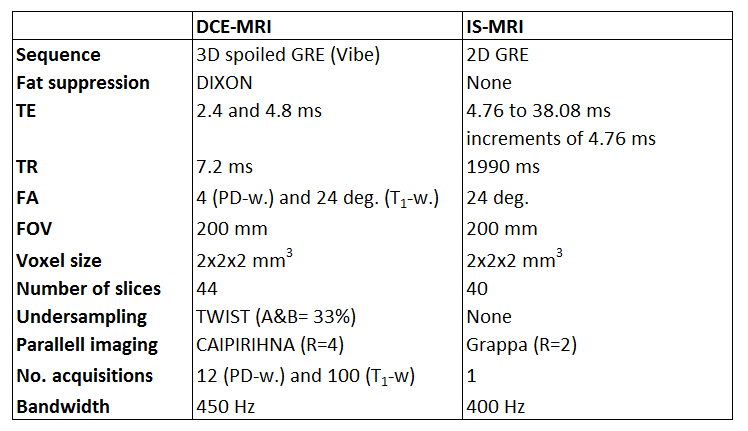
21 patients (median age 63, range 47-69 years) with stage III-IVb HNSCC underwent serial MRI at baseline (MR1), week-3 (MR2) and week-6 (MR3) of induction chemotherapy, prior to chemoradiation. A 1.5T system (Siemens, Aera)with flat top MRI couch was used with an appropriate head rest and thermoplastic shell immobilisation. Radiotherapy treatment planning system (RayStation) was used to outline tumour volumes (VOI). Patients with evidence of persistent disease at 3 months post chemoradiation, were classed as non-responders. Differences in baseline DCE parameters were compared between responders and non-responders using the Wilcoxon rank sum test. IS-MRI relaxation rate values (R2*) at baseline, week 3 and 6 of treatment were also compared. Multivariate analysis of variance (MANOVA) was performed to determine if the mean of DCE and IS variables differ significantly among CR/NR groups. Eigenvectors were used to identify the parameter combinations and time points allowing for the best treatment response prediction. DCE and IS-MRI sequence parameters are summarised in the Table 1. DCE-MRI was processed using MRIW software [4] with Extended Kety model[2] and a population-based arterial input function [5]. A set of DCE parameters was derived, including the volume transfer constant between blood plasma and extracellular extravascular space (Ktrans) and the total blood plasma volume fraction (Vp). R2* values were calculated using a mono-exponential model and a least-squared fit method (Matlab). Statistical tests were performed in Matlab with 0.05 significance threshold.Results
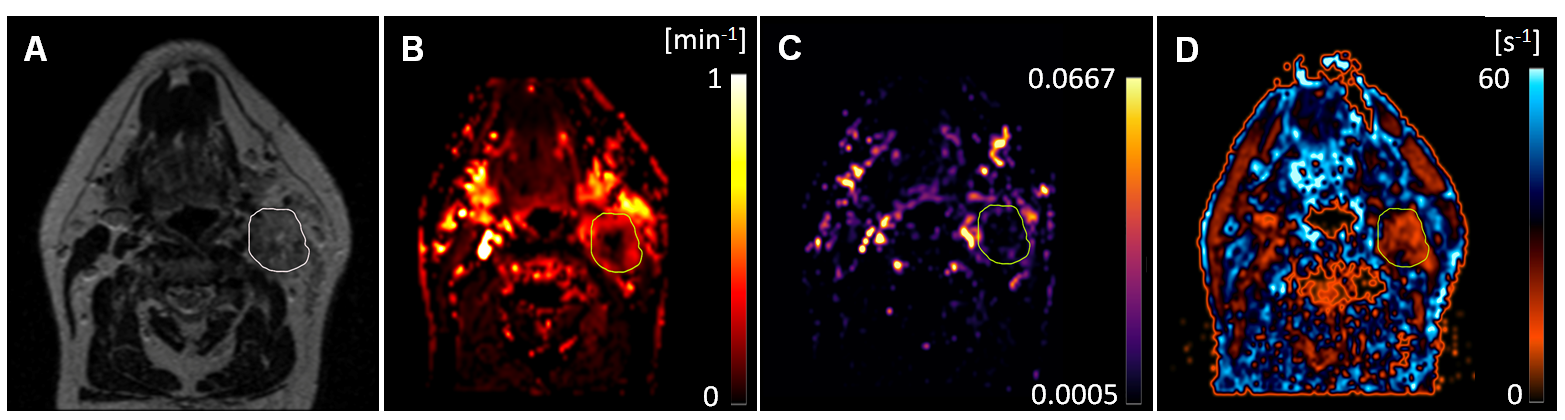
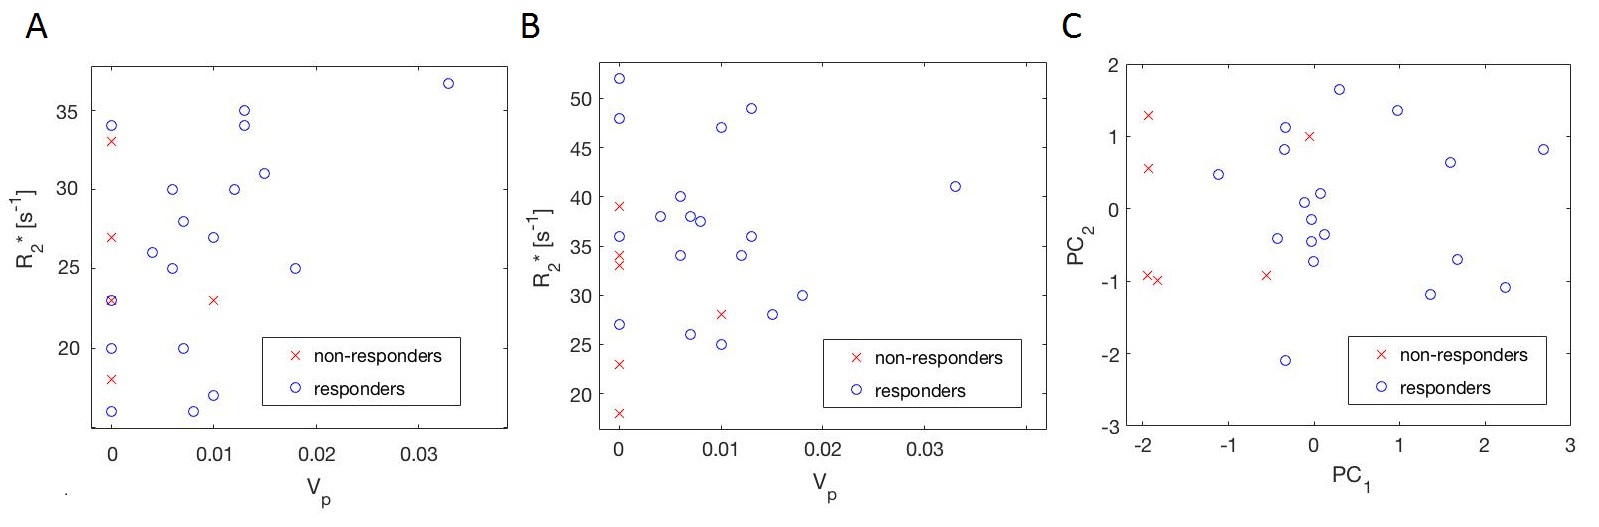
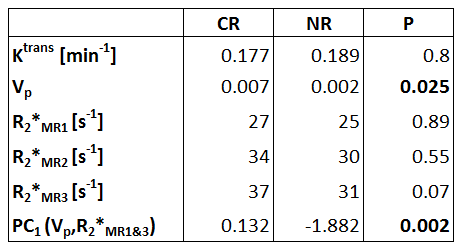
24 metastatic lymph nodes (responders: 18, non-responders: 6) were outlined and analysed in the study. Figure 1 shows representative DCE and IS-MRI baseline maps. ANOVA revealed a single dimension of the group means (d=1, P=0.019). Linear combination of parameters was established with eigenvectors 135, -0.11, <0.01, 0.12 for Vp, R2*MR1, R2*MR2 and R2*MR3 respectively. R2*MR2 had marginal contribution to CR/NR differences and was excluded from further analysis. Scatter plots of Vp, R2*MR1 and R2*MR3 were shown in Figure 2 A-B, together with two principal components for combination of these parameters (Figure 2 C). Median DCE and IS-MRI VOI parameters, principal component and corresponding statistical P values are summarised in the Table 2. Lower plasma volume was observed in metastatic lymph nodes not responding to treatment (P=0.025). This difference was further increased for a combination of baseline Vp, baseline R2* and post 6 weeks of induction chemotherapy R2* (P=0.002).Discussion and conclusions
High blood volume and plasma flow have been previously associated with improved delivery and therapeutic effectiveness in HNSCC [6, 7]. Our findings support these observations, with lower plasma volume observed in treatment-resistant metastatic lymph nodes. We also established that combination of plasma volume with relaxation rates measured at the baseline and at the end of week 6 of induction chemotherapy, further improves its predictive value. This might be explained by IS-MRI dependence of the blood volume [3], dominating blood oxygen saturation and haematocrit differences, which are less likely to affect outcome of chemotherapy. The combined baseline DCE and serial IS-MRI measurements could be used to identify patients less likely respond to treatment, allowing for planning of intensified radiation treatment or supporting decision for alternative therapeutic method. The use of intrinsic susceptibility contrast method makes it especially compatible with longitudinal treatment monitoring and could be easily implemented in the clinical practice. The results warrant further work to validate the method in a prospective patient cohort and to establish repeatability.
To conclude, we demonstrated that the combined DCE and IS-MRI methods during induction chemotherapy have a potential as predictive biomarker in HNSCC. These measurements can improve patient stratification and aid subsequent functional-imaging guided treatment adaptation.
Acknowledgements
This work was undertaken at The Royal Marsden NHS Foundation Trust which received a proportion of its funding from the NHS Executive; the views expressed in this publication are those of the authors and not necessarily those of the NHS Executive. This work was supported by Cancer ResearchUKProgramme Grant Nos. C46/A10588 and C7224/A13407. The authors acknowledge the support of CRUK and EPSRC to the Cancer Imaging Centre at ICR and RMH in association with MRC & Department of Health Nos. C1060/A10334 and C1060/A16464 and NHS funding to the NIHR Biomedical Research Centre and the Clinical Research Facility in Imaging. M.O.L. is an NIHR Emeritus Senior Investigator.References
1. Pignon JP, le Maitre A, Maillard E, Bourhis J. Meta-analysis of chemotherapy in head and neck cancer (MACH-NC): An update on 93 randomised trials and 17,346 patients. RadiotherOncol. 2009;92(1):4-14.
2. Tofts PS, Brix G, Buckley DL, Evelhoch JL, Henderson E, Knopp MV, et al. Estimating kinetic parameters from dynamic contrast-enhanced T 1-weighted MRI of a diffusable tracer: standardized quantities and symbols. J MagnReson Imaging 1999;10:223-32.
3. Blockley NP, Jiang L, Gardener AG, Ludman CN, Francis ST, Gowland PA.Field strength dependence of R1 and R2* relaxivities of human whole blood to ProHance, Vasovist, and deoxyhemoglobin. MagnReson Med. 2008 Dec;60(6):1313-20.
4. d'Arcy JA, Collins DJ, Padhani AR, Walker-Samuel S, Suckling J, Leach MO. Informatics in Radiology (infoRAD): Magnetic Resonance Imaging Workbench: analysis and visualization of dynamic contrast-enhanced MR imaging data. RadioGraphics. 2005;26:621–32.
5. Orton MR, d'Arcy JA, Walker-Samuel S, Hawkes DJ, Atkinson D, Collins DJ, et al. Computationally efficient vascular input function models for quantitative kinetic modelling using DCE-MRI. Phys Med Biol 2008,53: 1225-39.
6. Bernstein JM, Kershaw LE, Withey SB, Lowe NM, Homer JJ, Slevin NJ, Bonington SC, Carrington BM, West CM.Tumor plasma flow determined by dynamic contrast-enhanced MRI predicts response to induction chemotherapy in head and neck cancer.Oral Oncol. 2015 May;51(5):508-13.
7. Zima A, Carlos R, Gandhi D, Case I, Teknos T, Mukherji SK.Can pretreatment CT perfusion predict response of advanced squamous cell carcinoma of the upper aerodigestive tract treated with induction chemotherapy?AJNR Am J Neuroradiol. 2007 Feb;28(2):328-34.
Figures