3912
Synthetic MRI of bone metastases in castration-resistant prostate cancer: detection of tumor activity and calcifications.1Department of Radiology, National Hospital Organization Tokyo Medical Center, Tokyo, Japan, 2Department of Diagnostic Radiology, Keio University School of Medicine, Tokyo, Japan, 3Department of Biomedical Engineering, Tokai University School of Engineering, Kanagawa, Japan, 4Department of Urology, Tokyo Medical and Dental University Graduate School, Tokyo, Japan, 5Department of Radiology, UMC Groningen, Groningen, Netherlands, 6Visionary Imaging Services, Inc., Yokohama, Japan, 7Department of Radiology, Advanced Imaging Center Yaesu Clinic, Tokyo, Japan
Synopsis
We quantified T1, T2, and proton density (PD) of bone metastases in castration-resistant prostate cancer with synthetic MRI (SyMRI). Bone foci of interest were classified into four groups; active disease, red bone marrow (RBM), inactive disease without calcification (Inactive C(-)), and inactive disease with calcification (Inactive C(+)). Active disease group showed very high PD, and Inactive C(+) group showed very low PD. Both Inactive C(-) and RBM showed medium values. Significant differences were noted among these three divisions. SyMRI thus shows clinical potential to differentiate active/inactive lesions, calcifications, and red bone marrow in castration-resistant prostate cancer.
Body of Abstract
Introduction: Bone scintigraphy has traditionally been the most popular method for the evaluation of the bone metastases, although it inherently suffers from the flare phenomenon, as a result of which it cannot be repeatedly used at short time intervals during follow-up. Recently, the European Organization for Research and Treatment of Cancer imaging group (EORTC) positioned whole body diffusion weighted imaging (WB-DWI) as a potential first choice in this setting [1]. With WB–DWI, tumor activity may be evaluated based on signal intensity; high intensity implies active, and low intensity implies inactive disease. However, we still need additional in-phase/out-of-phase images to identify red bone marrow (which may mimic active lesions on WB-DWI), and need computed tomography (CT) to evaluate for calcifications/sclerosis especially in cases with prostate cancer. Recently developed synthetic MRI (SyMRI) allows generating various image contrasts by one single scan (even retrospectively), and it also allows for quantitative analysis of T1, T2, and proton density (PD) [2]. We studied if quantitative values obtained with SyMRI are useful to evaluate tumor activity and presence of calcifications in bone metastases.
Methods: This prospective study includes twenty-one castration-resistant prostate cancer patients. Diffusion-weighted Whole Body Imaging with Background Body Signal Suppression (DWIBS; 2:39 min/station) and SyMRI 3:47 min) were performed in all patients. A total of 68 detected foci of interest were classified into four groups; (1) active disease, (2) red bone marrow (RBM), (3) inactive disease without calcifications (Inactive C(-)), and (4) inactive disease with calcifications (Inactive C(+)), according to signal intensity on DWI,CT, out-of-phase signal loss, prostate specific antigen (PSA), and bone scintigraphy. A 1 cm-diameter region of interest (ROI) was randomly set in each focus of interest by two radiologists independently and corresponding T1, T2, and PD were calculated by dedicated SyMRI software. The differences in T1, T2, and PD values were then assessed among the four groups. Statistical analysis was conducted by Wilcoxon rank sum test and P=0.05 or less was considered significant. The correlations of T1, T2, and PD values between the readers were assessed by Spearman correlation analysis. Additionally, three-dimensional scatter plots were created to visualize the distribution of the values among the 4 groups.
Results: The number of included cases (lesions) in each group (active, RBM, Inactive C(-), and Inactive C(+)) were 12 (25), 7 (10), 10 (19), and 5 (14), respectively. Inter-observer analysis revealed excellent intraclass correlation coefficient for T1, T2, and PD (ρ = 0.72, 0.80, and 0.95, respectively). The difference in PD values among four groups is demonstrated in (Fig.1). The active disease group showed very high PD, and the Inactive C(+) group showed very low PD. Both Inactive C(-) and RBM showed medium values. Significant differences were noted among these three divisions. Regarding T1, a significant difference was noted in both readers only between active and RBM (p=0.0466, and 0.0090, for each reader), and active and Inactive C(-) (p=0.0080, and 0.0060, for each reader). A significant difference in T2 was noted only between active and Inactive C(+) (p=0.0098, and 0.0045, for each reader). Three-dimensional scatter plots (Fig.2 and 3) showed nice visualization of the difference described above. Fig.4 shows an example of a case with an inactive lesion with calcification, characterized by very low PD value. Fig.5 shows an example of a case with red bone marrow, characterized by medium PD value.
Discussion: Based on the results, we can distinguish active lesions from any other inactive or non-tumorous foci. Another impressive thing is that we can know the presence of calcification by SyMRI (without CT). Since the applied TE value was relatively not very low (13ms, shortest echo time among multi echoes), we should lose the signal from lesions with a very short T2. Therefore, the measured PD value may not be the absolute value. Nevertheless, the results encourage us to use visible PD map for the differentiation of active lesions from inactive lesions or red bone marrow, and this may be important for clinical use. Processing the data in a three-dimensional scatter plot may particularly be useful as a powerful visible tool to differentiate the different groups.
Conclusions: SyMRI may differentiate active/inactive lesions, calcifications, and red bone marrow in castration-resistant prostate cancer. The presence of calcifications can be recognized by low PD values.
Acknowledgements
No acknowledgement found.References
1. Lecouvet FE, Talbot JN, Messiou C, et al. Monitoring the response of bone metastases to treatment with Magnetic Resonance Imaging and nuclear medicine techniques: a review and position statement by the European Organisation for Research and Treatment of Cancer imaging group. Eur J Cancer. 2014;50(15):2519-2531.
2. Warntjes JB, Leinhard OD, West J, et al. Rapid magnetic resonance quantification on the brain: Optimization for clinical usage. Magn Reson Med. 2008;60(2):320-329.
Figures
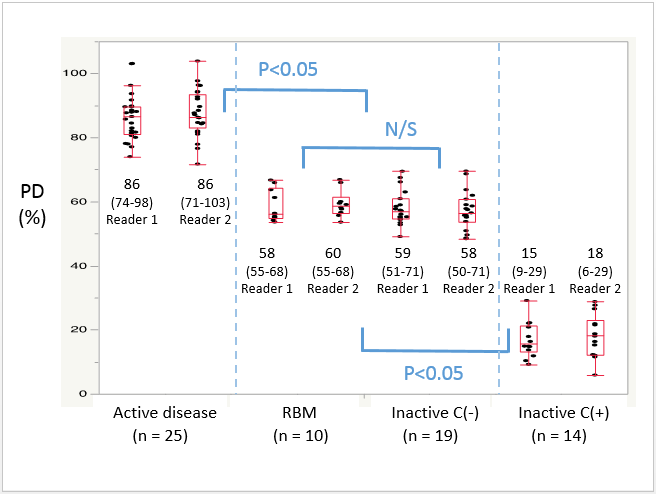
Fig. 1. Box Plot of PD for reader 1 and reader 2.
Box plots demonstrate the distribution of PD values in each group. The middle line in each box represents the median. Median PD values (range) are shown above or below the boxes. The active disease group shows very high PD, whereas the Inactive C(+) group shows very low PD. Both Inactive C(-) and RBM show relatively medium values. Significant differences were noted among these three divisions.
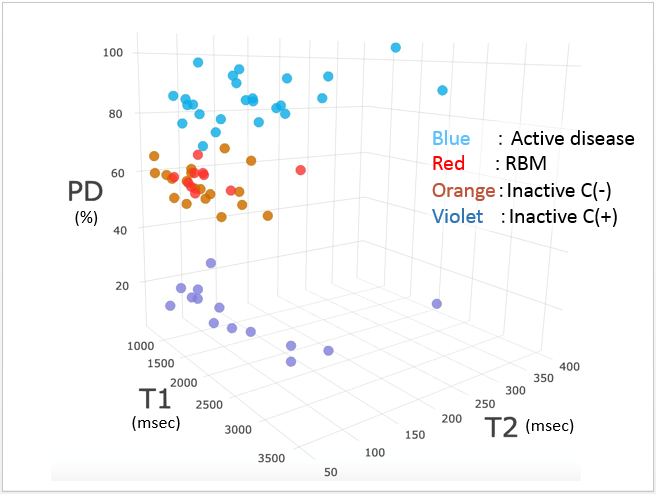
Fig. 2. Three-dimensional scatterplot for reader 2 (overall picture).
Three-dimensional scatter plot shows nice visualization of the differences among the four groups. Groups are well differentiated mainly by PD.
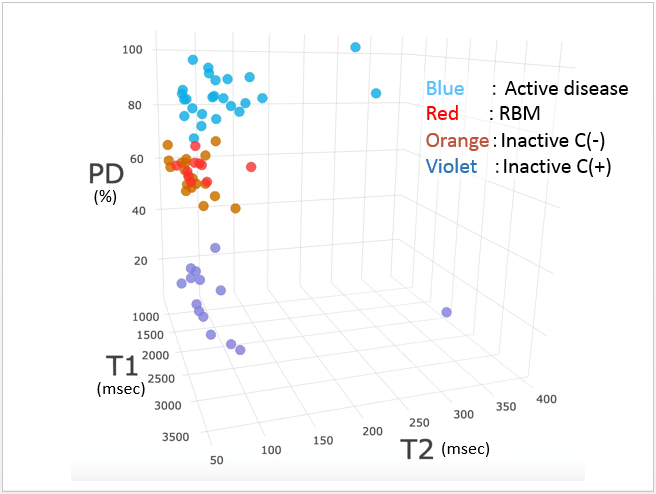
Fig. 3. Three-dimensional scatterplot for reader 2 (perpendicular to the “T2-axis”).
Active lesions tend to have longer T2 value than others.
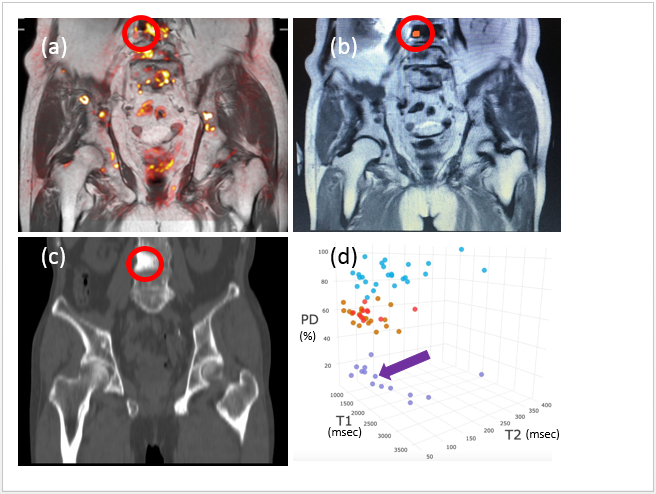
Fig. 4. Inactive lesion with calcification A 84-year-old man (cT3bN0M1b, iPSA 1767, GS 4+4)
(a) Fusion image (T1WI+DWI) shows a low DWI signal intensity lesion in the fourth lumbar vertebra (red circle). (b) Coronal T1-weighted image shows low signal intensity of the lesion (red circle). The orange spot represents the 1 cm-diameter region of interest. (c) Coronal contrast-enhanced CT image (bone settings) shows calcification of the lesion (red circle). (d) The lesion’s location in the three-dimensional scatterplot is indicated by the violet arrow.
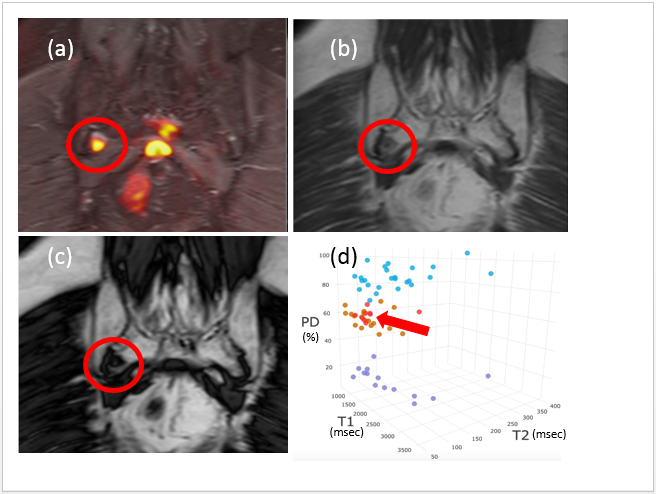
Fig. 5 Red bone marrow focus A 77-year-old man (cT3bN0M1b, iPSA 277, GS 4+4)
(a) Fusion image (STIR+DWI) shows a high DWI signal intensity focus (orange spot) at the right caudal sacrum (red circle). (b) Coronal in-phase image and (c) coronal out-of-phase image demonstrate out-of-phase signal loss of this focus on interest (red circle), in keeping with normal red bone marrow. (d) This location of this (red bone marrow) focus in the three-dimensional scatterplot is indicated by the red arrow.