3911
MR-Spectroscopic Imaging in the Spotlight of the 2016 WHO Classification1Department of Neuroradiology, Medical Center Freiburg, Freiburg, Germany, 2Department of Neuroradiology, Medical Center Freiburg, Freibrug, Germany, 3Department of Neuroradiology, Medical Center Freiburg, Frieburg, Germany, 4Department of Neurosurgery, Medical Center Freiburg, Freiburg, Germany
Synopsis
The purpose of this study is to map spatial metabolite differences across the three molecular subgroups of glial tumors, defined by the IDH1/2 mutation and 1p19q-co-deletion, using chemical shift imaging. The classification was based on a radiomic approach to the spectroscopic data.
Introduction
In 2016, the WHO revised their 2007 classification (1) of brain tumors, driven by new molecular discoveries (2,3). Gliomas (grade II-IV) are divided into three subgroups based on two genetic alterations: IDH 1/2 mutation (astocytoma) and 1p19q co-deletion (oligodendroglioma). Gliomas without an IDH 1/2 alteration contain a glioblastoma-like molecular pattern. Independently of the WHO grading, the malignant behavior of gliomas is particularly linked to its molecular subgroup. The most promising approach to face the challenge of preoperative prediction of the molecular subgroup is “Radiogenomics”, a novel translational research concept that generally integrates multiparametric imaging features and molecular patterns to optimize classifications of cancer disease. Out of all imaging modalities, spectroscopy is the one being most closely linked to gene expression regulation(4). This study aims map the spatial metabolite differences across the three molecular and to provide an accurate prediction of these subgroups using chemical shift imaging data as input for a radiomic analysis.Methods
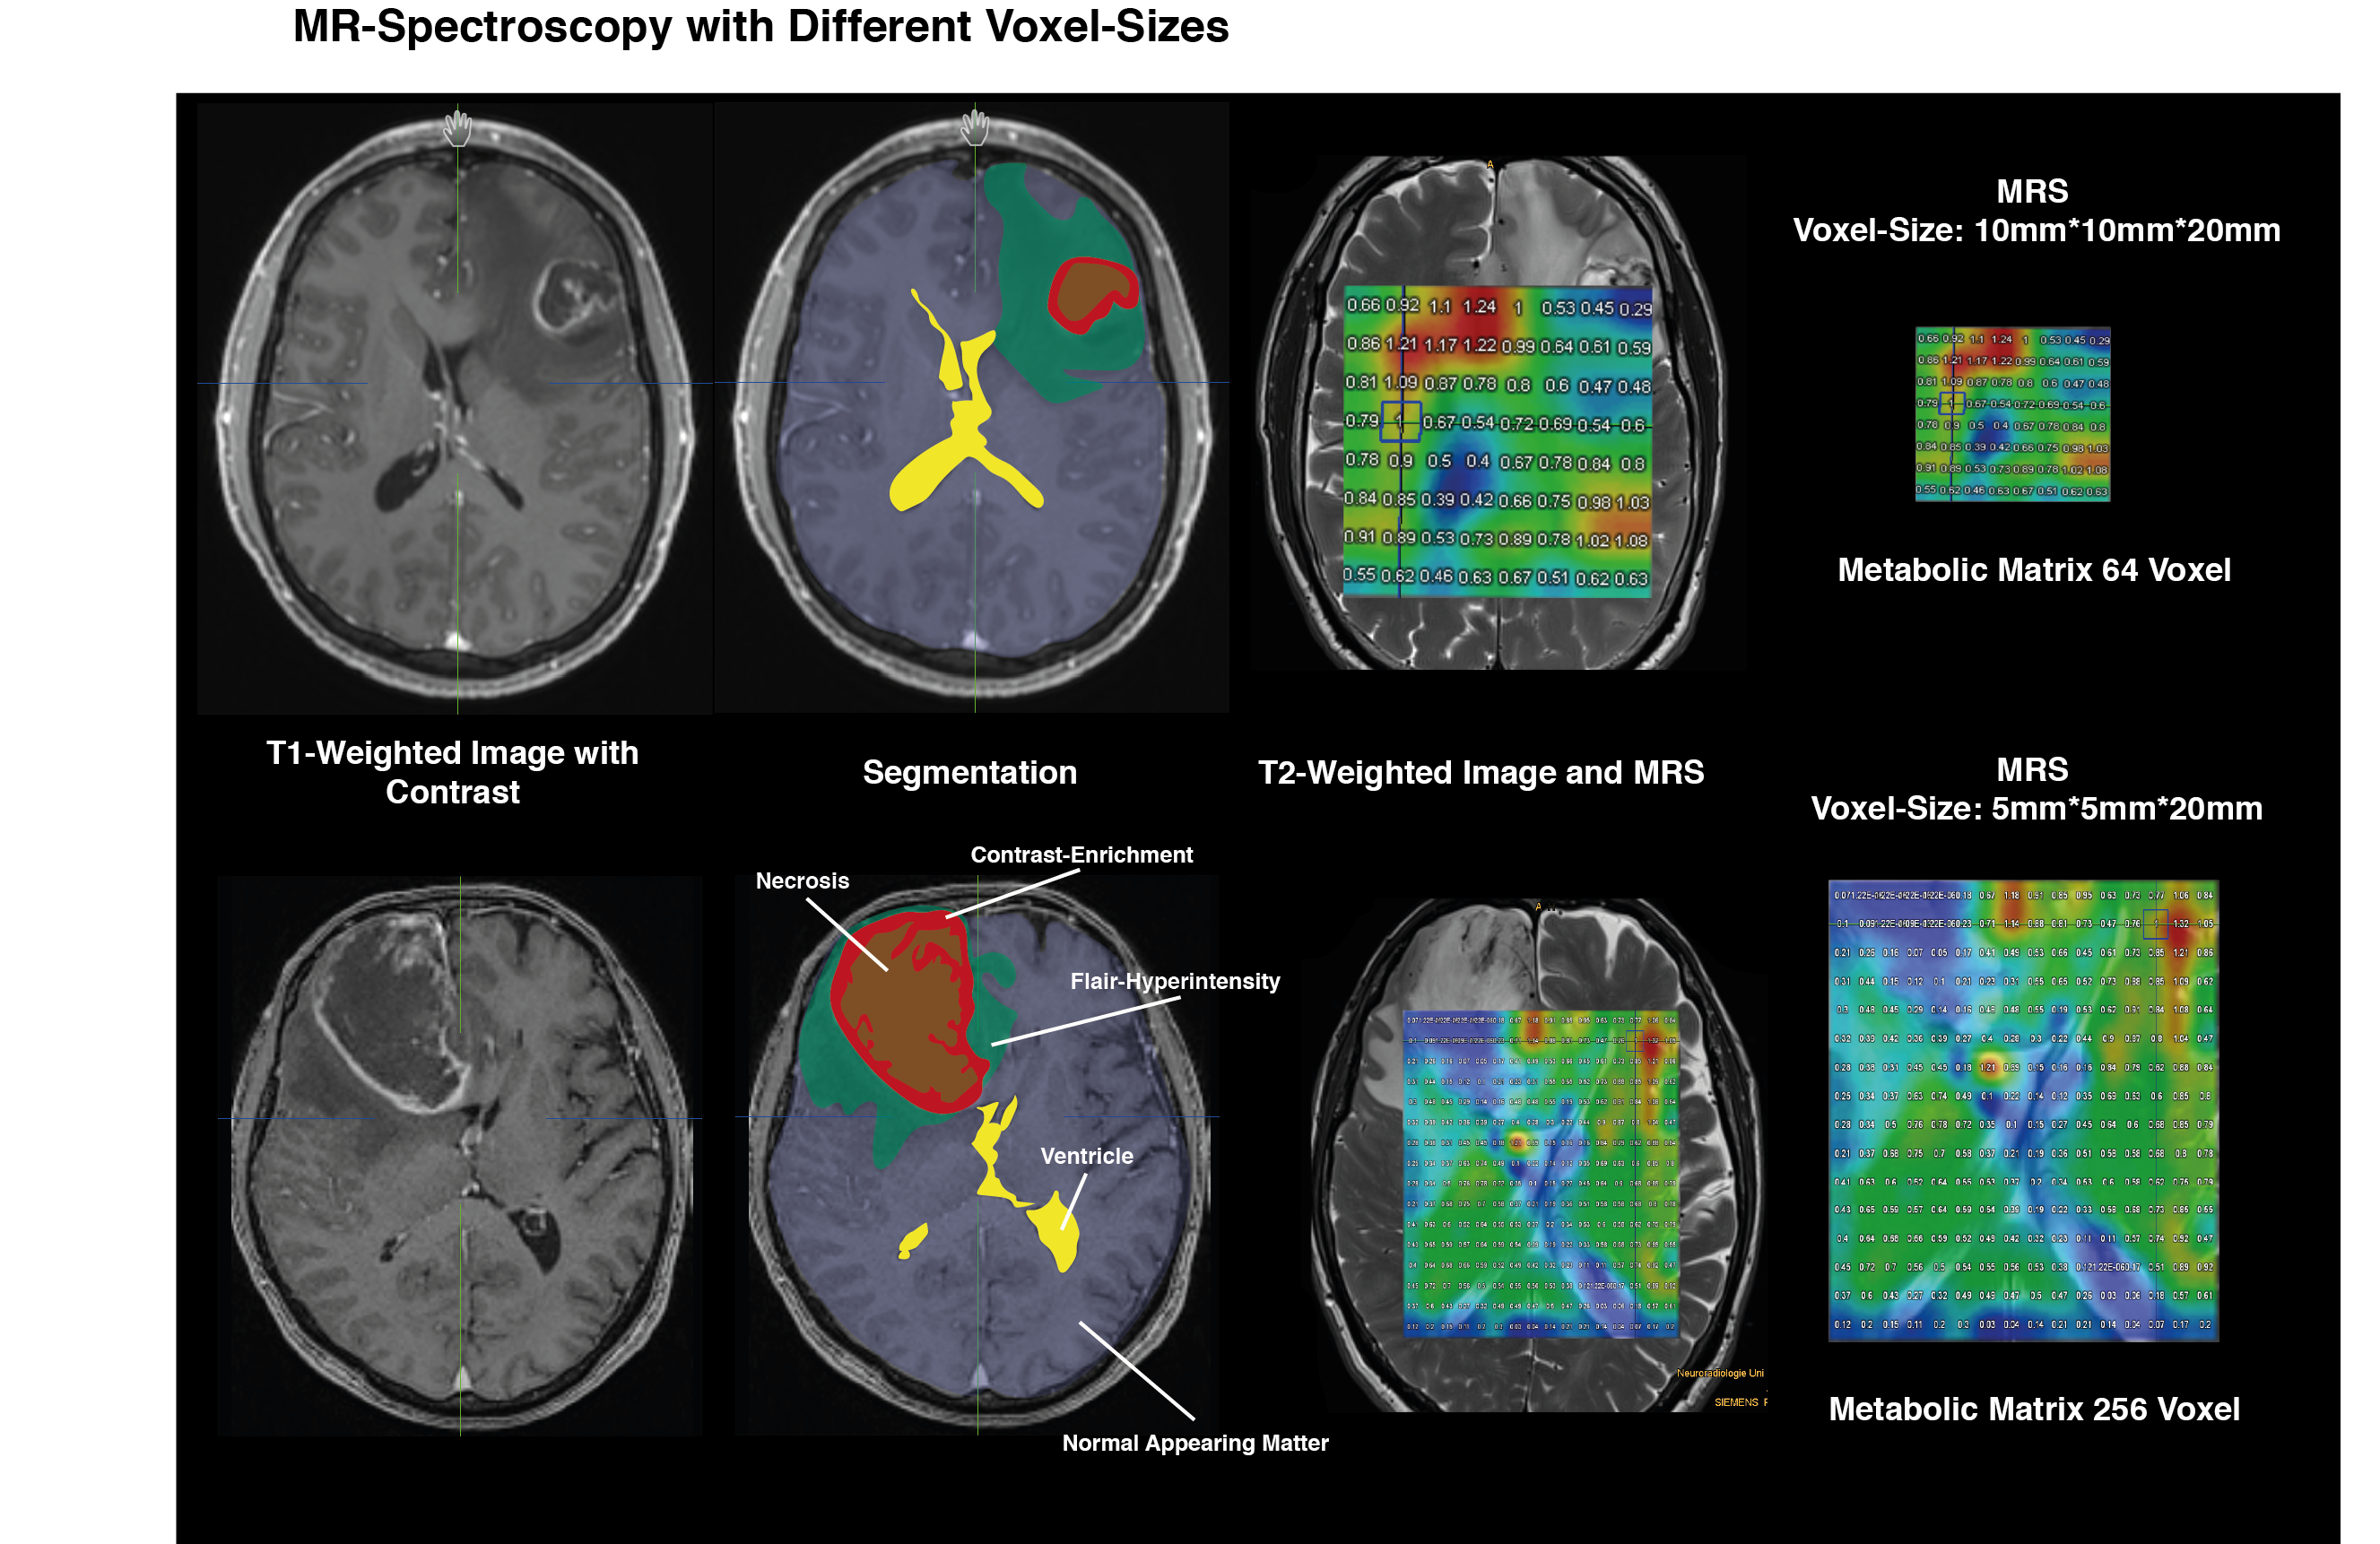
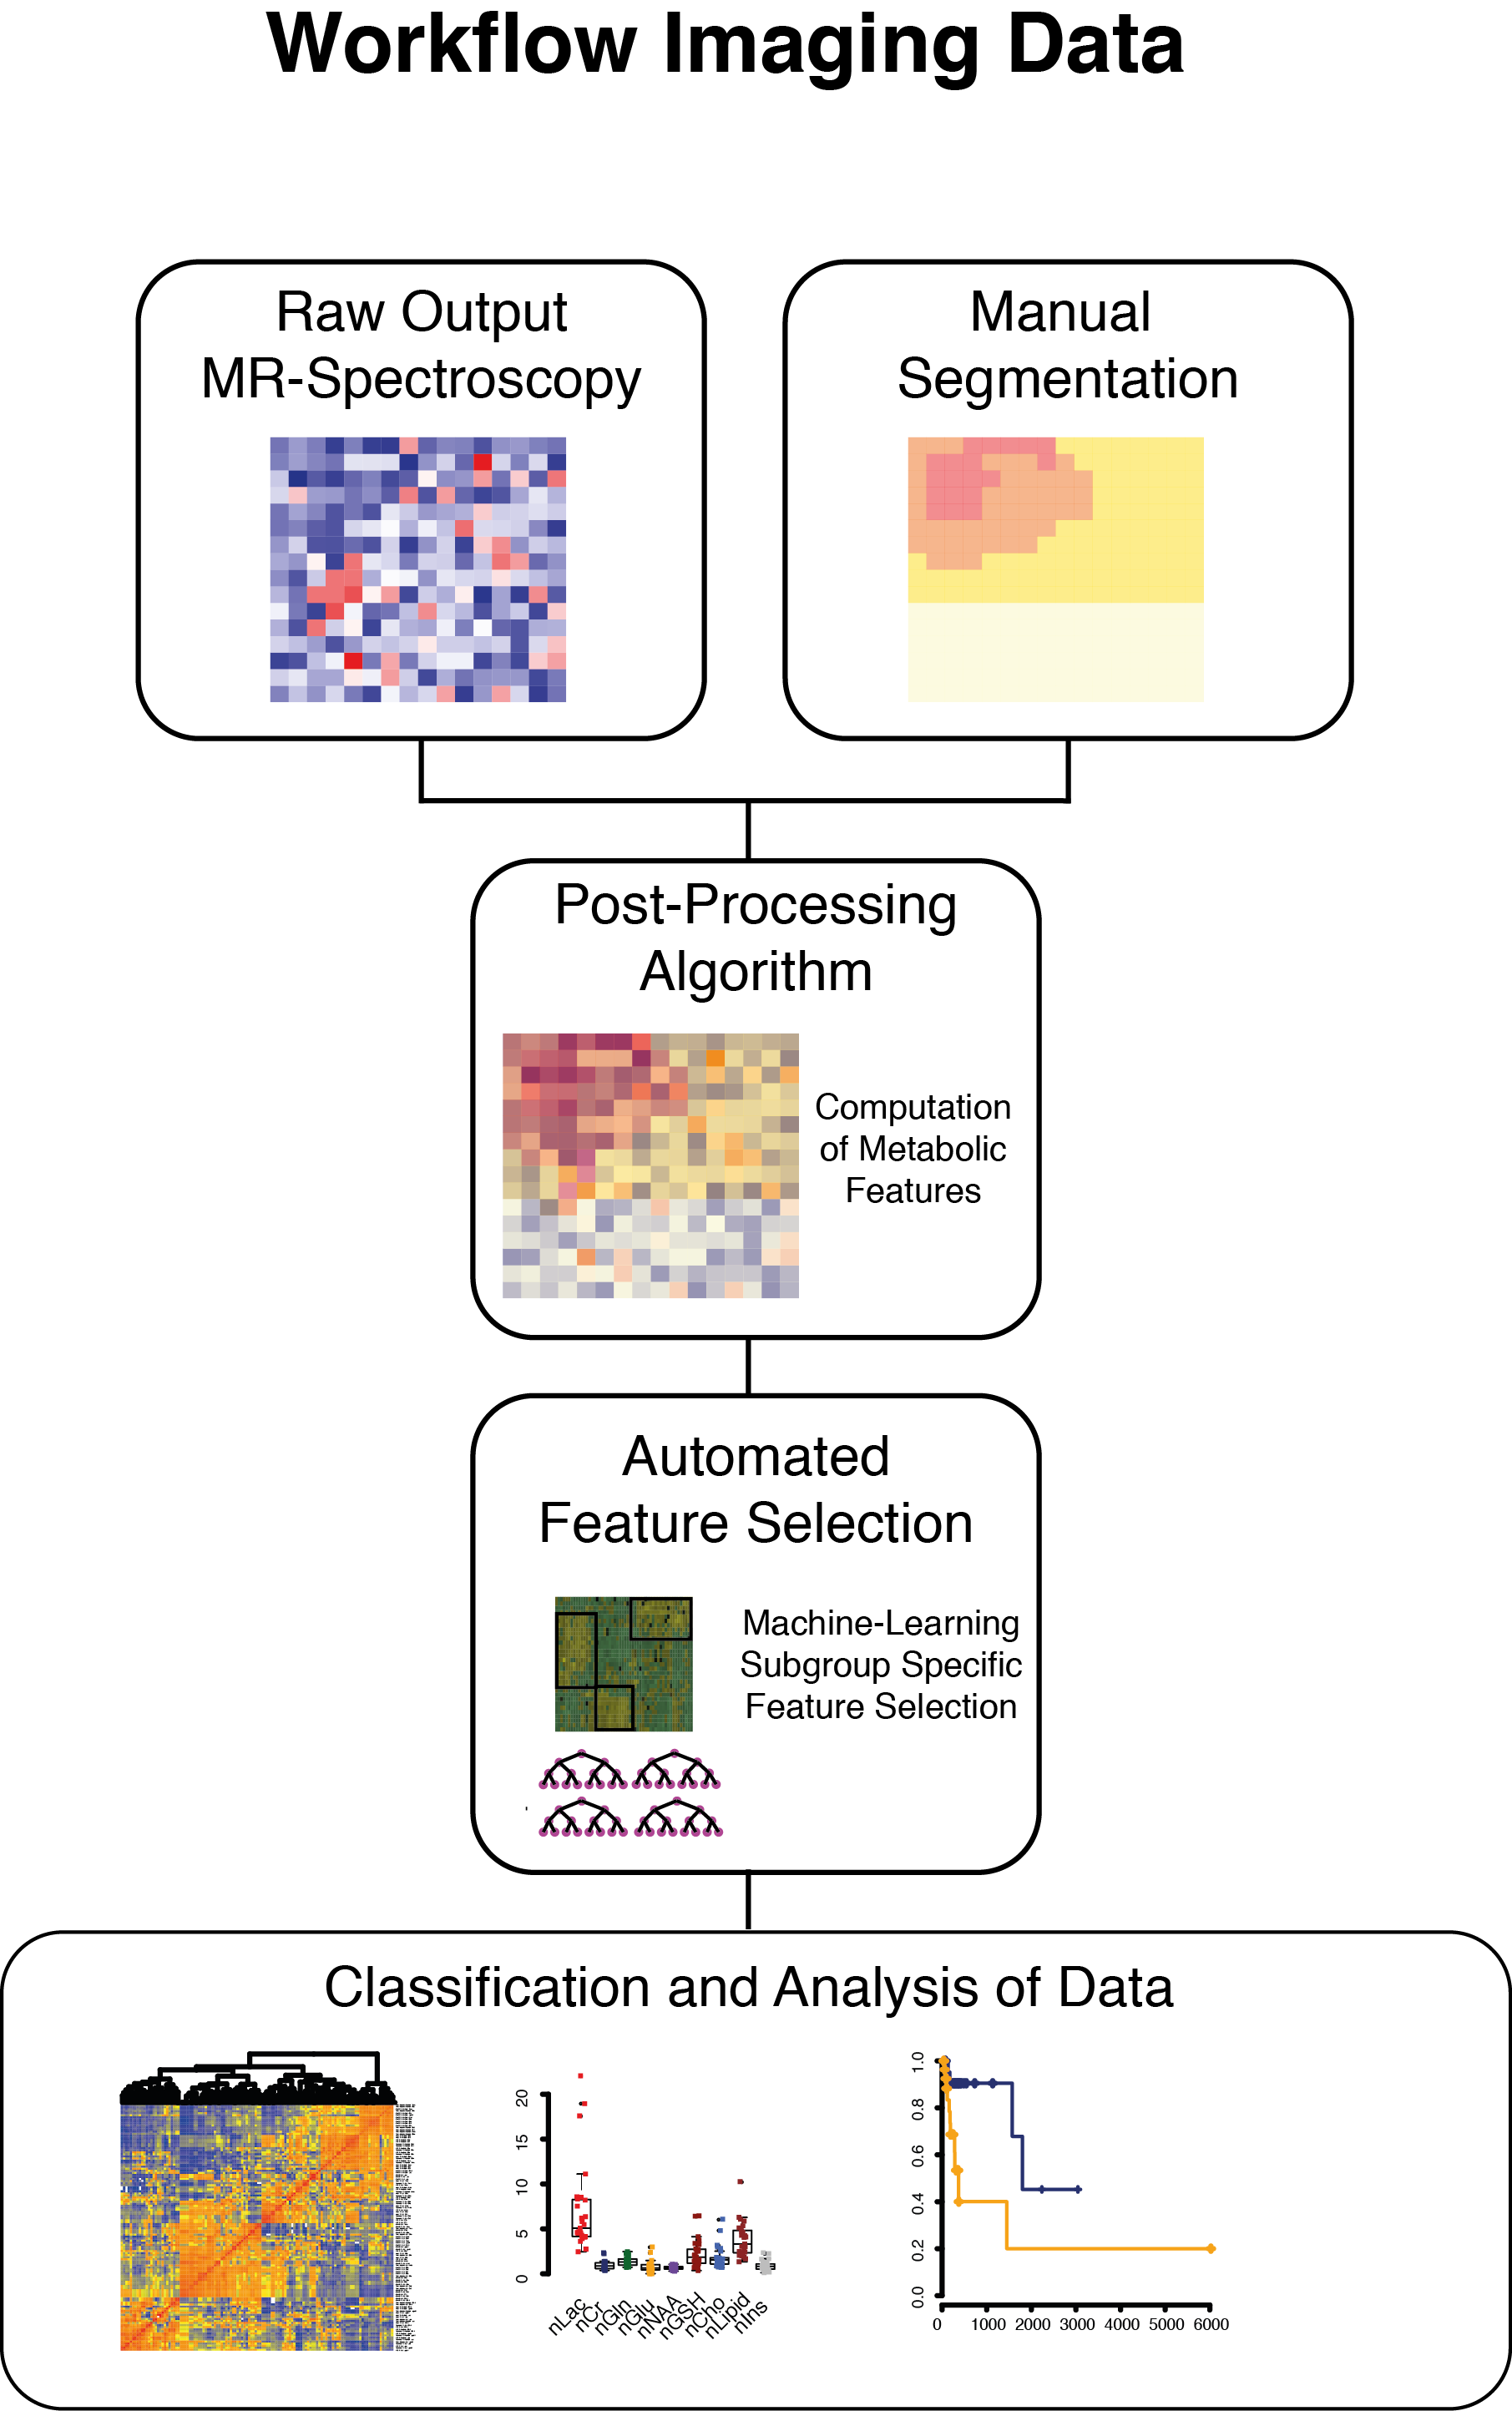
Between 2016 and 2017, a total of 65 patients were prospectively recruited and underwent proton MR spectroscopic imaging (CSI, semi-LASER, TR = 1700 ms, TE = 40 ms, voxel size = 5 × 5 × 20 mm3) as part of imaging (Figure 1a). Tumor regions were segmented into FLAIR hyperintensity (FLAIR), contrast-enhancing tumor CET) and normal appearing matter (NAM), and assigned to corresponding MRS voxels Out of 860 initially computed radiomic features, 45 meaningful features were selected by a correlation based method and used to train a machine learning model. Validation of the classification model was performed on a previously published CSI dataset (n=19) mixed by randomly selected patients from our cohort. Distribution and variances of all data was tested by Shapiro-Wilk test (p>0.05). Metabolic differences between tumor regions were tested by Wilcoxon signed-rank test. All statistical analysis was performed with R-software. Progression-free survival (PFS) was available for 26/53 patients (no event for 27 patients, censored). The Kaplan-Meier method was used and the Hazard-Ratio (HR) was calculated by Cox-regression tests.Results
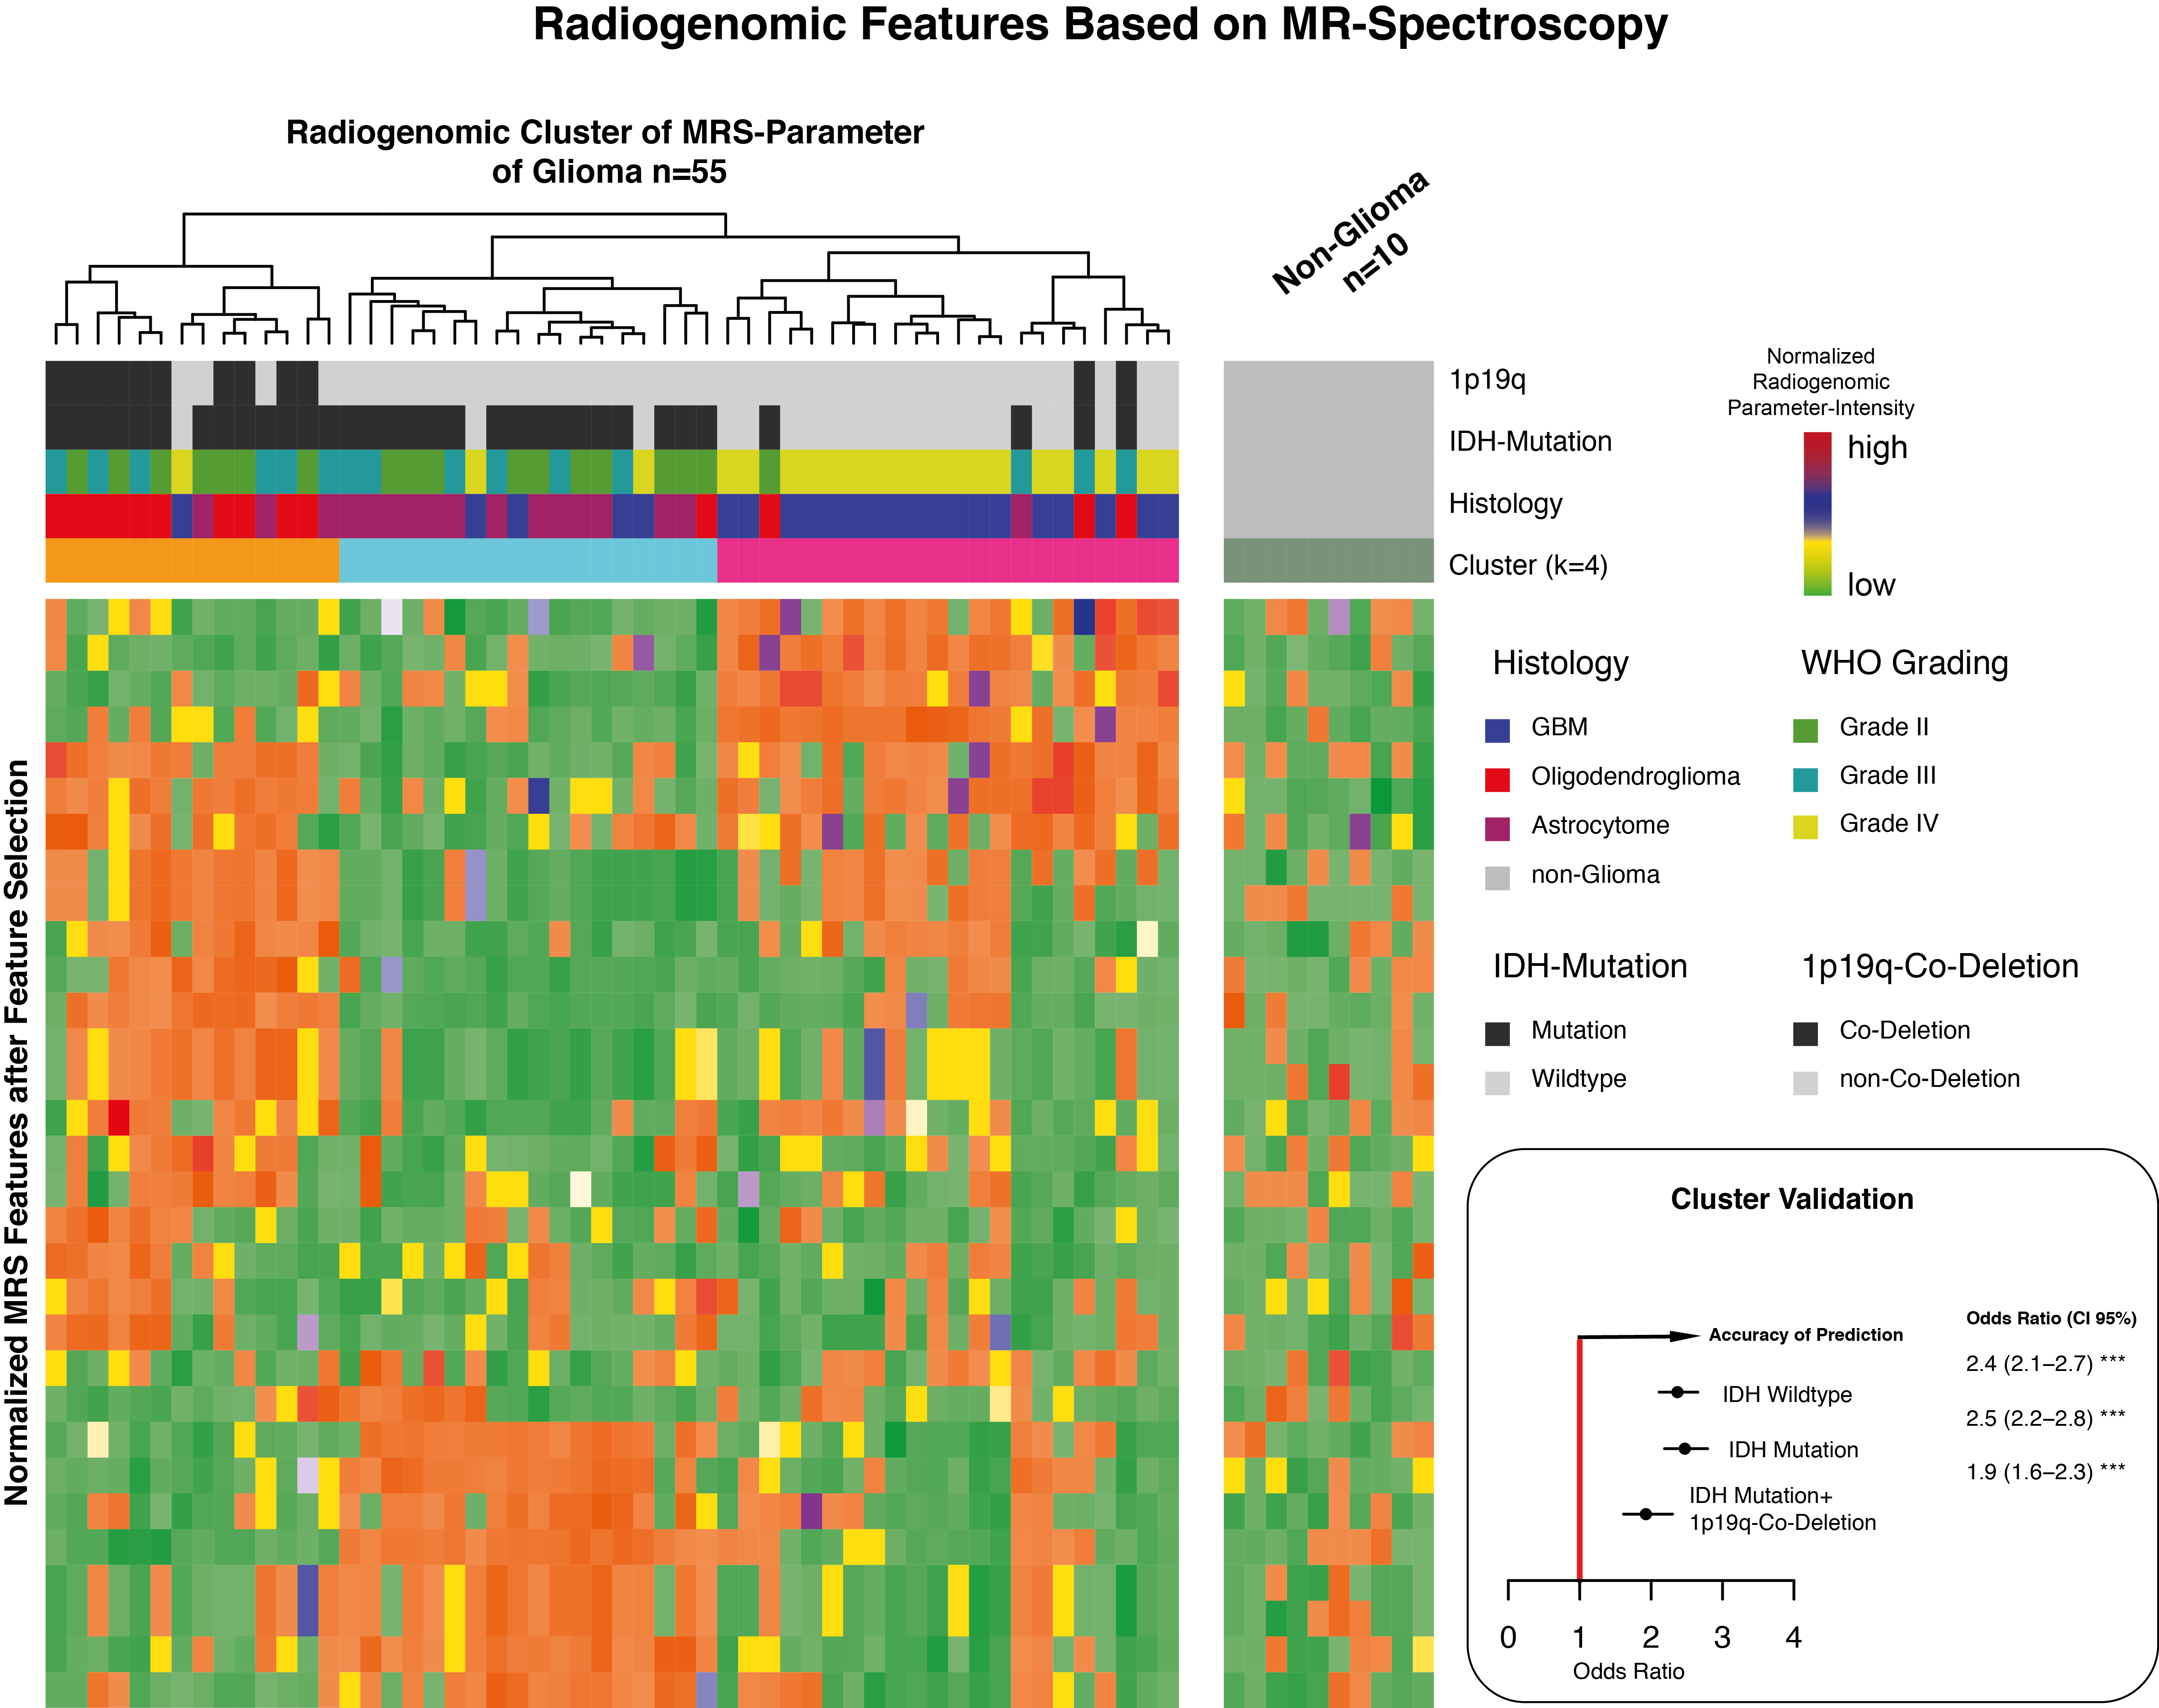
Spectroscopic features allowed a robust separation between all molecular subtypes by PAM clustering. The data analysis using a Random Forest model showed an accuracy rate of 94.2%. Certain metabolites played a major role in distinguishing between the molecular classes. So, creatine (median: 0.87 IQR (0.23- 1.48), padjusted<0.01) and glutamate (median: 0.68 IQR (0.4- 1.1), padjusted<0.05) were increased in CET of IDH mutant gliomas. In IDH widltype tumors, CET showed significantly high concentrations of glutathion (median: 2.3 IQR (1.7- 3.3), p adjusted=0.01), lactate (median: 6.35 IQR (3.6- 15.8), p adjusted<0.001), and lipids (median: 3.2 IQR (2.03- 4.89), p adjusted<0.001). The most important metabolite, however, that additionally distinguished IDH mutation and IDH mutation plus 1p19q co-deletion was Inositol in CET. The highest intensity of Ins was detected in IDH mutated tumors (median: 2.08 IQR (1.48- 2.72), p adjusted<0.001) followed by the 1p19q co-deleted patients (median: 1.8 IQR (1.2- 2.5), p adjusted<0.05). The lowest intensity of Ins was measured in the IDH wildtype tumors [median: 1.4 IQR (0.21- 2.2)]. Increased nIns and nCr of tumors with an IDH mutation was also detectable in the FLAIR-hyperintense region. Moreover, creatine was specifically distributed in FLAIR hyperintensity. Thus, we analysed the progression free-survival of patients with high creatine in the non-resected FLAIR hyperintense tumor border compared to those with low creatine. Despite of a low number of events (n=21), patients with high creatine in the non-resected tumor border showed a significant lower progression-free survival (HR 4.05, CI95%(1.8-8.9) p=0.043) than those without residual high creatine.Discussion
The new combination of processing spectroscopic imaging and multidimensional radiomic data allowed a prediction of the molecular subgroups (IDH mutant, wildtype, 1p19q co-deletion) in an acceptable accuracy. Particular important metabolites were glutamate, creatine and myo-inositol being significantly increased in IDH-mutated tumors. Especially myo-inositol seems to play an important role in in distinguishing between all subgroups. In the literature, myo-inositol is a known marker of astrocytes and potentially flags regions of IDH mutated astrocytoma. Creatine and glutamate were also described as markers of the proneural transcriptional phenotype (4), which mainly occurs in IDH mutated gliomas. The study was limited by the intermediate number of cases and their progression free survival. However, generally the analysis of the obtained metabolic intensities matched the reported results in the literature.Conclusion
This study reports a novel application of spectroscopic imaging as input for a radiomic pipeline. This multidimensional analysis of MR spectroscopic data is a robust tool for predicting the molecular subtype in gliomas and adds important diagnostic information to the preoperative diagnostic work-up of glial tumors.Acknowledgements
No acknowledgement found.References
1. Louis, D. N. et al. The 2016 World Health Organization Classification of Tumors of the Central Nervous System: a summary. Acta Neuropathol. 131, 1–18 (2016).
2. Brat, D. J. et al. Comprehensive, Integrative Genomic Analysis of Diffuse Lower-Grade Gliomas. N. Engl. J. Med. 372, 2481–98 (2015).
3. Wiestler, B. et al. Integrated DNA methylation and copy-number profiling identify three clinically and biologically relevant groups of anaplastic glioma. Acta Neuropathol. 561–571 (2014). doi:10.1007/s00401-014-1315-x
4. Heiland, D. H. et al. The integrative metabolomic-transcriptomic glioblastome multiforme landscape of. Oncotarget (2017).
Figures