3910
Brain lithium and myo-inositol levels in lithium treated and non-lithium treated bipolar disorder patients1Institute of Cellular Medicine, Magnetic Resonance Centre, Newcastle University, Newcastle upon Tyne, United Kingdom, 2Institute of Neuroscience, Newcastle University, Newcastle upon Tyne, United Kingdom
Synopsis
The action of lithium in bipolar disorder (BD) is incompletely defined but the inositol depletion hypothesis1 states that lithium inhibits IMPase to deplete myo-inositol, confirmed in vivo using proton magnetic resonance spectroscopy (1H-MRS) following acute treatment2,3 Chronic treatment may upregulate IMPase, with trend-level increases in grey matter myo-inositol reported.4 This 1H-MRS study compares frontal white matter myo-inositol/creatine levels (8cm3 voxel) in BD subjects (lithium-treated versus BD controls taking other medication), supplemented by measuring brain lithium signal intensity using 3D 7Li-MRI. Myo-Ino/Cr levels were significantly lower in the lithium-treated group, but their levels did not correlate with 7Li-MRI signal intensity.
Purpose:
The study aimed to investigate the actions of lithium in BD by comparing white matter myo-Ino/Cr levels in those taking lithium (BD-Li) against patient controls taking other medication (BD-C), supplemented by exploring the relationship between metabolite level and brain 7Li-MRI signal intensity in the same voxel (BD-Li subjects only). Materials and Methods:
The sample comprised 22 euthymic subjects with BD (type I or II). The BD-Li group (n=9) had all taken lithium long-term, with a range of treatment durations (1-15 years). The BD-C group (n=13) took other medications for BD but all were naïve to lithium. All MR data were acquired on a Philips 3T Achieva scanner (Philips Medical Systems, Best, The Netherlands). 7Li-MRI was performed using a double tuned 1H/7Li radiofrequency (RF) birdcage head coil (RAPID Biomedical, Rimpar, Germany). 1H-MRS was obtained using an 8-channel SENSE head coil.
For 1H-MRS measurements of myo-inositol and creatine levels, a localised 8cm3 voxel located in white matter was sampled (Figure 1). A fully relaxed conventional MR spectrum was acquired with a short TE PRESS sequence (TR = 3s, TE = 36ms, averages = 128, samples = 1024, sample frequency = 2000).
A 7Li 3D Balanced Steady State Free Precession (7Li-MRI) gradient echo acquisition was also acquired in BD-Li subjects using an acquisition protocol optimised for maximal 7Li signal amplitude based on the in vivo relaxation (T1 and T2) properties of 7Li (20 × 19 × 7 acquisition matrix and 24.0 x 25.3 x 25.0 voxel size, 480 × 480 × 175 mm3 field of view, with TR = 9.4 ms, TE = 4.5 ms, flip angle = 60 degrees, receiver bandwidth = 219 Hz/pixel, 500 averages per dynamic, 3 dynamics). Data were reconstructed into a 32 × 32 × 7 matrix with a voxel size of 15 × 15 × 25 mm3. The three scan dynamics were summed in complex form (total scan duration 24 minutes).
3D T1-weighted (T1w) images of brain anatomy were obtained for each subject (TR = 8.2 ms, TE = 4.6 ms, acquisition matrix = 180 x 200 x 146 mm3 reconstructed into a matrix size of 240 × 240 × 146 mm3, isotropic 1 mm resolution, FOV = 216 x 240 x 175, 1 average).
Spectroscopic analysis was performed off-line using an automated, standard evaluation technique for analysing MRS in the time domain jMRUI, QUEST algorithm5,6. Myo-inositol metabolite concentrations were evaluated with respect to creatine concentration (myo-Ino/Cr ratio).
7Li-MRI data was analysed using ImageJ software7 and in-house software written in Matlab. To determine the relationship between 7Li-MRI signal intensity and myo-inositol/creatine levels, a region of interest (ROI) was placed in the same white matter location as the spectroscopic voxel.
MR results were compared using parametric statistical tests, assuming a significance level of p <0.05. Group data are reported as mean ± SD.
Results:
In a group-wise analysis, BD-Li subjects had significantly lower myo-Ino/Cr ratios compared to the BD-C subjects (0.4 ± 0.2 versus 0.7 ± 0.3; p < 0.038, Figure 2). No correlation was found between 7Li-MRI signal intensity and myo-Ino/Cr ratios (analysis for BD-Li group only). Discussion:
Our finding of lower white matter myo-Ino/Cr ratios in lithium-treated BD subject compared to BD controls is consistent with the inositol depletion hypothesis. Moore et al.3 reported a reduction in myo-Inositol levels in the frontal lobes of depressed adults with BD after 5 days of lithium treatment. Others have reported that the decrease in myo-Ino/Cr ratio is greatest in those responding to lithium treatment8. Our results are broadly consistent with these findings, as subjects in this study had gained benefit from lithium, taking it long-term and euthymic at the time of investigation. Unlike this study, Forester et al.9 reported a positive correlation between myo-Ino/Cr levels and brain lithium concentration, but the lack of a comparator group makes it difficult to determine whether lithium altered the metabolite levels per se. Future studies investigating whether such correlations are confined to the acute phase of treatment, as a function of response, would be of great interest.Conclusion:
Consistent with the inositol depletion hypothesis and extended into those treated in the long term, we have demonstrated that frontal white matter myo-Ino/Cr ratios are lower in those with BD receiving lithium compared to control BD patients taking other medication. Lithium is unusual in being a psychotropic medication and an element with favourable magnetic resonance properties. Our study demonstrates proton and multinuclear MR techniques can be combined to investigate the effects of this drug on the brain, opening avenues for future research in BD.Acknowledgements
With thanks to radiographers at our Centre and to the Medical Research Council, UK for funding this work.References
1 Berridge, M. J., Downes, C. P. & Hanley, M. R. Neuronal nnddevelopmentalactions of lithium - A unifying hypothesis. Cell 59, 411-419, doi:10.1016/0092-8674(89)90026-3 (1989).
2 Strakowski, S. M., DelBello, M. P., Adler, C., Cecil, D. M. & Sax, K. W. Neuroimaging in bipolar disorder. Bipolar Disord 2, 148-164 (2000).
3 Moore, G. J. et al. Temporal dissociation between lithium-induced changes in frontal lobe myo-inositol and clinical response in manic-depressive illness. American Journal of Psychiatry 156, 1902-1908 (1999).
4 Friedman, S. D. et al. Lithium and valproic acid treatment effects on brain chemistry in bipolar disorder. Biological Psychiatry 56, 340-348, doi:10.1016/j.biopsych.2004.06.012|ISSN 0006-3223 (2004).
5 Ratiney, H. et al. NMR in Biomedicine, Time-domain semi-parametric estimation based on a metabolite basis set. NMR in Biomedicine 18 (2005).
6 Ratiney, H., Coenradie, Y., Cavassila, S., van Ormondt, D. & Graveron-Demilly, D. Time-Domain Quantitation of 1H Short Echo-Time Signals : Background Accomodation. Magnetic Resonance Materials In Physics Biology and Medicine (MAGMA) 16, 284-296 (2004).
7 Schneider, C. A. R., W. S. & Eliceiri, K. W. NIH Image to ImageJ: 25 years of image analysis. Nature methods 9, 671-675 (2012).
8 Davanzo, P. et al. Decreased anterior cingulate myo-inositol/creatine spectroscopy resonance with lithium treatment in children with bipolar disorder. Neuropsychopharmacology 24, 359-369, doi:10.1016/s0893-133x(00)00207-4 (2001).
9 Forester, B. P. et al. Brain lithium, N-acetyl aspartate and myo-inositol levels in older adults with bipolar disorder treated with lithium: a lithium-7 and proton magnetic resonance spectroscopy study. Bipolar Disorders 10, 691-700, doi:10.1111/j.1399-5618.2008.00627.x (2008).
Figures
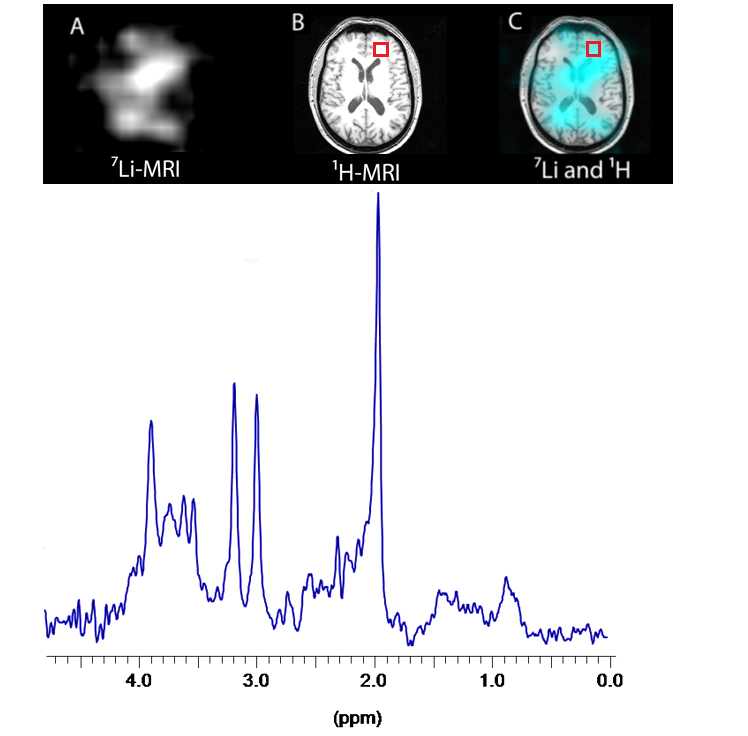
Figure 1: 7Li b-SSFP MRI in one BD-Li subject is shown at the level of the head of the caudate nucleus (A), with corresponding 1H-MRI axial slice (B). The combined image (C) shows 7Li b-SSFP MRI (in cyan) overlaid on 1H-MRI images. 1H-MRS measurements from a localised 8cm3 voxel located in white matter (shown in red on the 1H-MRI axial slice) are shown in the panel below.
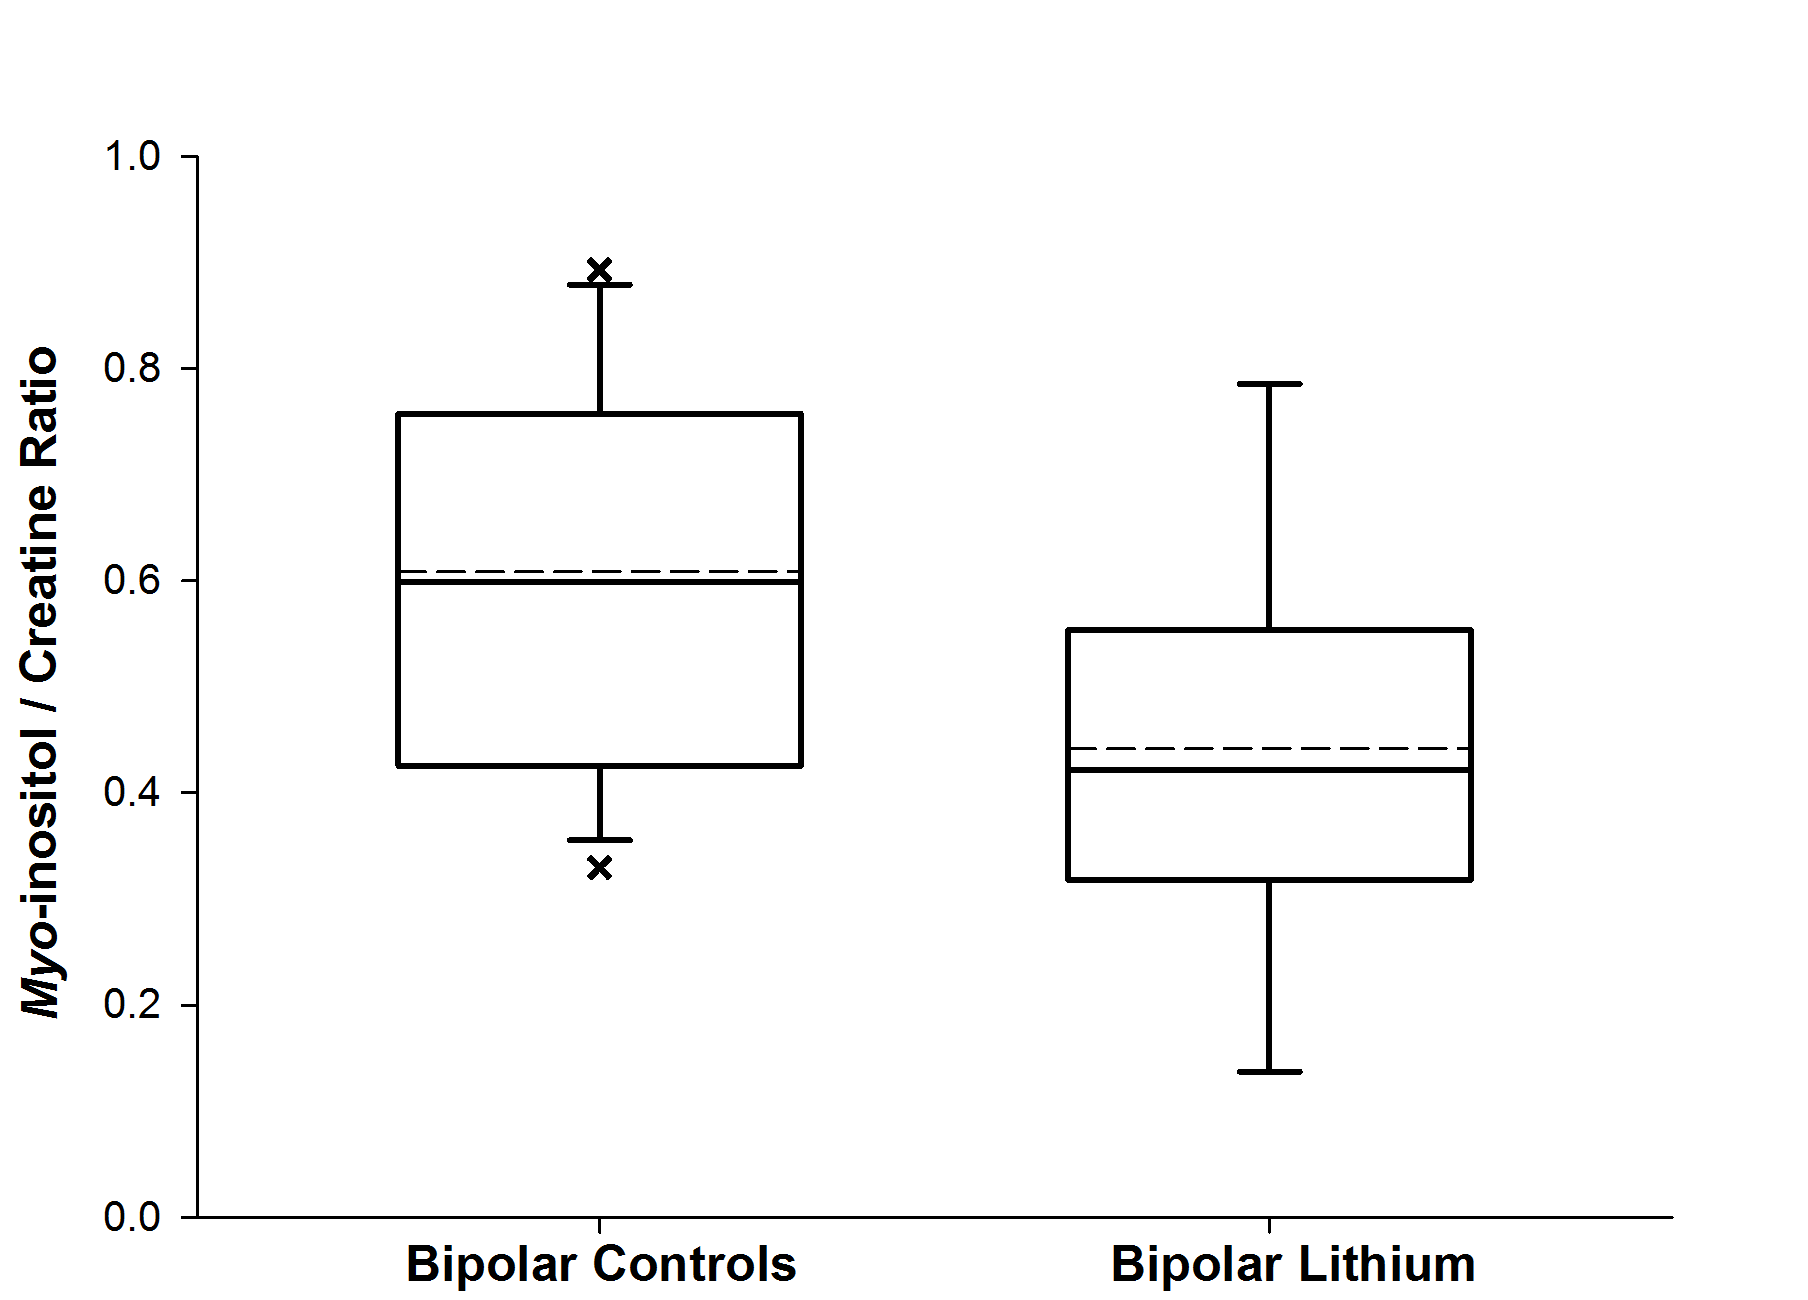
Figure 2: Myo-Ino/Cr ratios in BD-Li patients compared to BD Control subjetcs from an 8cm3 voxel placed in frontal white matter.