3909
Correlations Between Brain Structural Volumes and Brain Metabolite Concentrations in Alzheimer’s Disease: Preliminary Results from the NeuroMet Project1Physikalisch-Technische Bundesanstalt (PTB), Berlin, Germany, 2Department of Neurology, Charité - Universitätsmedizin Berlin, Berlin, Germany, 3Department of Neurology, University Medicine Greifswald, Greifswald, Germany
Synopsis
The NeuroMet project aims to identify new biomarkers for Alzheimer’s disease (AD) and to reduce measurement uncertainties for known biomarkers for AD. This work presents first NeuroMet results with a focus on ultra-high field MR imaging and MR spectroscopy. Significant correlations were found between volumes of cortical and subcortical gray matter structures and concentrations of NAA, glutamate and GABA.
Introduction
While the incidence of Alzheimer’s Disease (AD) worldwide increases1, underlying mechanisms of the disease are still not understood. The ongoing, multidisciplinary European research project NeuroMet2, aims to reduce measurement uncertainties of known AD biomarkers, and to find new biomarkers, that can be measured either non- or minimally invasively, and thus, further the understanding of development and progression of the disease. This work presents preliminary results from NeuroMet with a focus on ultra-high field MR imaging and MR spectroscopy of the brain.Methods
All measurements were performed at a 7T whole body Magnetom MRI system (Siemens Healthineers, Erlangen, Germany) using a 1TX/32RX head coil (NOVA Medical, Wilmington, USA).
Cohort: At the time of writing, a subcohort of 50 subjects (21 healthy controls (HC), 11 mild cognitive impaired (MCI), 18 AD patients, mean age (SD): 71 (7) years) from the NeuroMet cohort have undergone an MRI examination. All participants gave written, informed consent according to local ethics regulations.
Imaging: T1 weighted images were acquired using MP2RAGE3 (TR/TI1/TI2=5000ms/900ms/2700ms; α1/α2=7°/5°; resolution=0.75×0.75×0.75mm3) with a denoised reconstruction4. After image segmentation volumes of different cortical and subcortical structures were calculated using the Hammers5 atlas within CAT126. The individual region of interest (ROI) volumes of individual subjects were then normalized using:
(1) ROInorm=ROIraw–b×(ICV–mean(ICV))7,
where ROInorm and ROIraw denote the normalized ROI volume and the ROI volume, as calculated from CAT12, ICV and mean(ICV) are the intracranial volume of the individual subject and the mean ICV of the cohort, and b is the slope of the regression of the respective ROI volume and the ICV.
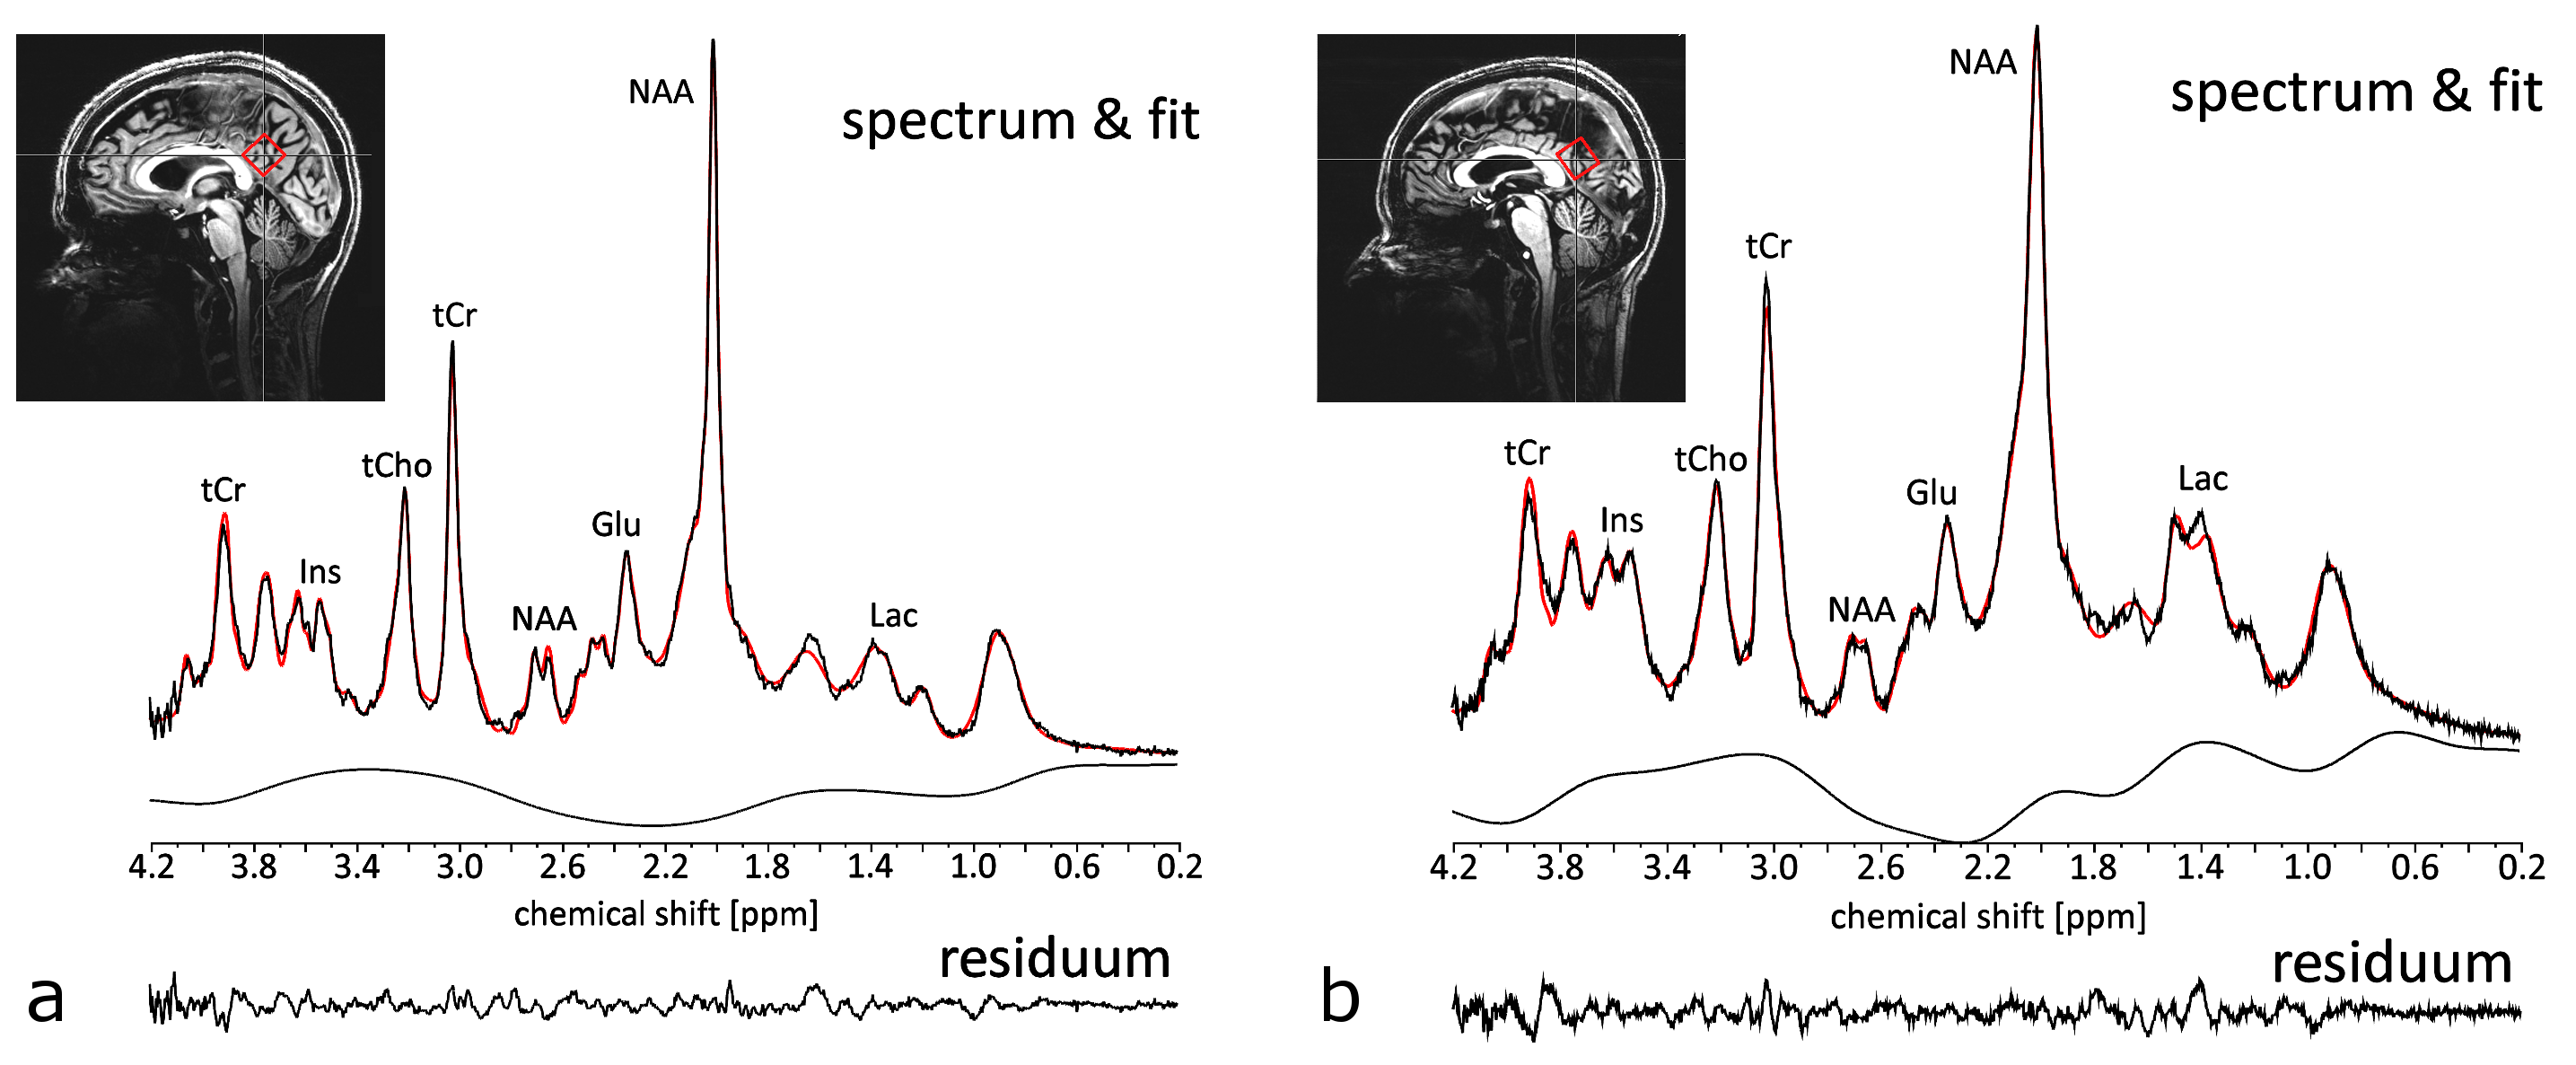
Spectroscopy: The MRS voxel (20×20×20mm3) was positioned in the posterior cingulate cortex (PCC, Fig. 1), and localized RF calibration and 2nd order B0 shimming8 were performed prior to MRS measurements. To achieve high signal intensities and short echo times, a SPECIAL9,10 sequence (TE/TR=9ms/6500ms; 64 averages; VAPOR water suppression) was employed. For reference, a non-water-suppressed spectrum (4 averages) of the same voxel was acquired. Coil combination, frequency correction, and averaging were performed using an in house developed reconstruction algorithm. LCModel11 was employed for quantification. Metabolite concentrations were corrected for CSF fraction within the voxel and relaxation. Metabolite concentrations with Cramer-Rao lower bounds (CRLBs) >20% were excluded from further analysis.
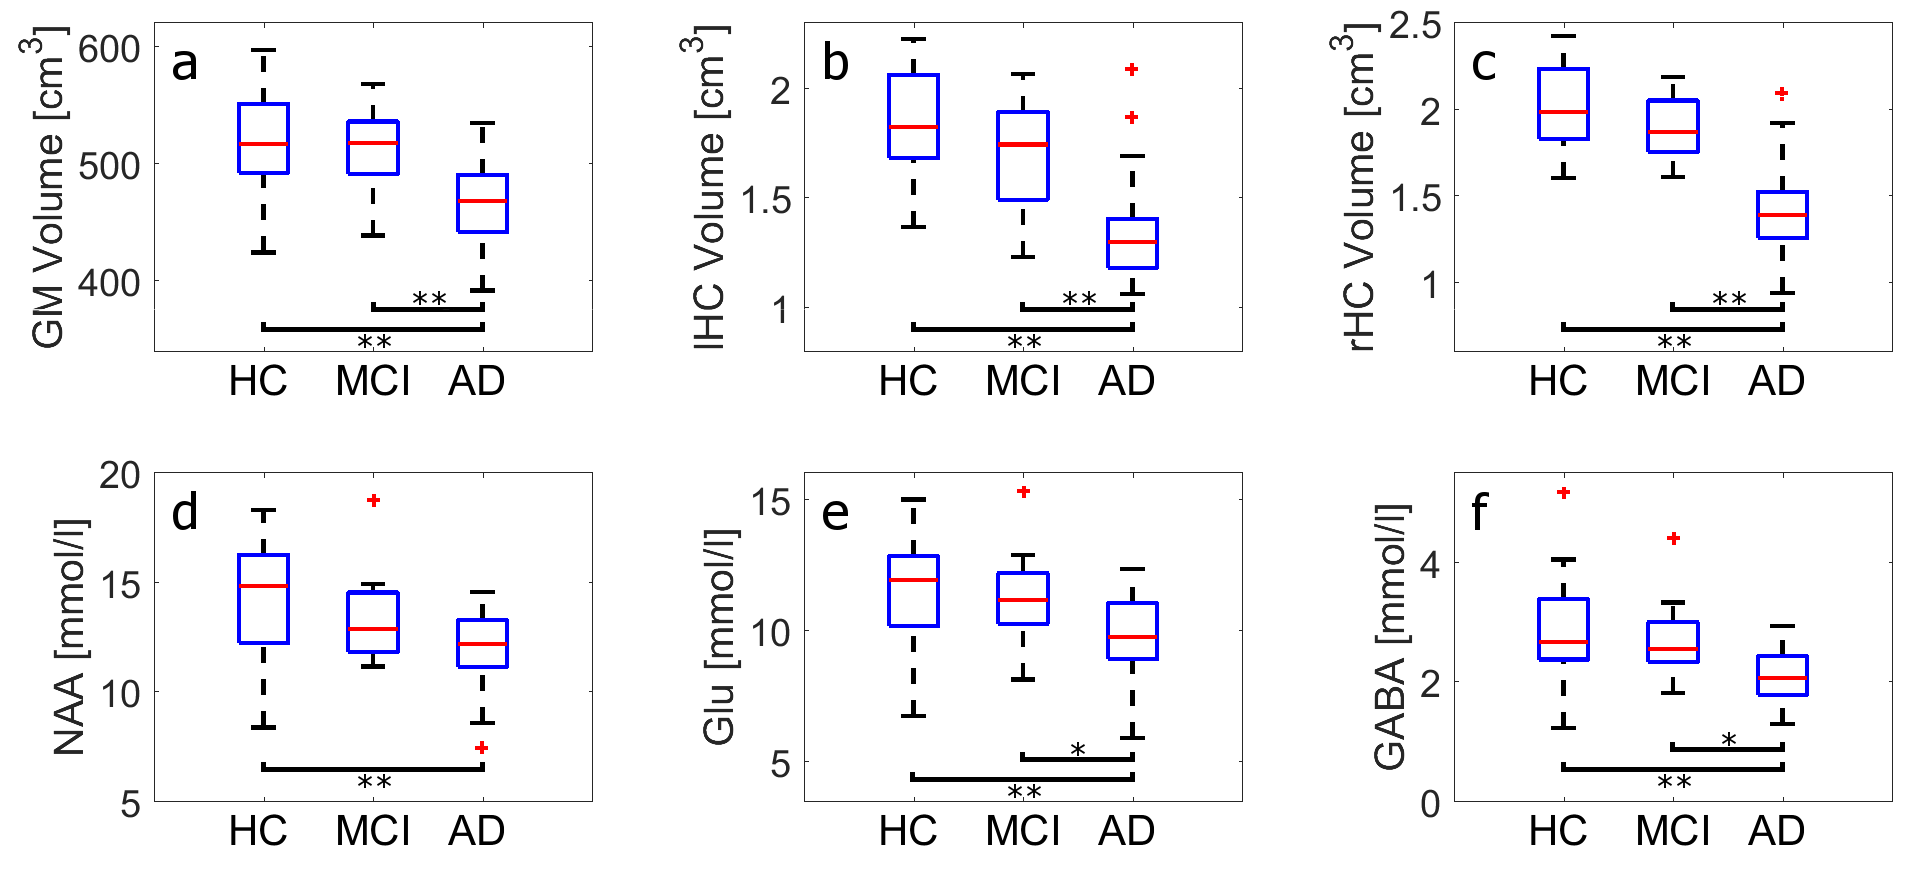
Statistics: The concentrations for N-acetyl-aspartate (NAA), glutamate (Glu), and γ-amino butyric acid (GABA) and the calculated total gray matter volume (GM), as well as the left and right hippocampus volumes (lHC and rHC), were compared between the different groups and unpaired t-tests were performed. Furthermore, Pearson’s correlation coefficients and significance values were determined between the metabolite concentrations and the gray matter volumes.
Results and Discussion
The high spectral quality achieved by SPECIAL and careful RF calibration and B0 shimming, allowed for robust quantification even of less distinctive metabolites, such as Glu or GABA (Fig. 1). In Figure 2 the comparisons between healthy controls (HC), mild cognitive impaired (MCI) subjects, and Alzheimer’s disease (AD) patients are displayed with regard to the GM, lHC, and rHC volumes as well as NAA, Glu, and GABA concentrations. Differences in all these biomarkers are significant between HC and AD, and – with the exception of the NAA concentration – between MCI and AD.
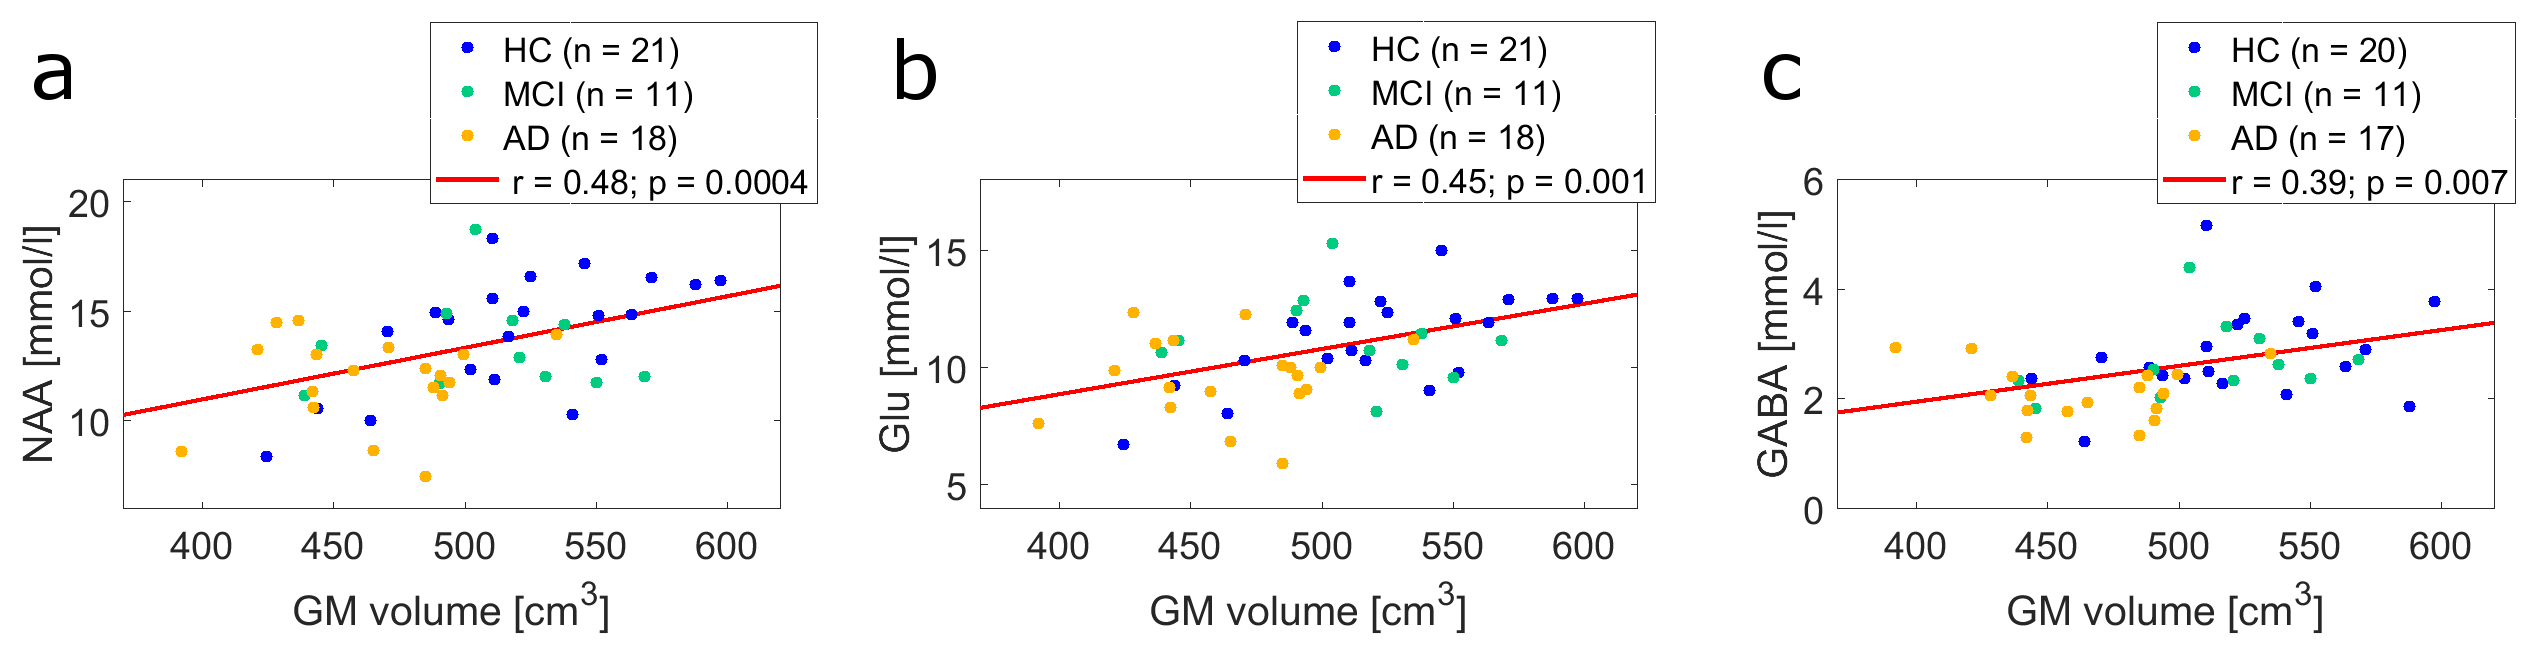
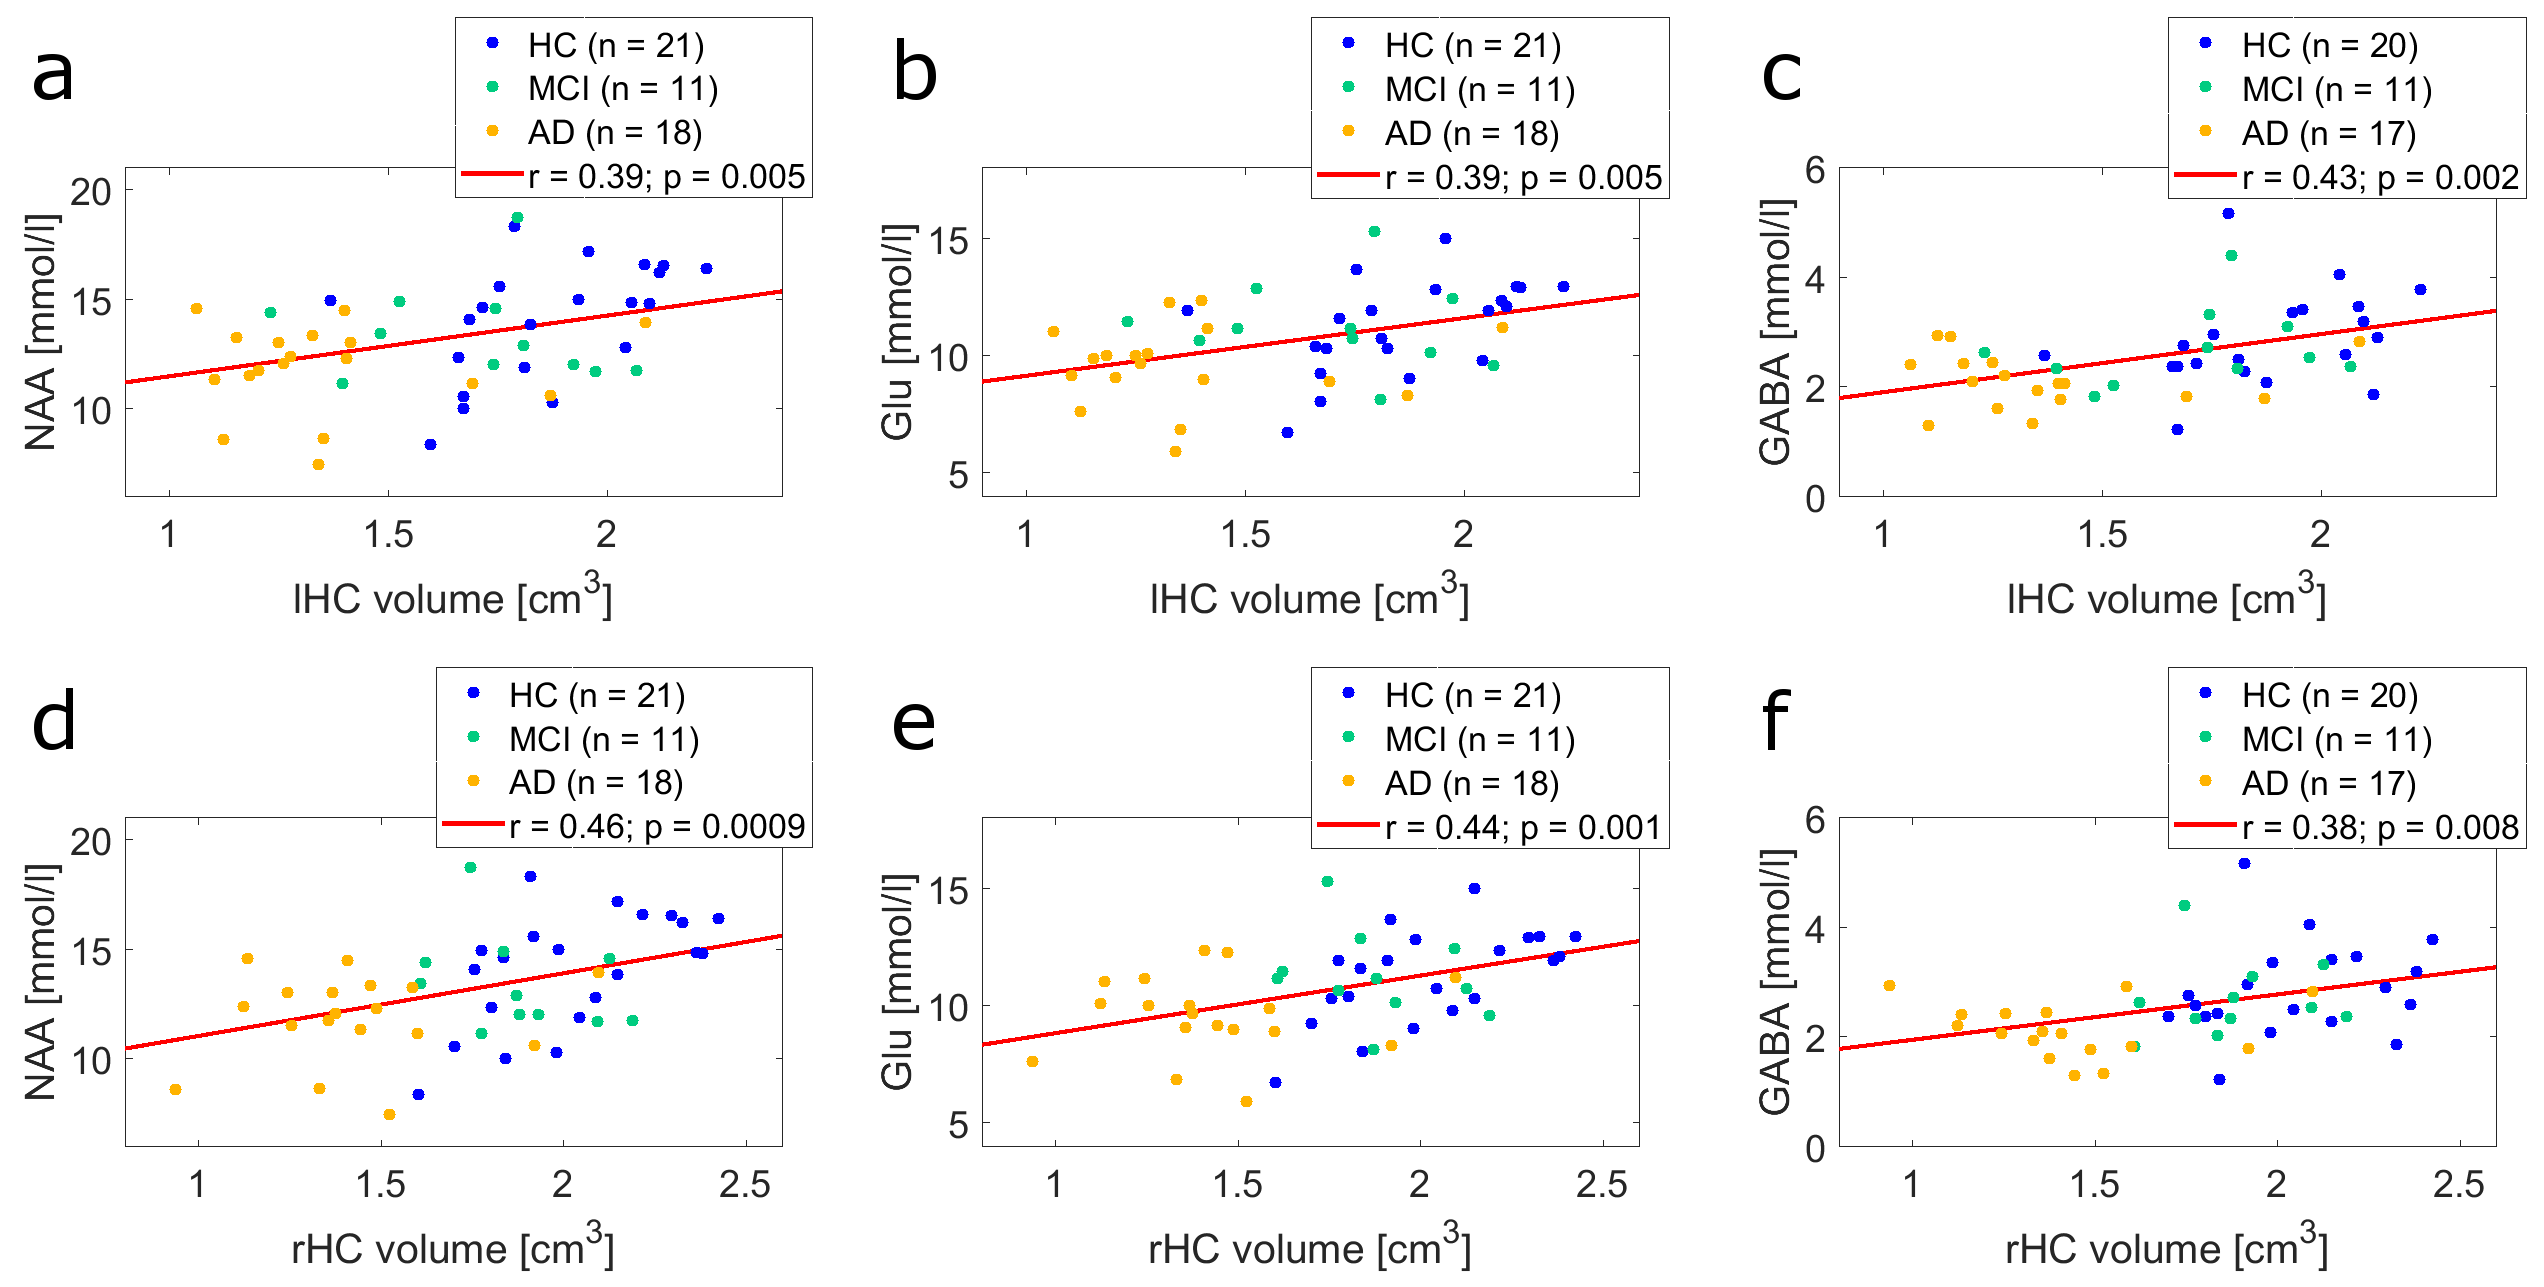
Fig. 3 displays the correlation plots of normalized GM with NAA (a), Glu (b), and GABA (c) concentrations. The corresponding correlations of hippocampus volumes with metabolite concentrations are shown in Fig. 4. Note, that all depicted concentration-volume pairings exhibit a highly significant (p < 0.01) correlation.
Previous work found the progression of Alzheimer’s disease to be associated with volume loss of gray matter cortical and subcortical structures12, and decreased NAA concentrations13 in the PCC. These results are confirmed by the present study. Furthermore, we observe significantly reduced Glu and GABA concentrations in AD patients, which makes them potentially valuable additional biomarkers for AD. Nevertheless, no clear distinction between HC, MCI, and AD can be made, based solely on the metabolite concentrations and gray matter structural volumes. It should be noted, however, that the results presented here are preliminary. NeuroMet is an ongoing study and personal factors, like individual education of subjects and individual age still have to be considered in future analyses.
Conclusion
Highly significant correlations were observed between certain cerebral volumes (GM, lHC, and rHC), and the concentrations of NAA, Glu, and GABA measured in the PCC of an elderly cohort ranging from HC to MCI to AD. These findings indicate that - in addition to NAA concentration and gray matter volumes - concentrations of Glu and GABA might be valuable biomarkers, to better understand and diagnose AD in the future.Acknowledgements
This project has received funding from the EMPIR programme co-financed by the Participating States and from the European Union’s Horizon 2020 research and innovation programme. This paper reflects only the author's view and EURAMET is not responsible for any use that may be made of the information it contains.References
[1] R. Brookmeyer, E. Johnson, K. Ziegler-Graham, H. M. Arrighi. „Forecasting the global burden of Alzheimer’s Disease”. Alzheimers Dement 3:186-191 (2007)
[2] https://www.lgcgroup.com/our-science/national-measurement-laboratory/european-metrology-programme-for-innovation-and-re/neuromet/
[3] J. P. Marques, T. Kober, G. Krueger, W. van der Zwaag, P.-F. Van de Mortele, R. Gruetter. „MP2RAGE, a self bias-field corrected sequence for improved segmentation and T1-mapping at high field“. NeuroImage 49:1271-1281 (2010)
[4] K. R. O’Brien, T. Kober, P. Hagmann, P. Maeder, J. Marques, F. Lazeyras, G. Krueger, A. Roche. „Robust T1-Weighted Structural Brain Imaging and Morphometry at 7T Using MP2RAGE“. PLOS One 9:e99676 (2014)
[5] A. Hammers, R. Allom, M. J. Koepp, S. L. Free, R. Myers, L. Lemieux, T. N. Mitchell, D. J. Brooks, J. S. Duncan. “Three-Dimensional Maximum Probability Atlas of the Human Brain, With Particular Reference to the Temporal Lobe”. Hum Brain Mapp 19:224-247 (2003)
[6] C. Gaser, R. Dahnke. “CAT – A Computational Anatomy Toolbox for the Analysis of Structural MRI Data.” HBM 2016:33-348 (2016)
[7] N. Raz, U. Lindenberger, K. M. Rodrigue, K. M. Kennedy, D. Head, A. Williamson, C. Dahlke, D. Gerstorf, J. D. Acker. „Regional Brain Changes in Aging Healthy Adults: Genderal Trends, Individual Differences and Modifiers“. Cerebral Cortex 15:1676-1689 (2005)
[8] S. Nassirpour, P. Chang, A. Fillmer, A. Henning. “A Comparison of Optimization Algorithms for Localized in Vivo B0 Shimming”. Magn Reson Med DOI 10.1002/mrm.26758 e-pub ahead of print (2017)
[9] V. Mlynarik, G. Gambarota, H. Frenkel, R. Gruetter. “Localized Short-Echo-Time Proton MR Spectroscopy With Full Signal-Intensity Acquisition”. Magn Reson Med 56:956-970 (2006)
[10] R. Mekle, V. Mlynarik, G. Gambarota, M. Hergt, G. Krueger, R. Gruetter. “MR Spectroscopy of the Human Brain With Enhanced Signal Intensity at Ultrashort Echo Times on a Clinical Platform at 3T and 7T”. Magn Reson Med 61:1279-1285 (2009)
[11] S. W. Provencher. “Estimation of metabolite concentrations from localized in vivo proton NMR spectra”. Magn Reson Med 30:672-679 (2993)
[12] G. B. Karas, P. Scheltens, S. A. R. B. Rombouts, P. J. Visser, R. A. van Schijndel, N. C. Fox, F. Barkhof. „Global and local gray matter loss in mild cognitive impairment and Alzheimer’s disease“. NeuroImage 23:708-716 (2004)
[13] H. Wang, L. Tan, H.-F. Wang, Y. Liu, R.-H. Yin, W.-Y. Wang, X.-L. Chang, T. Jiang, J.-T. Yu. „Magnetic Resonance Spectroscopy in Alzheimer’s Disease: Systematic Review and Meta-Analysis”. J Alzheimers Disease 46:1049-1070 (2015)
Figures