3908
Neurochemical profiling in the rat model of Tourette’s Syndrome @ 11.7T1Core Facility Small Animal Imaging, Ulm University, Ulm, Germany, 2Institute of Anatomy and Cell Biology, Ulm University, Ulm, Germany, 3Department of Child and Adolescent Psychiatry, Ulm University, Ulm, Germany, 4Center for Magnetic Resonance Research, University of Minnesota, Minneapolis, MN, United States
Synopsis
Tourette’s syndrome (TS) is a neurodevelopmental disorder characterized primarily by motor tics probably due to dysfunctions of the cortico-striato-thalamic-cortical loop (CSTC) but the underlying molecular reason why tic occur is not yet known. In this study, a dedicated optimized STEAM sequence with single-shot phase and frequency correction, and image-based shimming was applied to uncover the metabolic “signature” of a tic using in vivo 1H-MRS at 11.7T. Despite a clear ticking phenotype observed in our animal model, the unaltered striatal neurochemical profile suggest questions on the role of the striatum within the supposed dysfunctional cortical-striatal-thalamic-cortico circuitry in TS.
PURPOSE
Tourette’s syndrome (TS) is a neurodevelopmental disorder characterized primarily by motor tics (1) probably due to dysfunctions of the cortico-striato-thalamic-cortical loop (CSTC) but the underlying molecular reason why tic occur is not yet known.(2) In this study, a dedicated optimized STEAM sequence with single-shot phase and frequency correction, and image-based shimming was applied to detect subtle changes in the metabolites concentration within the striatal region in order to uncover the metabolic “signature” of a tic using in vivo proton magnetic resonance spectroscopy (1H-MRS) at 11.7T.METHODS
In our animal model forelimb tics are evoked by the unilateral intrastriatal injection of bicuculline, a GABAA antagonist at young age. Spontaneously hypertensive rats (SHR) underwent cannula implantation at postnatal day 28 and bicuculline injection at postnatal 42 (n=4). Control groups are sham injected with saline (n=6). A home-built head restrainer was used to properly immobilize the animal's skull during measurements, ensuring stability and reproducibility of the experimental setup. Experiments were performed at a dedicated small animal system (117/16 USR BioSpec, AVANCE III, ParaVision 6.01, Bruker BioSpin, Ettlingen, Germany) equipped with a 9 cm inner diameter self-shielded gradient coil insert providing 750 mT/m maximal strength in 80 μs rise time. A 72 mm birdcage quadrature volume resonator was used for excitation and a receive-only rat brain 2x2 element surface coil array was used for signal reception. Volume- of-interests (VOI) were planned based on T1-weighted 2D FLASH (TR/TE = 193/5ms, flip angle 17.5°) images. Field homogeneity was adjusted individually for each investigated region using a field-map based approach (MAPSHIM). A short-echo-time STEAM spectroscopy sequence (TR/TE/TM: 5000/3.5/10ms, 256 acquisitions) combined with VAPOR water suppression was used (3,4). In vivo 1H MR spectra were acquired from 9.2μl striatum volume in the contralateral side to the injection side on PND 42. Single-shot data were frequency and phase corrected prior to summation (5). Unsuppressed water signal was used as an internal reference as well as for eddy current correction and absolute metabolite concentrations were derived with LCModel (chemical shift range of 0.5–4.2 ppm) (6). Statistical significance of the differences was analyzed with the non-parametric Mann–Whitney U-test.RESULTS and DISCUSSION
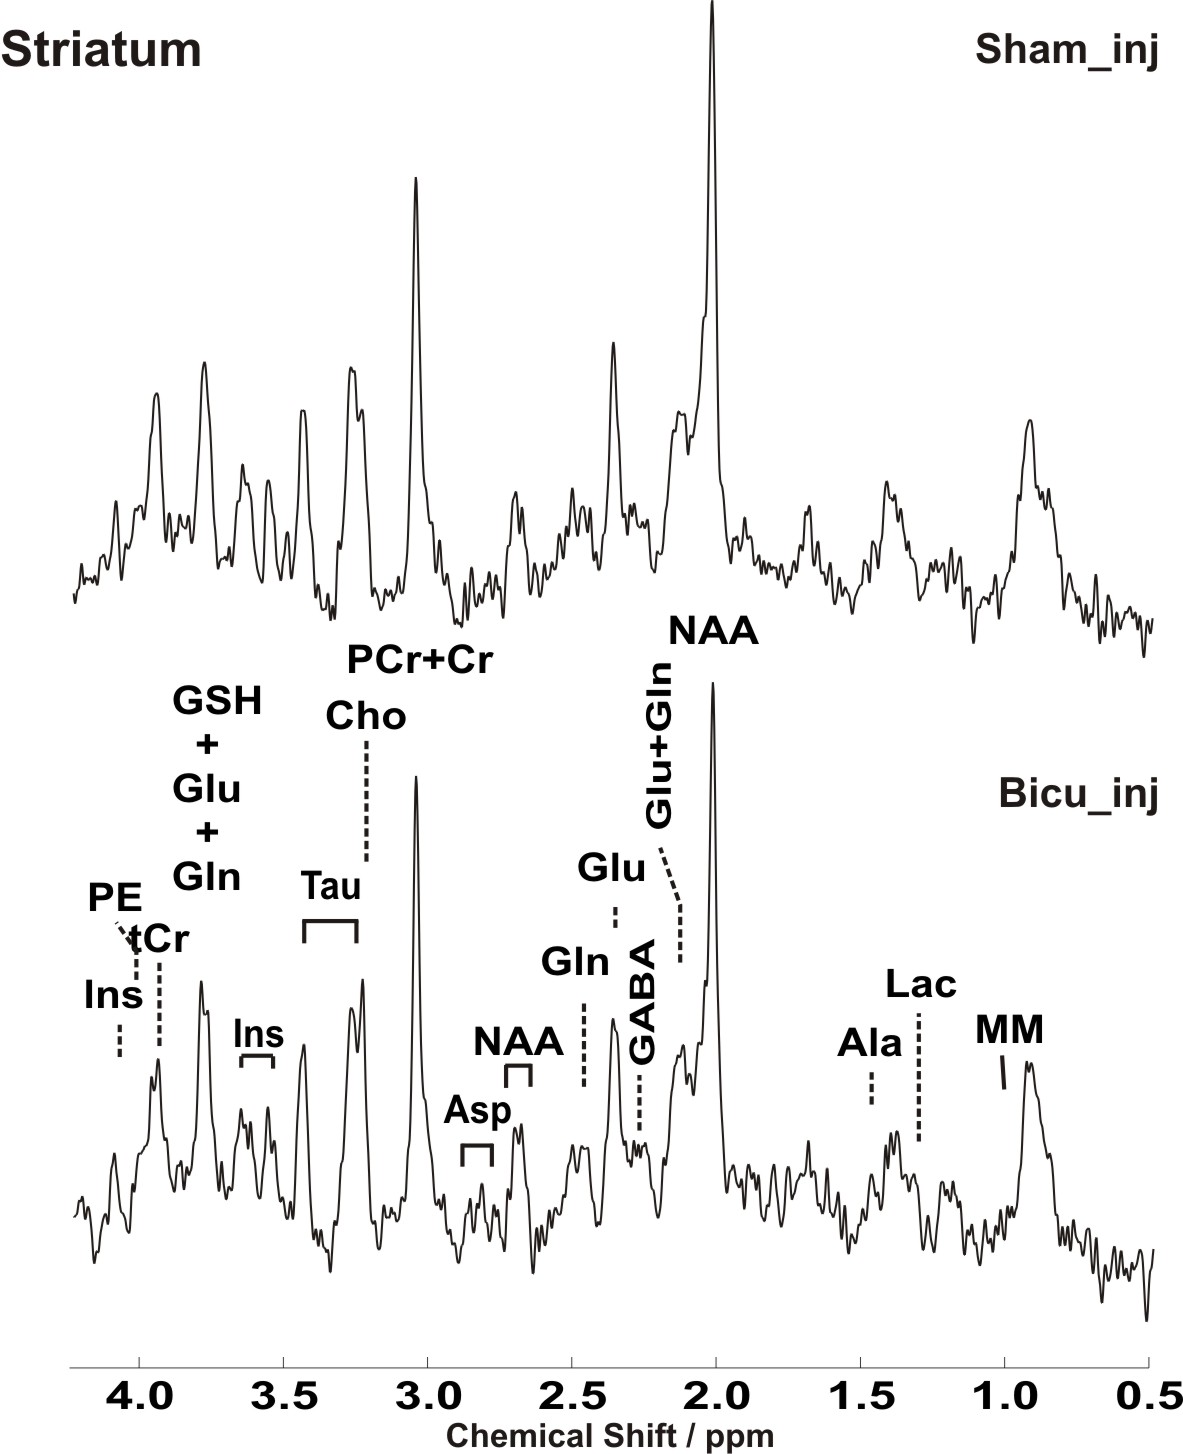
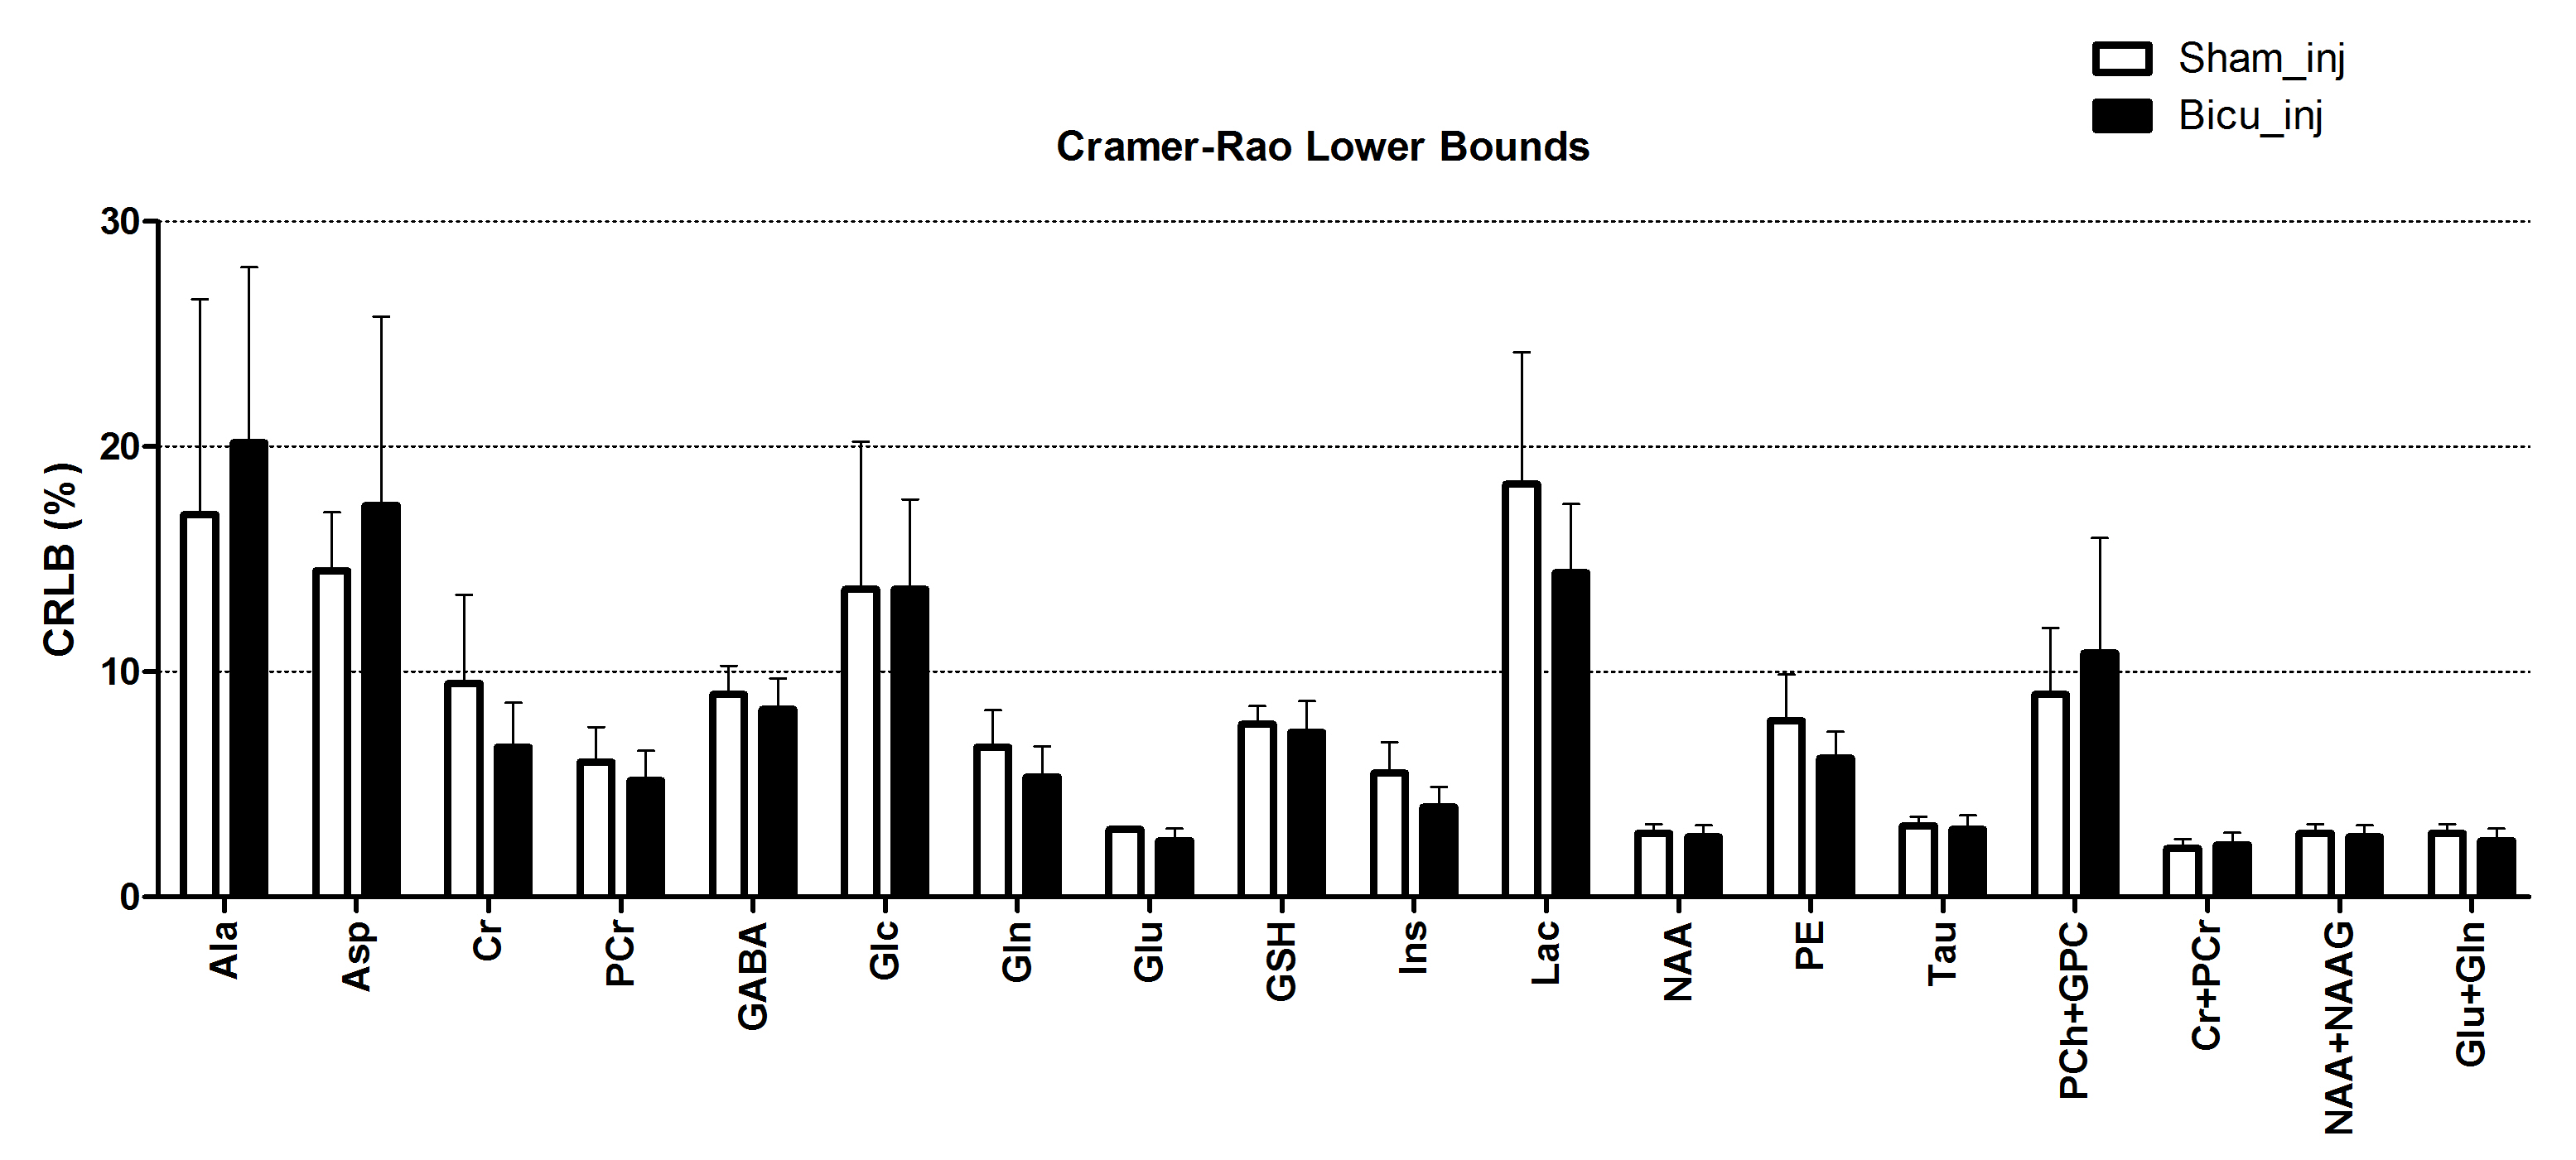
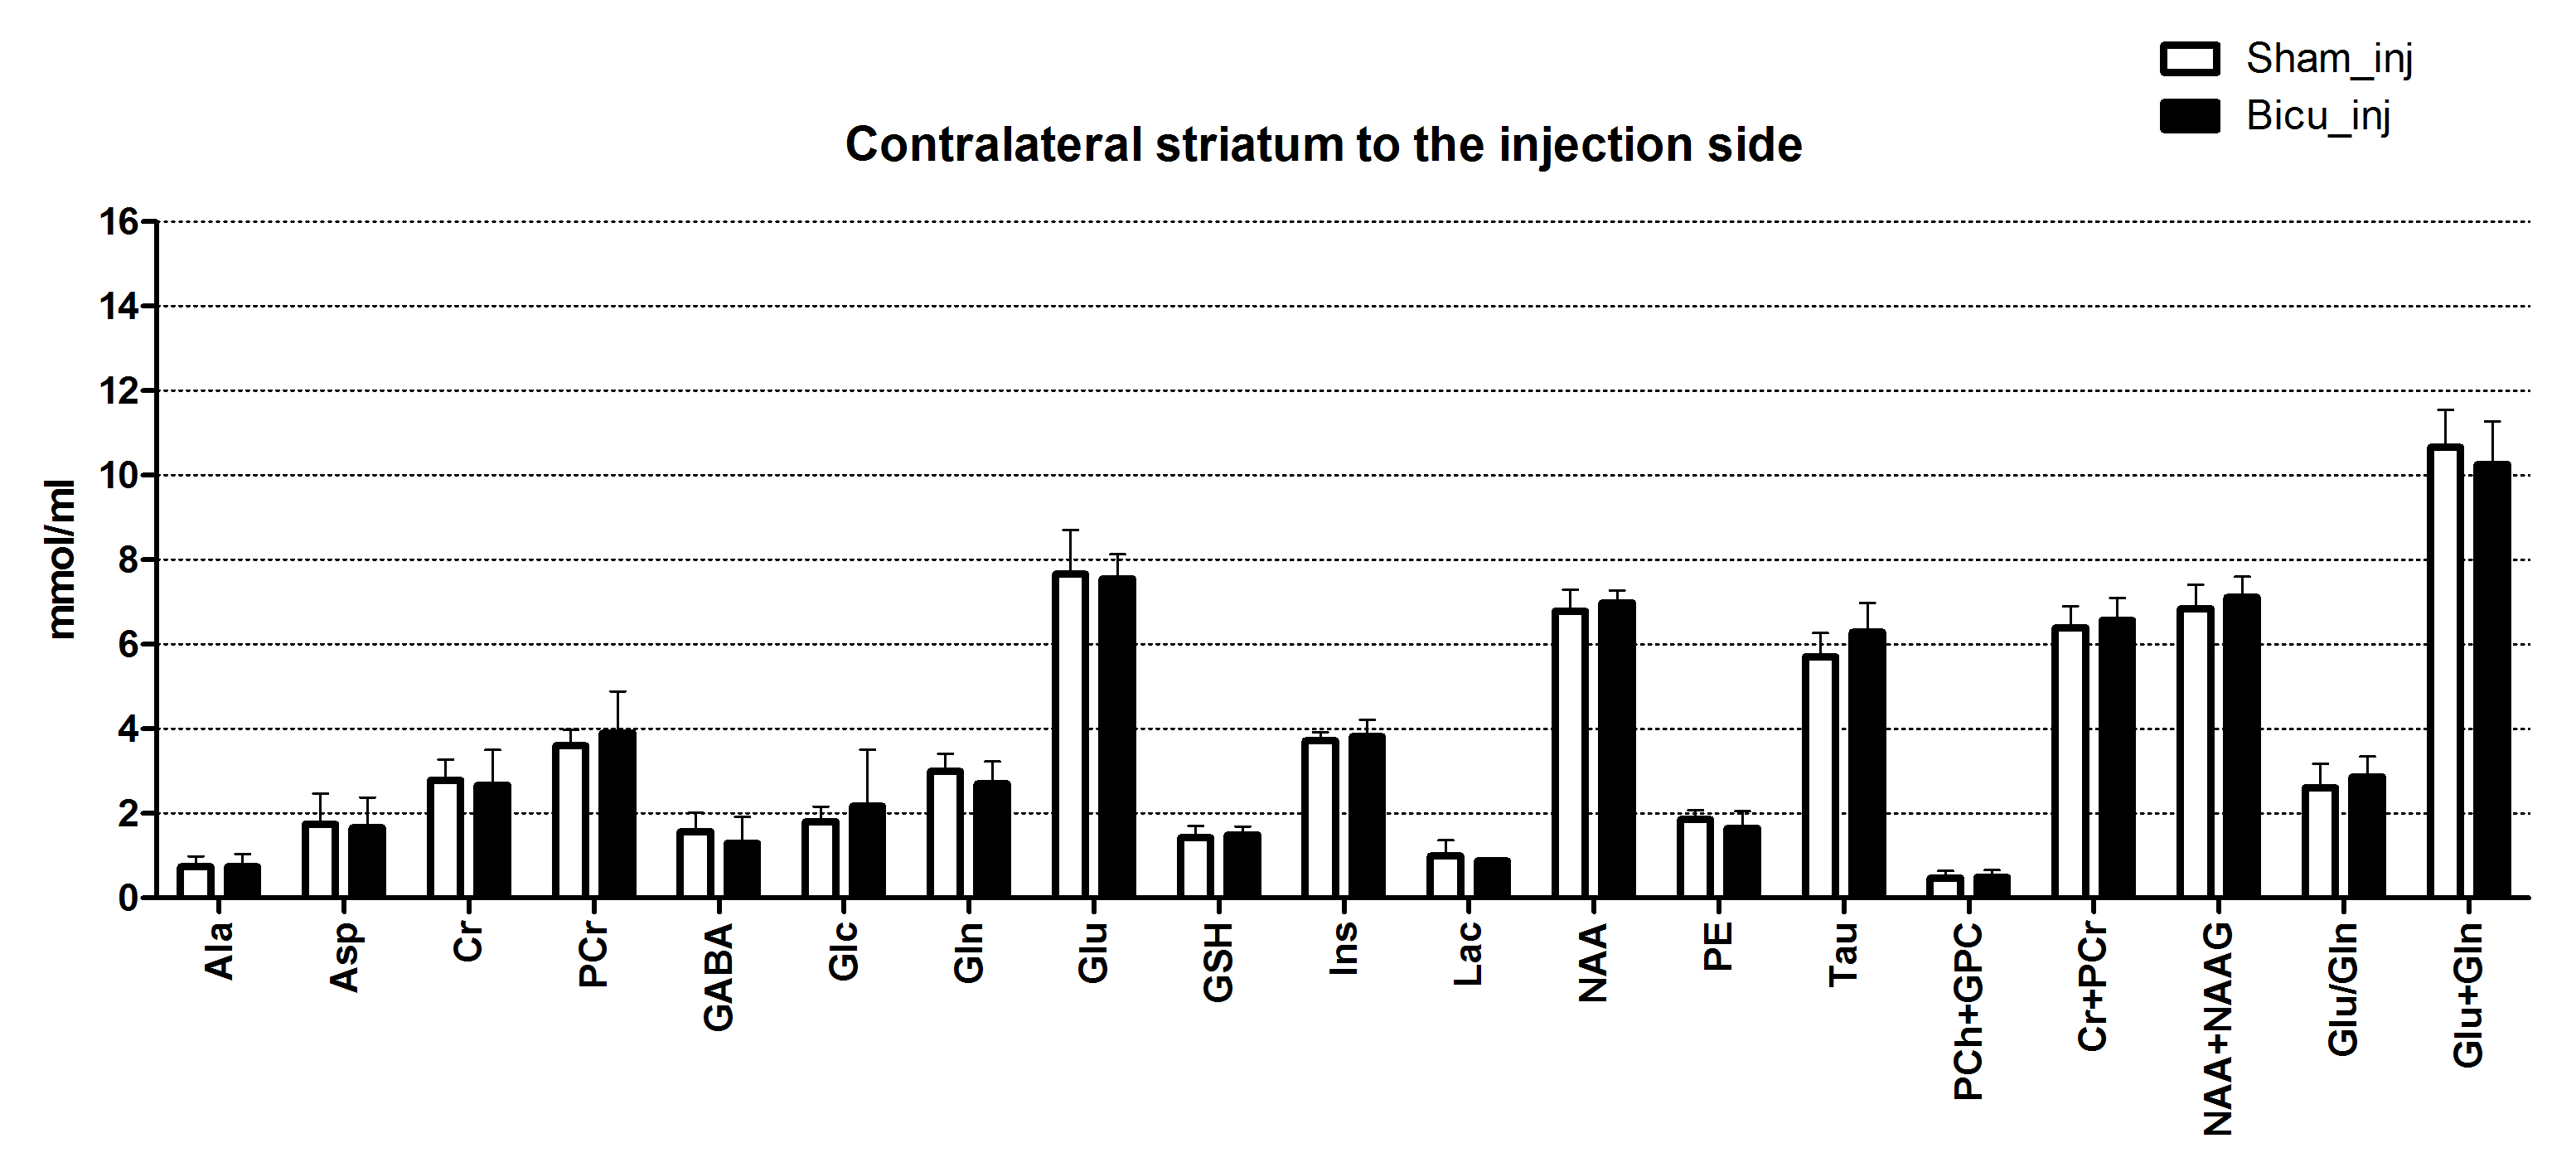
Here we present a selection of the dataset shown in our recent work (submitted) focusing on the neurochemical profile of the striatal region of juvenile rats after injection with either bicuculline or saline. Representative water-suppressed in vivo proton MR spectra of the investigated rat brain region clearly show the well-resolved resonances of numerous cerebral metabolites signals (Fig. 1), obtained with sufficiently consistent spectral quality. The average full width at half-maximum found by LCModel was 0.026 ± 0.002 ppm (13.0 ± 1.0 Hz) in the striatum. Corresponding SNR were 14.6 ± 3. The average Cramer-Rao lower bounds (CRLB) corresponding to the fitted metabolites are shown in Fig. 2. The low average CRLBs of 8, 3 and 6 for GABA, Glu and Gln in the striatum, proves the reliability of the quantification of the metabolites of the glutamatergic and GABAergic neurotransmission systems. The high spectral quality achieved over the entire chemical shift range (0.5–4.2 ppm) ensured reliable and reproducible quantification of each of the brain metabolites. A significant difference between the bicuculline injected young rodent model and sham injected (control) groups has not been observed for any MRS detectable metabolite in the striatum (Fig. 3). Despite of the fact that scyllo-Ins and N-acetylaspartylglutamate (NAAG) signal were incorporated into the basis set of LCModel as a model component, corresponding concentration was not reliably possible.CONCLUSION
Despite a clear ticking phenotype observed in our animal model, the unaltered striatal neurochemical profile suggest questions on the role of the striatum within the supposed dysfunctional cortical-striatal-thalamic-cortico circuitry in TS. An optimized short TE STEAM sequences in combination with advanced single-shot frequency and phase correction, and image-based shimming enables the quantification of brain metabolites with high spectral fidelity and reproducibility, demonstrating neurochemical profile of the bicuculline injected animals in comparison to sham injected animals at very high magnetic field (11.7 T).Acknowledgements
References
1 5th ed.; DSM–5; American Psychiatric Association [APA], 2013
2 Mink JW. Basal ganglia dysfunction in Tourette’s syndrome: a new hypothesis. Pediatr Neurol [Internet]. 2001 Sep [cited 2017 Sep 4];25(3):190–8.
3 Tkac I, Starcuk Z, Choi IY, Gruetter R. In vivo 1H NMR spectroscopy of rat brain at 1 ms echo time. Magn Reson Med (1999) 41:649.
4 Abaei A, Rizzo F, Deelchand D, Subgang A, Schneider J, Ludolph A, Rasche V. Region-specific Neurochemical profile differences in juvenile rat model for ADHD and control strain: a 1H MRS study @ 11.7T. In: Proc 24th Scientific Meeting ISMRM; 2016:2407.
5 http://www.cmrr.umn.edu/downloads/mrspa
6 Provencher, Automatic quantitation of localized in vivo 1H spectra with LCModel. NMR Biomed (2001) 14:260.
Figures