3907
Metabolic basis of (de)activation fMRI paradigms: J-edited lactate and diffusion-weighted water 1H-MRS1MRRC, Yale University, New Haven, CT, United States, 2Department of Clinical Neurophysiology, Rigshospitalet, University of Copenhagen, Copenhagen, Denmark, 3Institute of Neuroscience, University of Louvain, Brussels, Belgium
Synopsis
During task-based versus rest epochs, the BOLD signal increases in a task-positive region (activation paradigm) and decreases in a task-negative region (deactivation paradigm), also known as the default mode network (DMN). We investigated the metabolic basis of (de)activation paradigms using concurrent 1H-MRS acquisitions of J-edited lactate and diffusion-weighted water. Using (de)activation paradigms, we detected associated increase of water (i.e., BOLD signal) and lactate in visual cortex (non-DMN area), whereas in posterior cingulate cortex (DMN area) water decreased but lactate did not change. These results suggest similar degrees of aerobic glycolysis in both DMN and non-DMN areas.
Introduction
In task-based functional MRI (fMRI) studies, a task-positive region is where the BOLD signal is greater during experimental versus rest epochs, and a task-negative region is where the BOLD signal is greater during rest versus experimental epochs. The task-negative region is also referred to as the default mode network (DMN). Functional MRS (fMRS) using short TE non-edited 1H-MRS protocols, has reproducibly detected lactate increase during sensory-induced activations1-3 and evoked modulations of the BOLD signal4-6. Here we investigated the metabolic basis of (de)activation paradigms in non-DMN and DMN areas using 1H-MRS acquisitions at 4T of J-edited lactate and diffusion-weighted water (i.e., BOLD signal).Methods
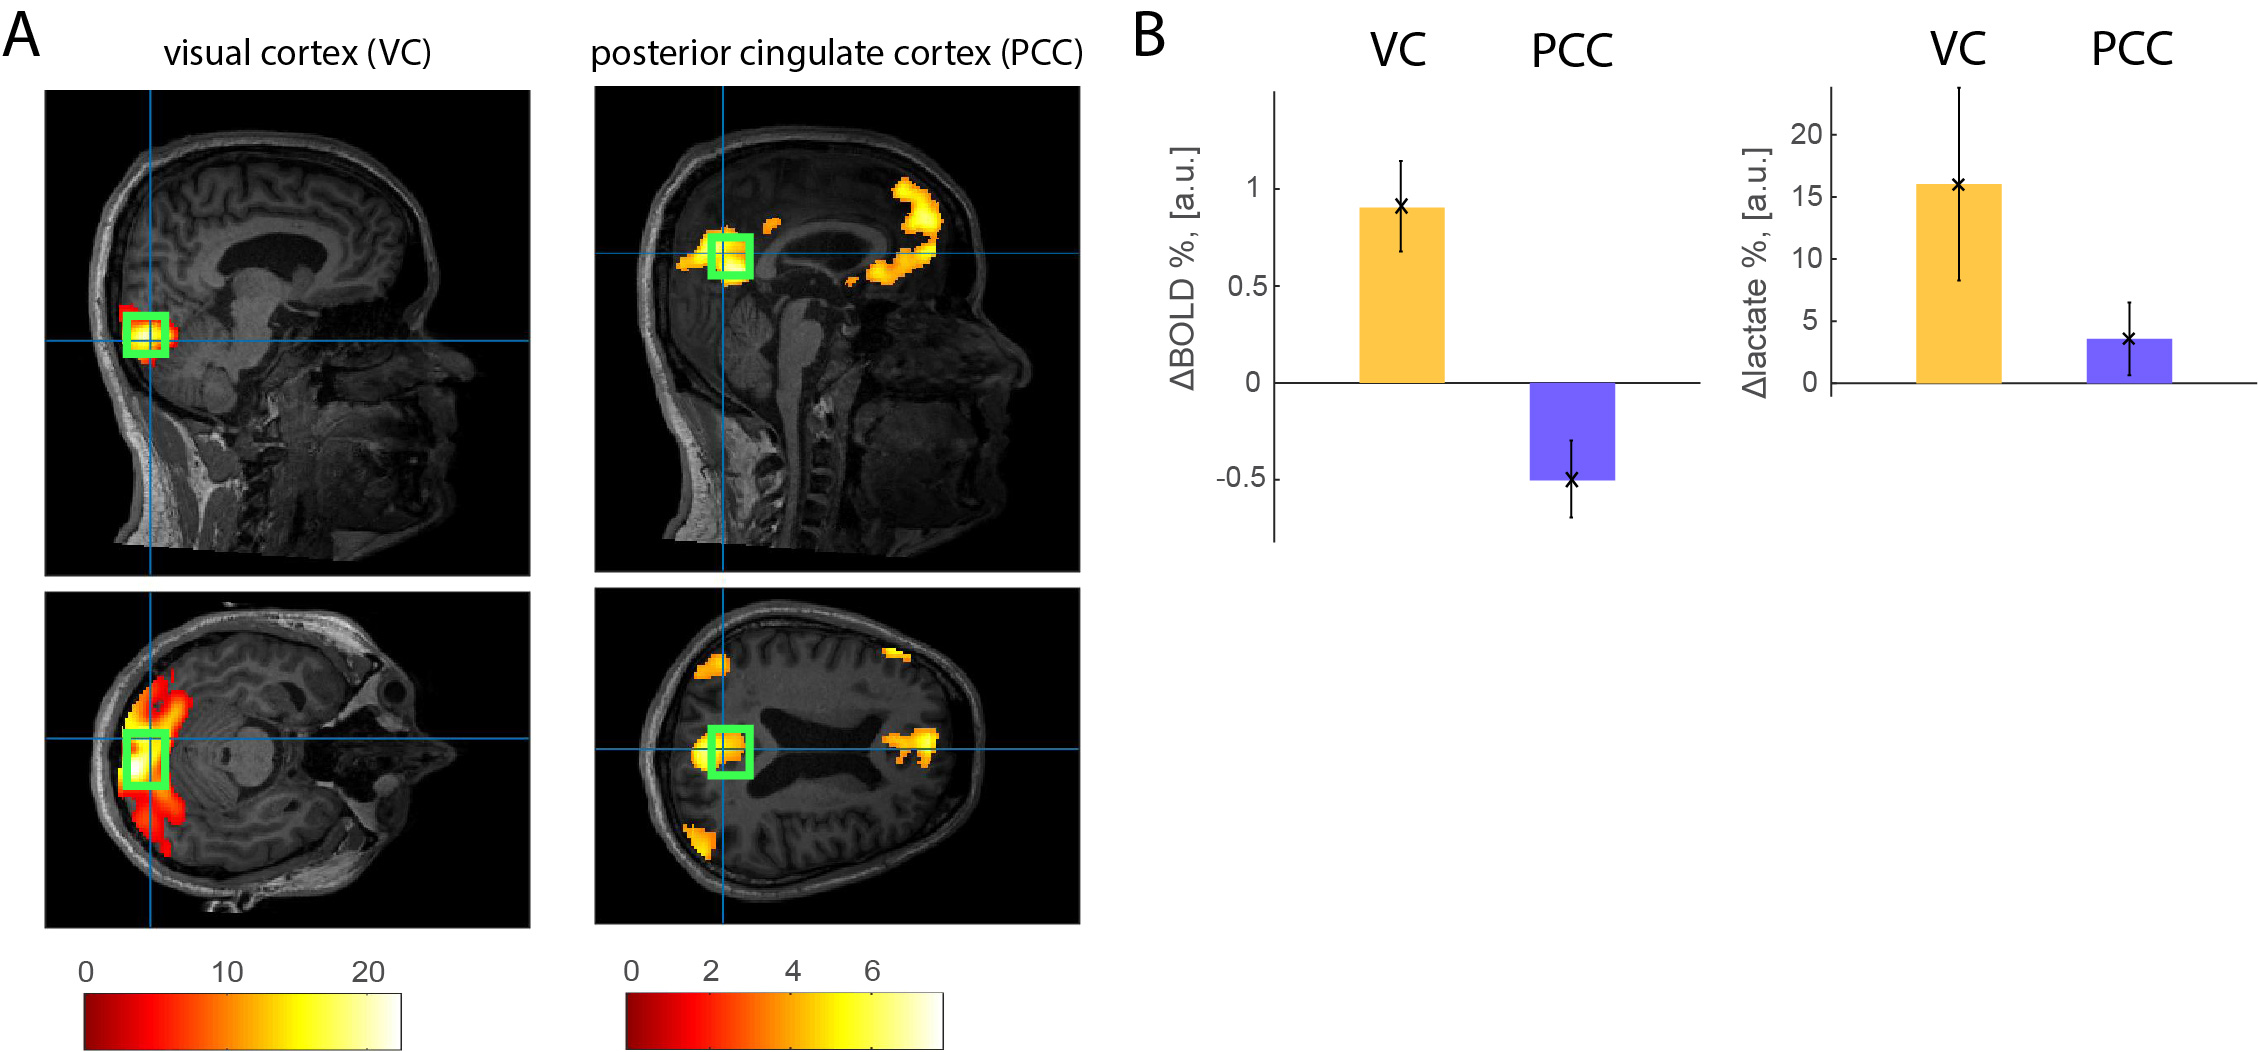
Ten healthy volunteers (8 male, age 30.5±3.0) participated in two fMRI runs and two fMRS runs spanning over three days. First, we used fMRI at 3T to localize the visual cortex (VC, non-DMN area) and the posterior cingulate cortex (PCC, DMN area), using activation (visual flashing checkerboard) and deactivation (auditory emotion perception) paradigms, respectively. The fMRI and fMRS runs consisted of three 2.7 min VC (or PCC) stimulation epochs interleaved with three 2.7 min fixation (or rest) epochs, respectively (16.2 min in total). For VC activation paradigm, the whole-screen flashing (8 Hz) checkerboard was used as visual stimuli (visual angle 15×18°). Subjects were asked to fixate a grey dot in the center of the screen and press a response button when the dot’s color changed to green7. For PCC deactivation paradigm, participants listened to short sentences audio-emotion portrayals8 with eyes closed, and they were asked to press the response button each time a specific emotion, contempt, disgust or surprise, was identified, which occurred 3-5 times per activation epoch. Bilateral VC and PCC (de)activations were identified using statistical parametric mapping (SPM12). A single fMRS voxel was placed around the identified VC and PCC areas. All experiments were performed at the MRRC (Yale University) on a 3T Siemens Prisma scanner using 64-channels head coil and 4T Bruker spectrometer using single-channel quadrature surface head coil. For fMRI, we used single-shot gradient-echo T2*-weighted EPI (648 scans, TR = 1.5 s, TE = 30 ms, voxel size = 2×2×2 mm). For fMRS we used J-difference editing (180 paired spectra, TR = 2.7s, TE = 144ms, VC voxel size = 40.9±3.8×22.9±0.6×22.5±0.7 mm, PCC voxel size = 34.6±0.7×28.0±1.0×28.4±0.8 mm). Each pair of the water-suppressed J-edited spectra was followed by the diffusion-weighted STEAM9 water spectra acquisition (TE = 20 ms, b = 1400 s/mm2) with 200ms delay between the two MRS acquisitions (to minimize residual eddy current effects, etc). Prior to fMRS acquisitions, we acquired B0 field map and water spectrum, adjusted basic frequency and shimming globally and locally, and optimized RF power. J-edited spectra were corrected for a basic frequency drift, aligned, phase-corrected, apodized (gaussian 2 Hz, exponential 2 Hz) and averaged to 30 pairs. Individual spectra were centered and aligned to the group average reference NAA peak. The residual BOLD linewidth narrowing was estimated using line-shape differences in NAA peak between the (de)activation and rest and nulled using exponential linewidth adjustment. The same corrections were applied to the lactate spectra. Lactate integrals were estimated using LCM quantification. The integrals of the modelled lactate (1.32±0.15 ppm), were normalized to the corresponding NAA integrals (2.01±0.15 ppm). STEAM water spectra underwent the same spectra preprocessing procedure. To estimate the T2*, we applied water peak linewidth linear approximation using logarithm of the water FID4-6.Results
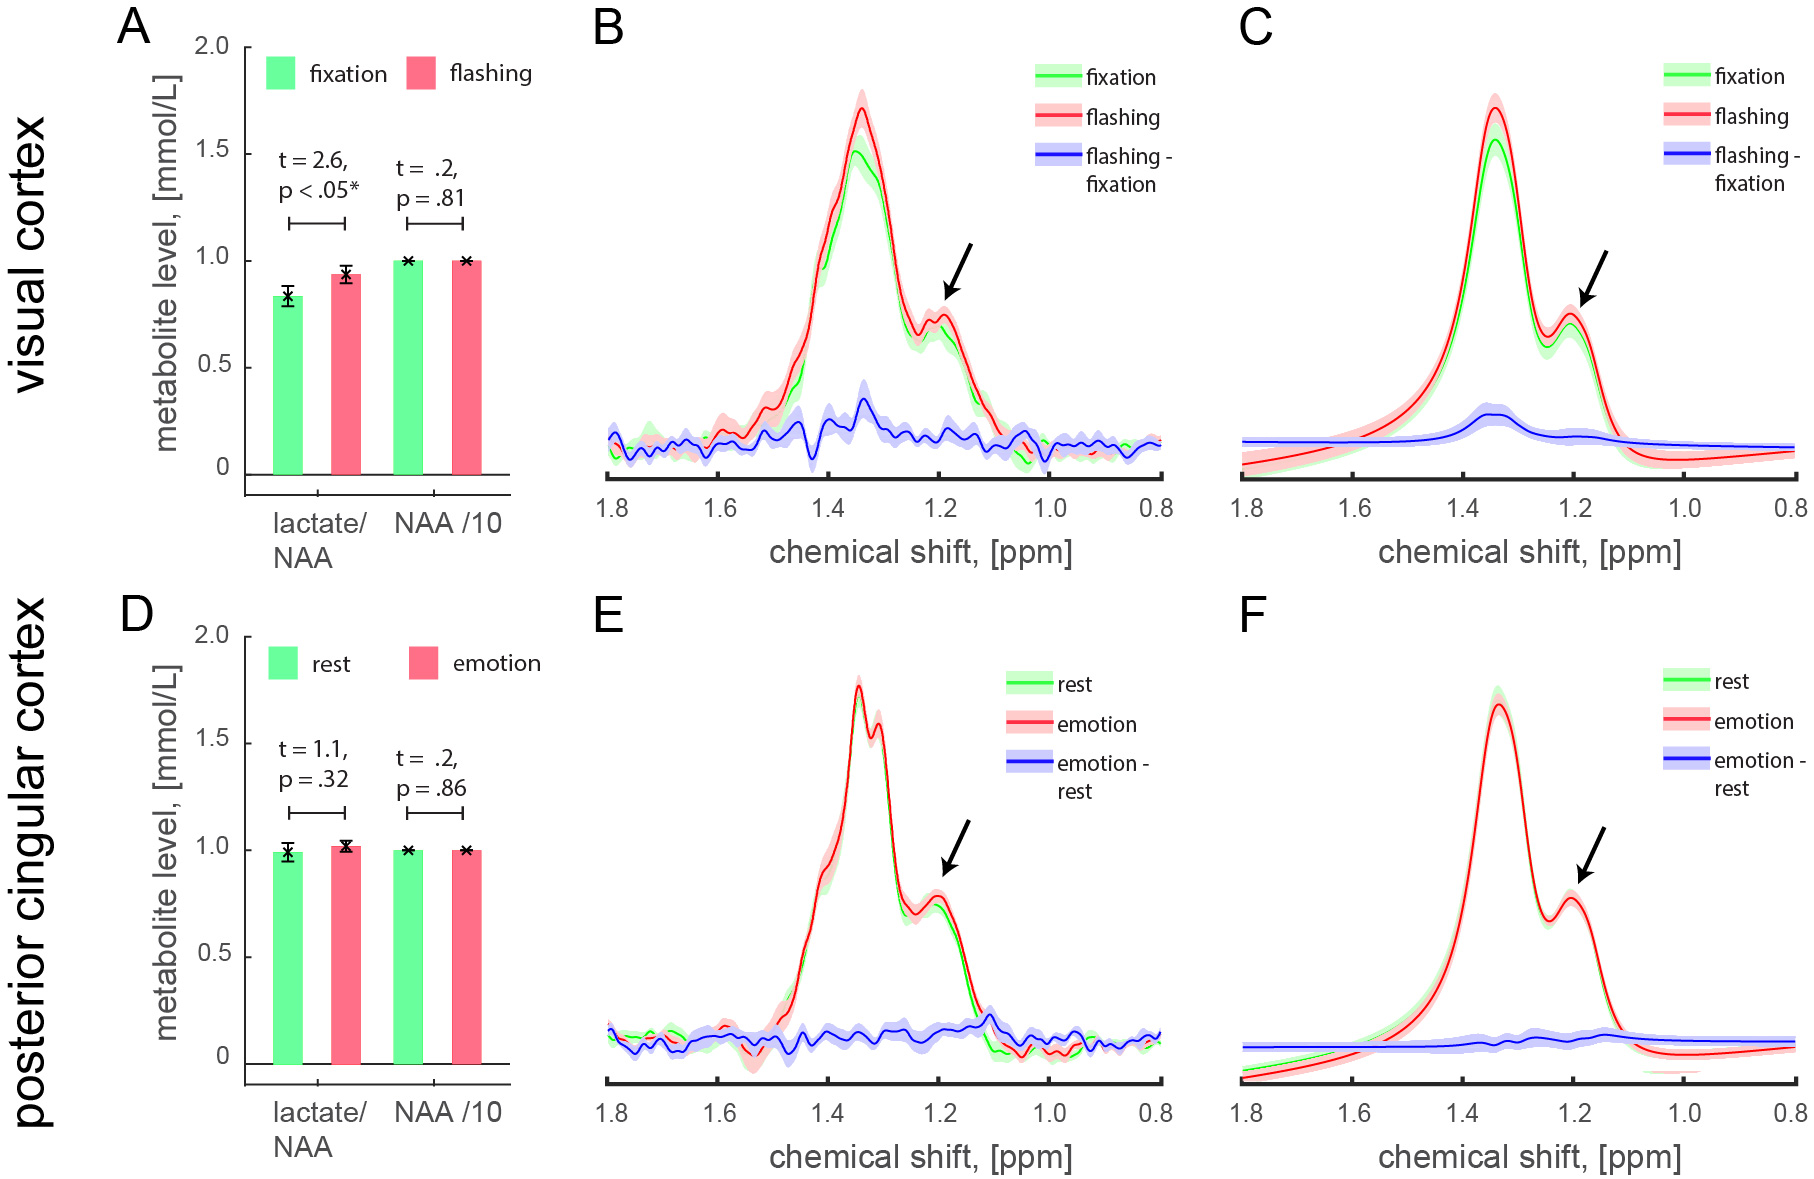
In VC, we found a significant diffusion-weighted water (i.e., BOLD signal) increase during visual stimulation as compared to fixation (Fig. 1, t = 4.5, p < 0.01, ΔBOLD% = 0.9±0.2%), which was associated with significantly increased lactate levels (Fig. 2A-C, t = 2.6, p < 0.05, Δlactate% = 16.0±7.8%). In PCC, we found a significant diffusion-weighted water (i.e., BOLD signal) decrease during auditory emotional stimulation as compared to rest (Fig 1, t = 2.2, p = 0.05, ΔBOLD% = -0.5±0.2%), but no lactate changes (Fig. 2D-F, t = 1.1, p = 0.32, Δlactate% = 3.6±2.9%). It should be noted that the ΔBOLD% from diffusion-weighted 1H-MRS is somewhat smaller due to the partial volume effect and diffusion weighted acquisition to suppress the signal from large vessels10,11.Discussion and Conclusion
In VC (non-DMN area, activation) we detected increase of BOLD signal and lactate. In PCC (DMN area, deactivation) we identified decrease of BOLD signal but no change in lactate. Notably, visual stimulation-induced lactate changes are in good agreement with prior non-edited spectra1-3. These results suggest similar degree of aerobic glycolysis in both DMN and non-DMN areas.Acknowledgements
This study was supported by the Swiss National Science Foundation (P300PB_161083) and the National Institute of Health, USA (R01 NS-100106, R01 MH-067528, R21 MH-110862, P30 NS-052519).References
1. Mekle R, Kuhn S, Pfeiffer H, et al. Detection of metabolite changes in response to a varying visual stimulation paradigm using short-TE 1 H MRS at 7 T. NMR in biomedicine 2017;30(2).
2. Schaller B, Mekle R, Xin L, et al. Net increase of lactate and glutamate concentration in activated human visual cortex detected with magnetic resonance spectroscopy at 7 tesla. J Neurosci Res 2013;91(8):1076-1083.
3. Schaller B, Xin L, O'Brien K, et al. Are glutamate and lactate increases ubiquitous to physiological activation? A (1)H functional MR spectroscopy study during motor activation in human brain at 7Tesla. Neuroimage 2014;93 Pt 1:138-145.
4. Koush Y, Elliott MA, Mathiak K. Single Voxel Proton Spectroscopy for Neurofeedback at 7 Tesla. Materials 2011;4(9).
5. Koush Y, Elliott MA, Scharnowski F, et al. Real-time automated spectral assessment of the BOLD response for neurofeedback at 3 and 7T. Journal of neuroscience methods 2013;218(2):148-160.
6. Koush Y, Elliott MA, Scharnowski F, et al. Comparison of real-time water proton spectroscopy and echo-planar imaging sensitivity to the BOLD effect at 3 T and at 7 T. PloS one 2014;9(3):e91620.
7. Bianciardi M, Fukunaga M, van Gelderen P, et al. Modulation of spontaneous fMRI activity in human visual cortex by behavioral state. Neuroimage 2009;45(1):160-168.
8. Banziger T, Mortillaro M, Scherer KR. Introducing the Geneva Multimodal expression corpus for experimental research on emotion perception. Emotion 2012;12(5):1161-1179.
9. Frahm J, Merboldt KD, Hanicke W. Localized Proton Spectroscopy Using Stimulated Echoes. J Magn Reson 1987;72(3):502-508.
10. Kershaw J, Tomiyasu M, Kashikura K, et al. A multi-compartmental SE-BOLD interpretation for stimulus-related signal changes in diffusion-weighted functional MRI. NMR in biomedicine 2009;22(7):770-778.
11. Cao P, Hyder F, Zhou IY, et al. Simultaneous spin-echo and gradient-echo BOLD measurements by dynamic MRS. NMR in biomedicine 2017;30(9).
Figures