3905
Higher Vitamin C Concentration in Patients with Alzheimer’s Disease1University of Minnesota, Minneapolis, MN, United States, 2VA Health Care System, Minneapolis, MN, United States
Synopsis
The concentrations of the antioxidants vitamin C (ascorbate, Asc) and glutathione (GSH) were quantified as components of the neurochemical profile using 7 T 1H MRS in patients with Alzheimer’s disease (AD) and age-matched controls. Spectra were measured at ultra-short echo time in the posterior cingulate cortex (PCC), which is involved in AD, and the occipital cortex (OCC) as a control region. In patients, the concentrations of Asc and myo-inositol were higher in both regions. In the PCC of patients, total choline concentration was also higher.
Purpose
The goal of this project was to quantify concentrations of brain antioxidants noninvasively in patients with Alzheimer’s disease (AD) since oxidative stress is involved in the pathogenesis of AD.Introduction
Most 1H MRS studies that investigated AD in the past (1) were limited in scope to the following neurochemicals: N-acetylaspartate (NAA), total choline (tCho), and myo-inositol (mIns), and levels were generally reported relative to creatine containing compounds (tCr). By scanning at ultra-high field and applying appropriate normalization, concentrations can be quantified, including those of the antioxidants vitamin C (ascorbate, Asc) and glutathione (GSH) (2,3).Methods
Sixteen patients with mild AD and seventeen age- and gender-matched cognitively healthy controls were studied at 7 T (Siemens) using a 16-channel radiofrequency coil and B1 shimming (4). Patients had a consensus diagnosis of probable or possible AD. Controls had no relevant neurological or psychiatric history or symptoms and had a normal neurological examination, including a cognitive screen, on the day of the MRI. Two regions were studied, the posterior cingulate cortex (PCC), which is involved early in AD, and the occipital cortex (OCC) as a control region. MPRAGE images were used to select 8 mL bilateral VOI. Spectra were measured using STEAM (TR = 5 s, TE = 8 ms, TM = 32 ms, 128 averages in PCC, 64 averages in OCC) with 3D OVS interleaved with VAPOR water suppression (5,6). Spectra were quantified using LCModel (7) and water corrected for gray matter, white matter and cerebrospinal fluid content as an internal reference. The neurochemicals in the basis set are those listed in table 1 plus lactate, glucose, and age-specific macromolecules. The baseline was constrained to be flat using a wide knot spacing (DKNTMN) of 5 (3). The basis set also included five standard simulated lipid resonances and two additional lipid resonances for the OCC, one with negative amplitude to accommodate possible lipid contamination. For the PCC, a single additional resonance was included to fit possible falx cerebri lipids (8). Additionally, a resonance at 3.155 pm was also included to fit the resonance of methylsulfonylmethane, a supplement for memory loss (9). Neurochemicals that were highly correlated due to overlap were reported as sums. Patients and controls were compared using a student’s t-test.Results
Figure 1 illustrates the excellent spectral quality and fit that were achieved. The average line width and SNR of all the spectra as estimated by LCModel were 9 Hz and 46, respectively. Extraneous lipid resonances were minimal. The baseline was flat, and an excellent fit is further evidenced by absence of resonances in the residual. Table 1 lists the 14 neurochemicals that were quantified. Lower bound estimates of fitting error (CRLB) for Asc and GSH were always ≤ 20%. Figure 2 illustrates the disease-associated differences in neurochemical concentrations measured in this study. Asc concentration was higher in patients with AD in both brain regions as well as mIns concentration. In the PCC of patients with AD, the concentration of tCho was also higher. The size and number of differences were greater in the PCC than in the OCC.Discussion
The AD-associated differences in the ratios tNAA/tCr, tCho/tCr and mIns/tCr measured in the PCC in this study, although that in tNAA/tCr was not significant are in agreement with the literature (1,10), where tNAA = NAA + NAAG. The current data, although not significant for tNAA are in agreement with past reports of higher mIns and lower tNAA concentrations (10) in the PCC of patients with AD (1). The nonsignificant higher tCr concentration that was measured in the PCC in this study is in contradiction to a prior report (10). A possible source of discrepancy is the constrained fit baseline in the current study.Conclusions
This is the first time that a higher concentration of Asc has been measured in patients with AD, and the first time that an AD-associated difference in the OCC has been shown. The larger number and size of neurochemical concentration differences that were measured in the PCC are consistent with the greater extent to which the PCC is impacted by AD. The distinctive scenarios in the PCC and OCC may provide clues into mechanisms underlying AD. In the PCC, AD-associated higher tCho, mIns and Asc may be associated with membrane turnover, gliosis, and signaling in the inflammatory response, respectively (11). That Asc was also higher in the OCC in patients with AD suggests a global inflammatory mechanism.Acknowledgements
Emily Kittelson for performing tissue segmentation and assessing study subjects, and Jillian Crocker for coordinating the study. This project was supported by the NIH, i.e., NIA R01AG039396, P41 EB015894, and P30 NS076408.References
1. Wang H, Tan L, Wang HF, Liu Y, Yin RH, Wang WY, Chang XL, Jiang T, Yu JT. Magnetic Resonance Spectroscopy in Alzheimer's Disease: Systematic Review and Meta-Analysis. J Alzheimers Dis 2015;46(4):1049-1070.
2. Terpstra M, Ugurbil K, Tkac I. Noninvasive quantification of human brain ascorbate concentration using 1H NMR spectroscopy at 7 T. NMR Biomed 2010;23(3):227-232.
3. Deelchand DK, Marjanska M, Hodges JS, Terpstra M. Sensitivity and specificity of human brain glutathione concentrations measured using short-TE 1H MRS at 7 T. NMR Biomed 2016;29(5):600-606.
4. Van de Moortele PF, Akgun C, Adriany G, Moeller S, Ritter J, Collins CM, Smith MB, Vaughan JT, Ugurbil K. B1 destructive interferences and spatial phase patterns at 7 T with a head transceiver array coil. Magn Reson Med 2005;54(6):1503-1518.
5. Tkac I, Andersen P, Adriany G, Merkle H, Ugurbil K, Gruetter R. In vivo 1H NMR spectroscopy of the human brain at 7 T. Magn Reson Med 2001;46(3):451-456.
6. Marjanska M, McCarten JR, Hodges J, Hemmy LS, Grant A, Deelchand DK, Terpstra M. Region-specific aging of the human brain as evidenced by neurochemical profiles measured noninvasively in the posterior cingulate cortex and the occipital lobe using 1H magnetic resonance spectroscopy at 7 T. Neuroscience 2017;354:168-177.
7. Provencher SW. Automatic quantitation of localized in vivo 1H spectra with LCModel. NMR Biomed 2001;14(4):260-264.
8. McIntyre DJ, Charlton RA, Markus HS, Howe FA. Long and short echo time proton magnetic resonance spectroscopic imaging of the healthy aging brain. J Magn Reson Imaging 2007;26(6):1596-1606.
9. Lin A, Nguy CH, Shic F, Ross BD. Accumulation of methylsulfonylmethane in the human brain: identification by multinuclear magnetic resonance spectroscopy. Toxicol Lett 2001;123(2-3):169-177.
10. Shiino A, Watanabe T, Shirakashi Y, Kotani E, Yoshimura M, Morikawa S, Inubushi T, Akiguchi I. The profile of hippocampal metabolites differs between Alzheimer's disease and subcortical ischemic vascular dementia, as measured by proton magnetic resonance spectroscopy. J Cereb Blood Flow Metab 2012;32(5):805-815.
11. Harrison FE, May JM, McDonald MP. Vitamin C deficiency increases basal exploratory activity but decreases scopolamine-induced activity in APP/PSEN1 transgenic mice. Pharmacol Biochem Behav 2010;94(4):543-552.
Figures
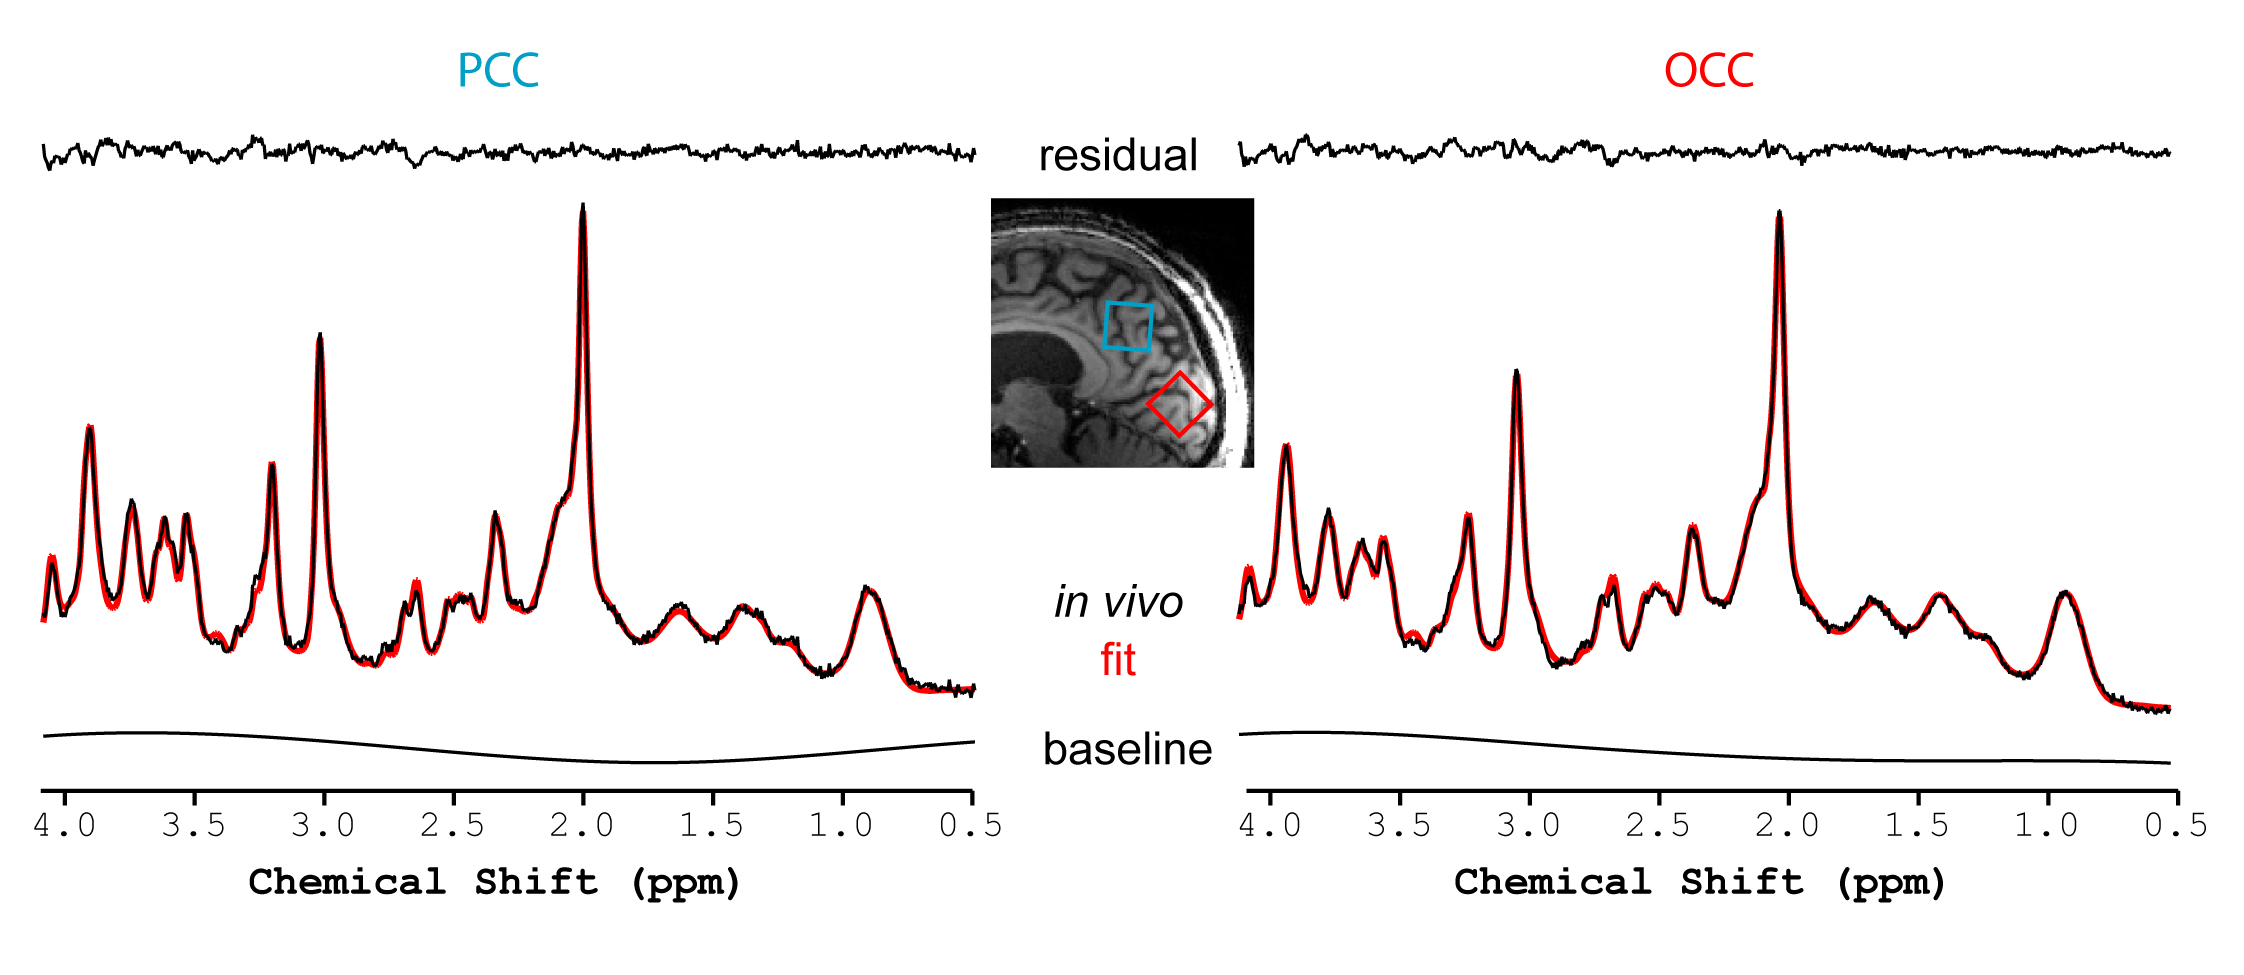
Figure 1.
Representative image, spectra and fits from a patient with AD. MPRAGE image (TR = 3 s; TE = 3.27 ms; field of view: 256 x 256 mm2; matrix: 256 x 256; slice thickness = 1 mm, 176 slices, acceleration factor = 3, acquisition time: 4 min 17 s) upon which the two study VOI are illustrated (blue box for the PCC, red box for the OCC)). The in vivo PCC (left) and OCC (right) spectra are shown along with the LCModel fit (red) and residual (top) as well as the baseline component of the fit (bottom).
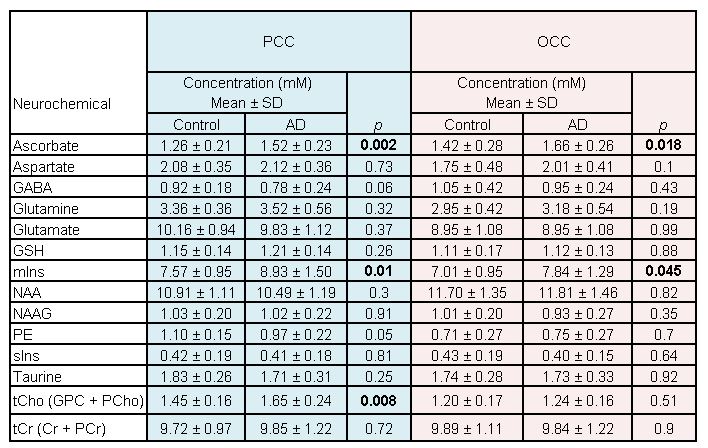
Table 1.
Neurochemical concentrations quantified in the PCC and OCC of patients with AD and age- and gender-matched controls in this study. p-values for AD versus control per region are in bold if < 0.05.
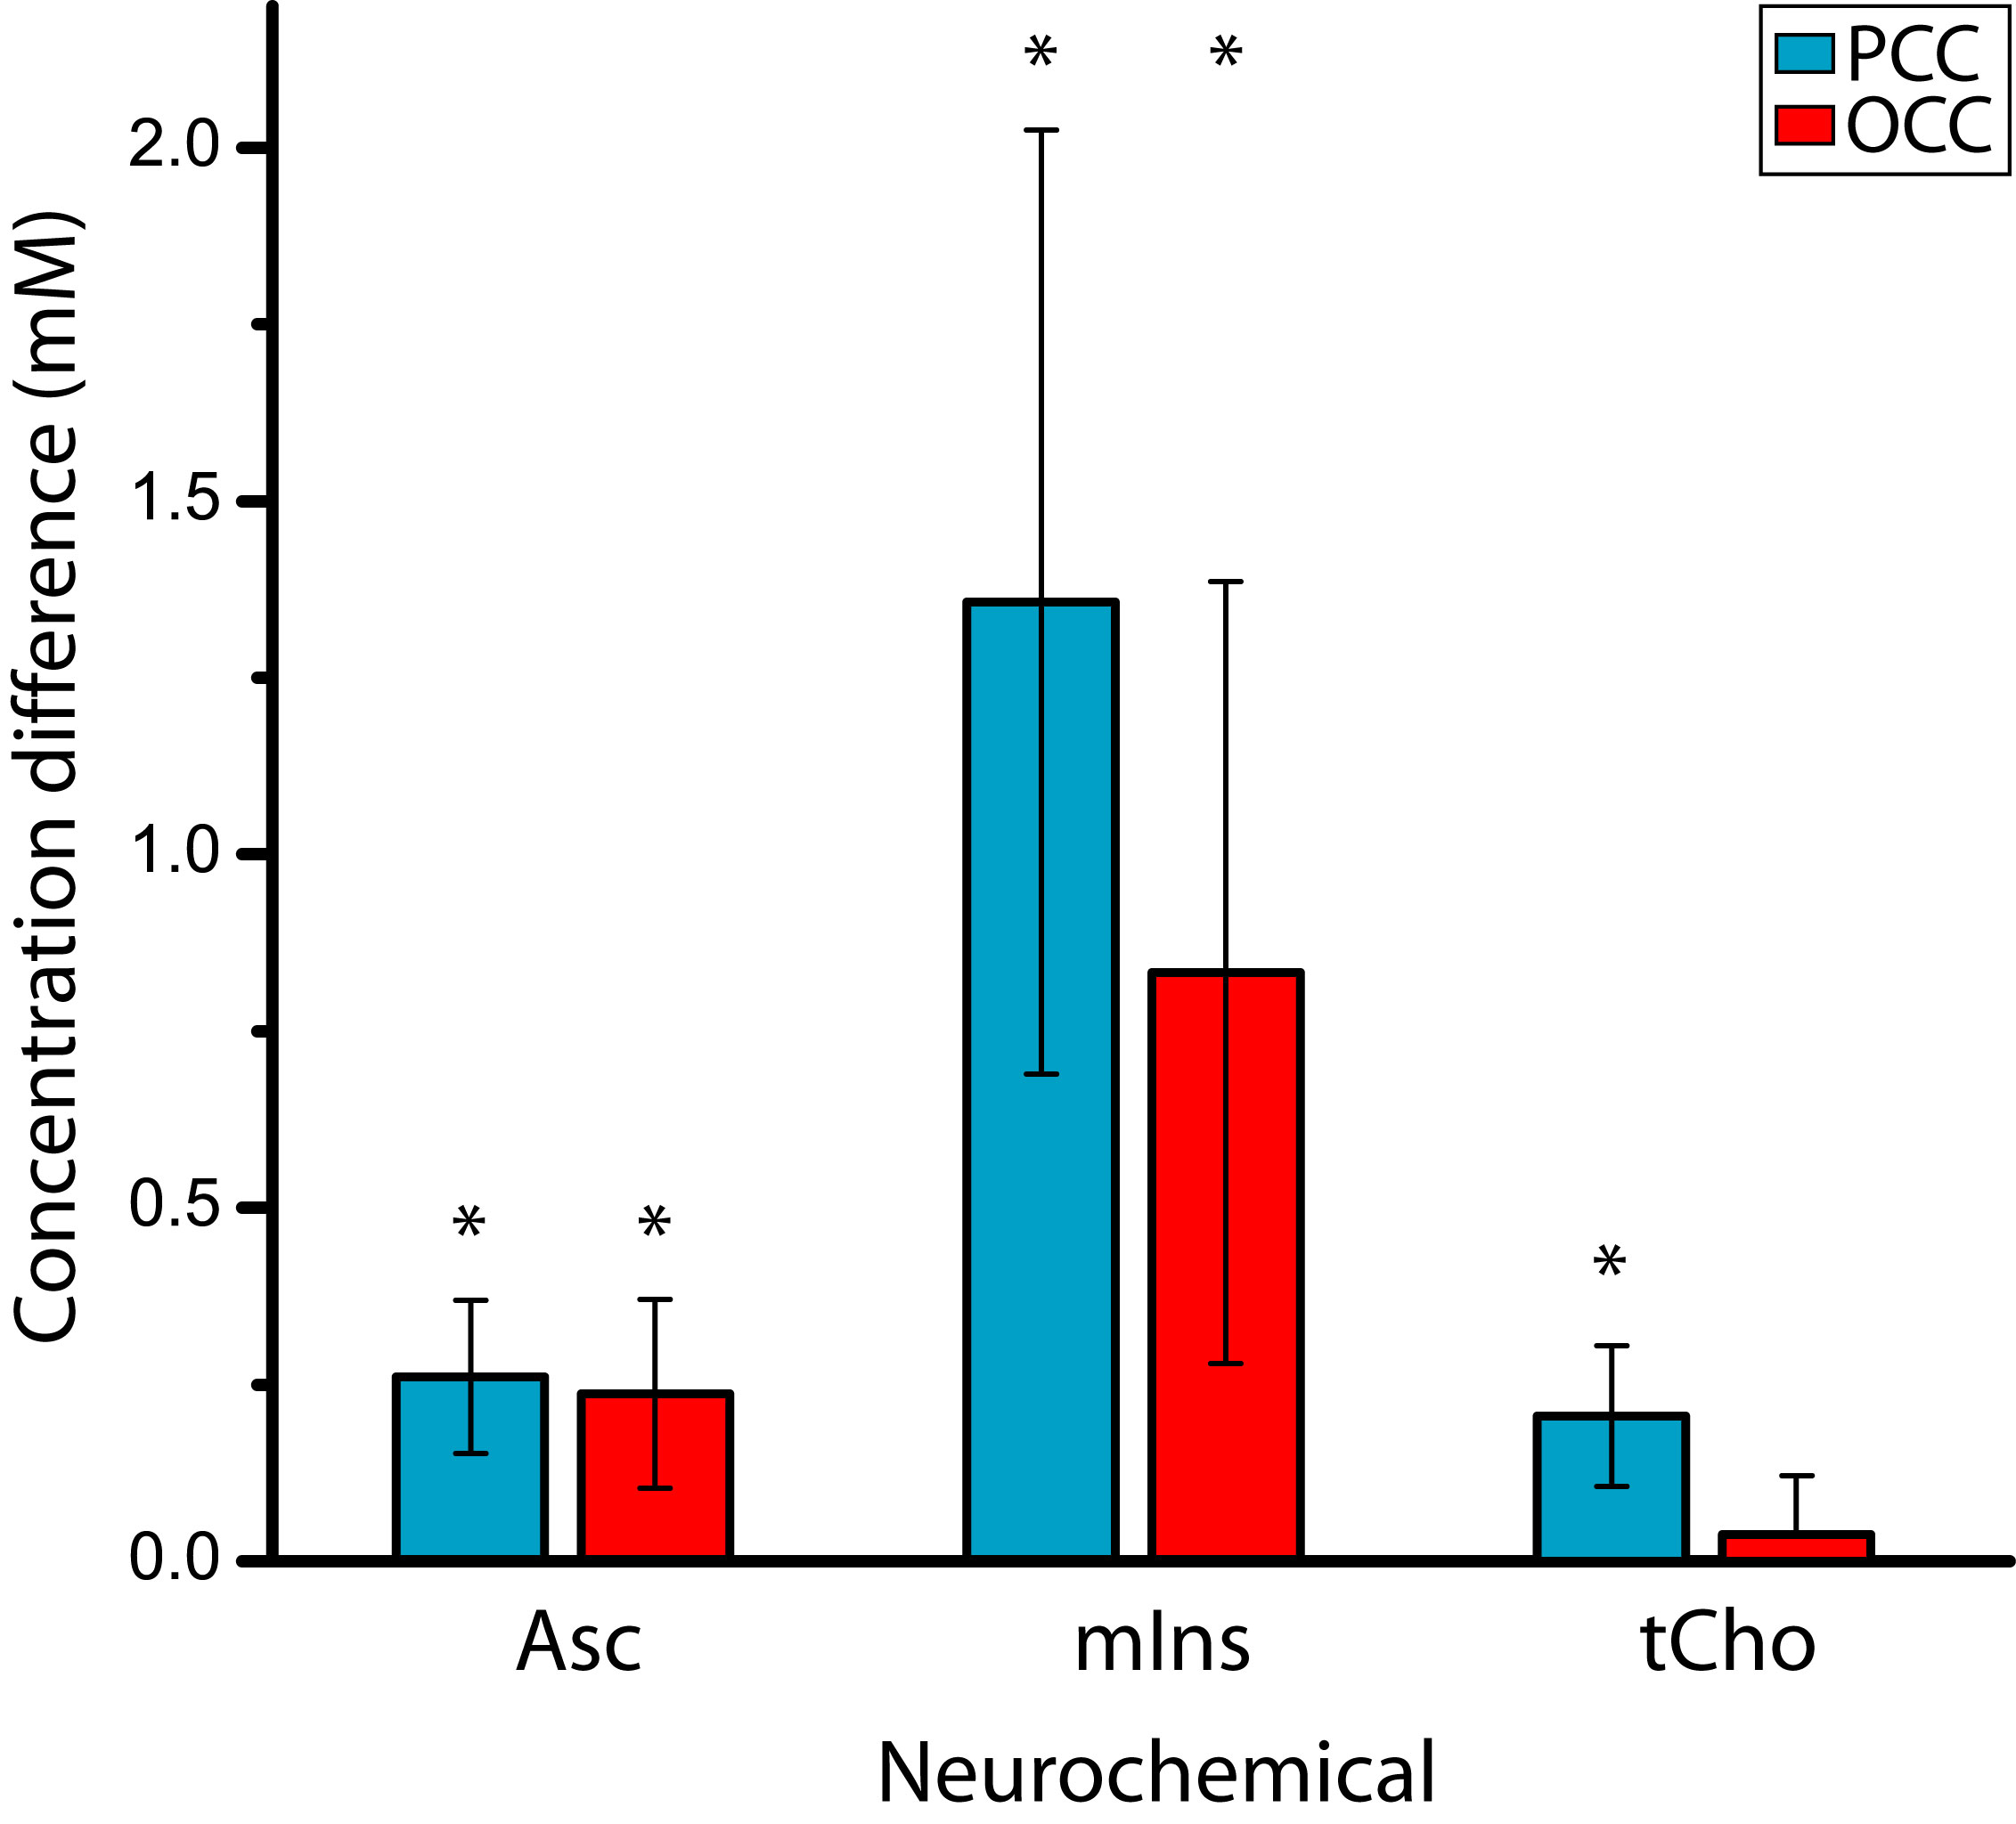
Figure 2.
Differences in neurochemical concentrations (mM): AD minus control in the OCC and PCC brain regions. Error bars are the sums of SE for AD and control. Only the neurochemicals with an AD-control difference (p < 0.05) in at least one brain region are plotted: Asc, mIns and tCho. *p < 0.05