3904
Relationship of longitudinal changes in cerebral metabolite and diffusivity property during the early brain development1Yerkes Imaging Center, Yerkes National Primate Research Center, Emory University, Atlanta, GA, United States, 2Department of Radiology and imaging science, Emory University, Atlanta, GA, United States, 3Department of Human Genetics, Emory University School of Medicine, Emory University, Atlanta, GA, United States, 4Divisions of Microbiology and Immunology, Yerkes National Primate Research Center, Emory University, Atlanta, GA, United States, 5Division of Neuropharmacology and Neurologic Diseases, Yerkes National Primate, Emory University, Atlanta, GA, United States
Synopsis
In vivo Magnetic Resonance Spectroscopy (MRS) is widely used to
characterize the cerebral metabolic disorders in the developing
brains of human
and animal models. Prior study has demonstrated the spatial and temporal
difference in evolution pattern of each metabolite during early brain
maturation. This study is aimed to investigate the relationship of the longitudinal
change of each metabolite with the microstructural evolution during early brain
development in the cingulate cortex (ACC) of rhesus monkeys. The results
demonstrated the heterogeneity of correlation degree of each metabolite with
the microstructural maturation, suggesting combined MRS/DTI examination could
offer complementary information to characterize early brain maturation and related
disorders in pediatric research.
Introduction
In vivo Magnetic Resonance Spectroscopy (MRS) is a robust approach for studying the biochemical maturation or disorders in the developing brains of human and animal models [1-3]. Meanwhile, the dramatical microstructural changes in gray matter and white matter are seen during the brain maturation and could be well delineated using diffusion tensor imaging (DTI) [4]. Both measures have been used together to characterize the biological changes in the brain in prior studies. However, it remains not fully understood how metabolic maturation is temporally correlated with the DTI-characterized brain maturation. In the present study, the longitudinal cerebral metabolite and mean diffusivity (MD) changes in rhesus monkey infants were examined and their relationship was evaluated.Methods
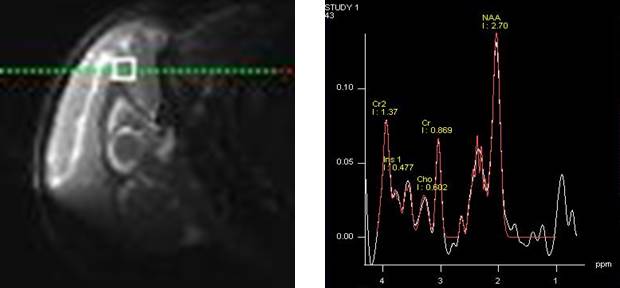
Four infant rhesus monkeys (2 males and 2 females) were used in this study. MRS experiments were conducted at the age of the 6, 12, and 18 months on a 3.0 T whole body scanner (Siemens Medical System) using a customer-built single-loop surface coil (ID=5cm). During MRI scanning, animals were anesthetized using a continuous flow of 1-1.5% isoflurane mixed with air and immobilized with the customer-built head holder. Animal physiological parameters such as End-tidal CO2, inhaled CO2 ,O2 saturation, blood pressure, heart rate, respiration rate, and body temperature were monitored continuously. Single Voxel MRS (SVS) was acquired using PRESS sequence (TR/TE =1500/30ms, FA = 70°) with a 5 × 5 × 5 mm3 voxel placed in anterior cingulate cortex (ACC) (Fig.1). Spectra with and without water suppression were acquired at each voxel, respectively. Concentrations of metabolites, including N-acetylasparlate (NAA), creatine and phosphocreatine (tCr), total choline (tCho), myo-inositol (mI), Glutmate(Glu)/Glutmin (Glx), were derived from the spectra using the LC Model software (www.s-provencher.com) using the unsuppressed water peak as reference. DTI with 30 directions and b=1000 s/mm2 was performed using a phase-arrayed volume coil in the same scan session [8]. Repeated ANOVA and spearman correlation analysis between the MD and metabolite concentrations were performed (P<0.05).Results
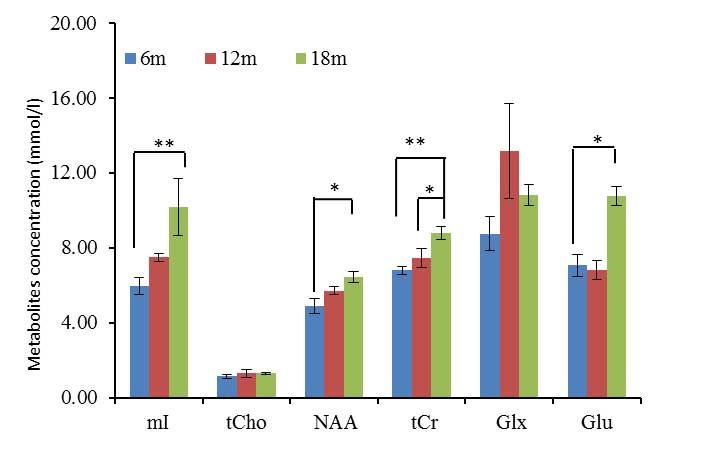
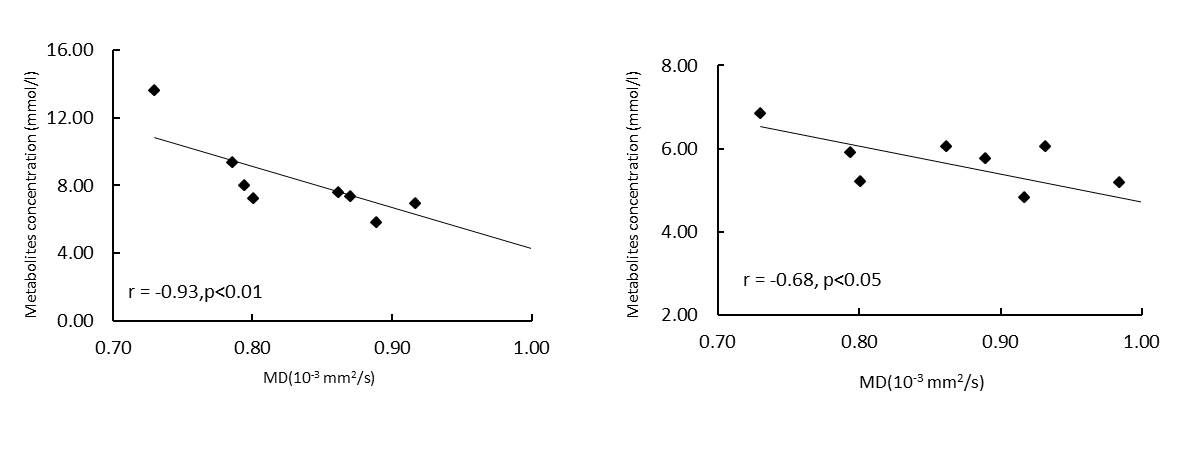
Absolute metabolite concentration of mI, NAA, Cho, tCrand Glx in ACC were presented in Fig.2. mI, NAA, Glu and tCr in ACC showed significantly increase from 6 months and 18 months. Glutamate/Glutamine (Glx) significantly increased from 6 month to 12 month. Mean diffusivity (MD) in ACC showed dramatic and progressive decrease over time. Progressive elevation of metabolite concentration was seen in mI, NAA, tCr and Glu which also were negatively correlated with MD change. Temporal correlation change between cerebral metabolites (NAA, mI) and MD were shown in Fig 3 and 4.Discussion
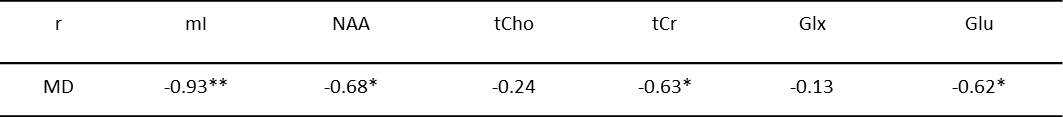
Age-dependent elevation of metabolites (NAA, tCr and Glx) has been reported in previous MRS studies in normally developing children [2, 3]. Stefan et al’s study demonstrated different developmental profiles of each brain metabolite during brain maturation [9]. Monotonous and remarkable decreases or increases in diffusion tensor eigenvalues in the grey matter and white matter were observed in subjects of postconceptional ages 7 months to < 3 years kids [4], indicating the diffusivity indices are excellent biomarker to delineate the progressive and quick changes in brain tissue during early brain development. The present study on ACC of monkey infants suggests the progressive elevation of NAA(indicator for neurons and axons), tCr (energy metabolite), mI (osmolyte and astrocyte marker) and Glu (excitatory neurotransmitter) was significantly correlated with the quick MD changes (table 1), suggesting that neuron /axon and glia cell experienced quick maturation period during such early brain development [10]. Interestingly, temporal correlation was not seen in Choline (marker for myelin and cell membrane) mostly due to its heterogeneous pattern in different brain regions. The degree of temporal correlation between each metabolite and the diffusivity index in the specific region of interest may provide complementary information of the biological changes in normal or abnormal brain.Conclusion
The present results indicate the maturation of each metabolite is correlated differently with the microstructural maturation during early brain development. Combined MRS/DTI examination could offer complementary information to characterize early brain maturation and related disorders.Acknowledgements
The project was funded by the National Center for Research Resources (P51RR000165) and is currently supported by the Office of Research Infrastructure Programs (OD P51OD011132).References
[1] Burri R et al, Neurochem Res.(1990); [2] Kreis et al.,Magn. Reson. Med. 30 (1993); [3] POUWELS, PETRA J. W et al., Pediatrics (1999); [4] Mukherjee et al, AJNR (2002); [5] Bartha et al, AJNR (2007), [6] Ratai EM et al, BMC Neurosci. 2009; [7] Herndon JG et al. Behav Brain Res (1997); [8] Yuguang Meng et al, Scientific Reports Sci (2017); [9] Stefan et al., Cerebral Cortex December (2013);[10] Pratik Mukherjee et al, Neuroradiol (2002).Figures