3899
In vivo characterization of glucose metabolism in pancreatic cancer xenografts.1NCI, Bethesda, MD, United States
Synopsis
Recently, we developed a post processing denoising algorithms that are based on singular value decomposition and its multidimensional analogue Tucker decomposition. These algorithms allow more than 10-fold improvement in signal to noise ratio in dynamic spectroscopy and more than 50-fold in dynamic spectral imaging studies. Using this technique, we successfully characterize the metabolic profiles of two pancreatic ductal adenocarcinoma xenografts, MiaPaca-2 and Hs766t tumors by injecting 50 mg of 13C6 glucose. This imaging is potentially applicable to human subject and provides even more information than PET or 13C DNP MRI alone.
INTRODUCTION
Cancerous
tissue has a metabolic profile characterized by aerobic glycolysis, known as
Warburg effect. This energy production has been targeted for both treatment
strategy of chemotherapy and cancer detection by imaging modalities. MRI is
currently the only clinically applicable imaging technique to depict the
intra-tumor metabolic profiles (1). By injecting hyperpolarized (HP) 13C1 pyruvate
and taking spectrum/ spectral-imaging, lactate converted from pyruvate can be
detected at different chemical shift from that of pyruvate allowing us to
calculate the rate constant of the conversion. Similar to enhanced pyruvate to lactate conversion, enhanced glucose uptake is also a feature of cancer metabolism and is utilized in PET imaging studies. Althought 13C6 glucose has been tested for DNP studies, it is difficult to acquire signal with sufficient signal to noise ratio (S/N) and has not been widely researched (2).
Here, we demonstrate another in vivo metabolic imaging of 13C6 glucose by improving the signal to noise ratio (S/N) with newly developed denoising algorithm. This imaging requires only 13C6 glucose injection without hyperpolarization. This non-DNP glucose imaging provides a comprehensive information of glycolysis from glucose uptake to lactate production. The differences in metabolic profile between two pancreatic cancer xenograft models were analyzed by both DNP pyruvate imaging and non-DNP glucose imaging and the resultant profilings were further examined with enzyme/transporter expressions that are related to glycolysis.
METHODS
Two pancreatic ductal adenocarcinoma cell line MiaPaca-2 and Hs766t are used to create xenograft models in mice.
Details of hyperpolarization procedure were reported previously (3).
Hyperpolarized
[1-13C] pyruvate solution (12 µL/g body weight) was intravenously
injected through a catheter placed in the tail vein of mouse.
Hyperpolarized
13C MRI studies were performed on a 3 T scanner (MR Solution) using
a 17-mm home-built 13C solenoid coil placed inside of a saddle coil
for 1H. The following is the parameters for 13C dynamic spectrum. Spectral band width/TR/flip angle, 3300 Hz/1000ms/10 degree
Non DNP glucose injection studies were performed on a 9.4 T scanner (Bruker) with 17-mm home-built 13C solenoid coil placed inside of a saddle coil for 1H. Repeated single pulse 1D spectroscopy and chemical shift imaging (CSI) were used for dynamic spectrum study and dynamic imaging study, respectively. For both study, 20dB of decoupling pulse was applied for spectral acquisition and either SDV or Tucker Decomposition based denoising algorithm were applied to improve the S/N.
The following is the parameters for 13C dynamic spectrum. Spectral band width/TR/Number of repetition/flip angle/decoupling, 20000 Hz/50 ms/32/12 degree/20 dB
RESULTS
Higher lactate production was detected in Hs766t tumors from DNP MR spectroscopy using 13C1 pyruvate though not statistically significant (Fig. 1). On the other hand, from non-DNP glucose injection studies, we could obtain three parameters, rate of glucose uptake, rate of glucose metabolism, and rate of lactate production for both tumor models. Similar to the result from DNP studies, the rate of lactate production was higher in Hs766t tumor though not statistically significant. However, higher glucose uptake was detected in Hs766t tumors with statistical significance compared with MiaPaca-2 tumors. The result was consistent with higher expression of Glut-1 in Hs766t tumors (Fig. 2). The non-DNP imaging studies showed faster glucose uptake in Hs766t tumor than MiaPaca-2 tumor. Lactate production was also successfully imaged at a later phase (Fig. 3C, F time point of 64 and 85 min after injection), suggesting the potential use of the non-DNP imaging for cancer detection.
DISCUSSION
Non-DNP 13C6 glucose spectroscopy/spectral imaging are potentially more informative than other imaging modalities when applied novel denoising post-processing methods. The method provides PET like glucose imaging with 13C DNP MRI like lactate imaging by injecting just non-polarized 13C6 glucose. With this method, we could obtain additional metabolic profiling than that from 13C DNP MRI. By combining the information of glucose uptake and lactate production, cancer detection or assessment of treatment response can be realized with non-toxic dose of glucose. This is also potentially feasible without special equipment other than 13C coil and high field MRI. Further improvement is expected to in signal quality by using fast acquisition sequences, which will reduce the required glucose amount to injectable dose for human subject.CONCLUSION
Non-DNP 13C6 glucose spectroscopy/spectral imaging differentiate two pancreatic cancer xenografts by their ability of measuring glucose uptake. The more comprehensive information obtained from this method provides better metabolic profiling than existing DNP method.
Acknowledgements
This study was mainly supported by intramural research program of the NCI/NIH.References
1 Brindle KM, Bohndiek SE, Gallagher FA, Kettunen MI: Tumor imaging using hyperpolarized 13C magnetic resonance spectroscopy. Magn Reson Med 66: 505–519, 2011.
2 Rodrigues TB, Serrao EM, Kennedy BWC, Hu D-E, Kettunen MI, Brindle KM: Magnetic resonance imaging of tumor glycolysis using hyperpolarized 13C-labeled glucose. Nat Med 20: 93–97, 2013.
3 Matsumoto S, Saito K, Takakusagi Y, Matsuo M, Munasinghe JP, Morris HD, Lizak MJ, Merkle H, Yasukawa K, Devasahayam N, Suburamanian S, Mitchell JB, Krishna MC: In Vivo Imaging of Tumor Physiological, Metabolic, and Redox Changes in Response to the Anti-Angiogenic Agent Sunitinib: Longitudinal Assessment to Identify Transient Vascular Renormalization. Antioxid Redox Signal 21: 1145–1155, 2014.
Figures
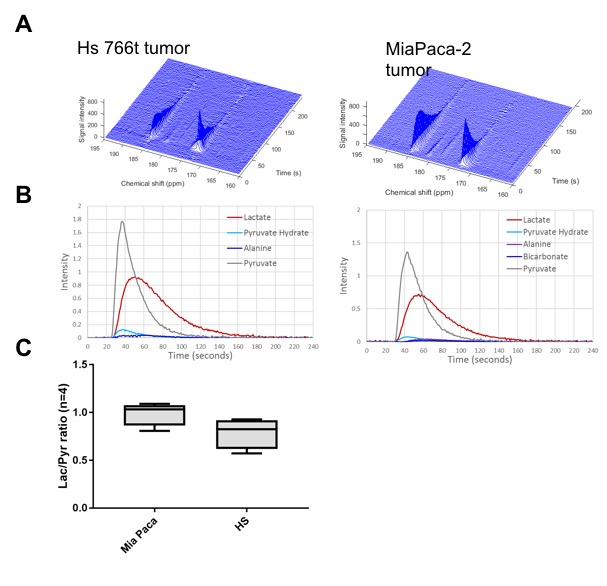
Figure 1
Dynamic spectrum from tumor region taken from DNP pyruvate injection MRS study. A. Representative dynamic spectrum for MiaPaca-2 tumor (right) and Hs766t tumor (left). B. Peak plots of identifiable metabolites. C. Comparison of Lactate/Pyruvate ratio between MiaPaca-2 tumors (right) and Hs766t tumors (left).
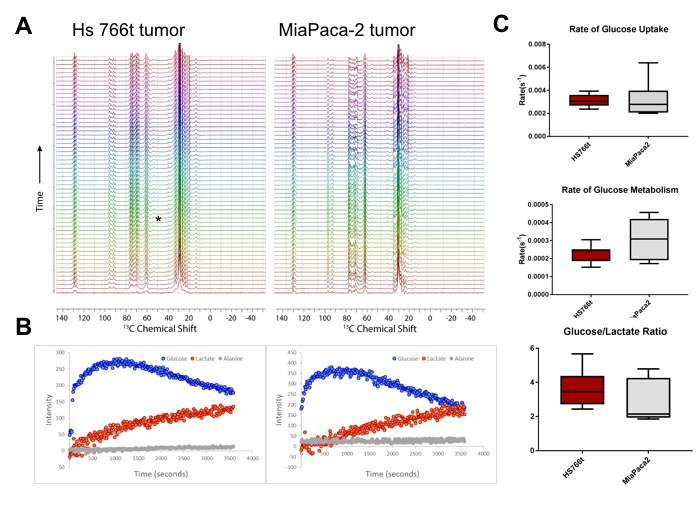
Figure 2
Dynamic spectrum from tumor region taken from non-DNP glucose injection MRS study. A. Representative
dynamic spectrum for MiaPaca-2 tumor (right) and Hs766t tumor (left).
B. Peak plots of identifiable metabolites. C. Comparison of glucose uptake rate, glucose metabolism rate, and lactate production rate between MiaPaca-2 tumors (right) and Hs766t
tumors (left).
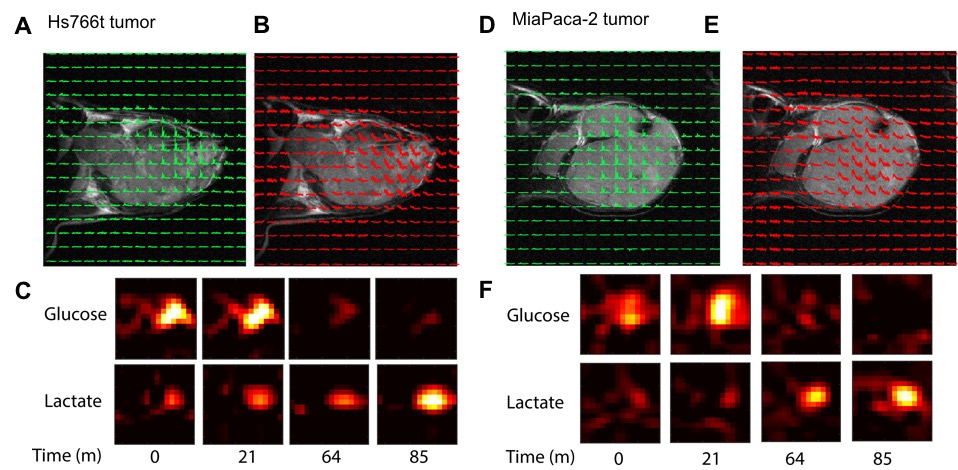
Figure 3
Representative chemical shift imaging of non-DNP glucose injection study for both Hs766t tumor (A, B, C) and MiaPaca-2 tumor (D, E, F). A,D Chemical shift imaging, B,E Pixel by pixel plots of glucose kinetics. C,F Chemical shift imaging of both glucose (top) and lactate (bottom) at time points of 0, 21, 64, 85 minutes after glucose injection.