3897
Energy Metabolism Differences in Rat Skeletal Muscle Due to Restricted Ambulation Following SCI1Physiology and Functional Genomics, University of Florida, Gainesville, FL, United States, 2Applied Physiology and Kinesiology, University of Florida, Gainesville, FL, United States, 3Physical Therapy, University of Florida, Gainesville, FL, United States, 4Physiological Sciences, University of Florida, Gainesville, FL, United States
Synopsis
Classic rodent models of SCI can rapidly and spontaneously recover locomotor function, muscle mass, and energy metabolism within weeks after injury. This is attributed to “self training” and does not replicate the conditions experienced by human patients who are often confined to bed rest for an extended period of time. Using 31P-MRS during electrically stimulated exercise to assess mitochondrial oxidative capacity in vivo, we show that restricted activity by cast immobilization delays spontaneous recovery of skeletal muscle metabolism in a rat model of severe SCI.
INTRODUCTION
Discrepancies between human and animal models’ response to spinal cord injury (SCI) can be a barrier for translating pre-clinical rehabilitation research to the clinic. Although rodent models have proven to be invaluable for investigation of changes in muscle mass, force, and metabolism, they can rapidly and spontaneously recover faster than human subjects who are often confined to bed rest for an extended period of time.1-6 In the setting of moderate SCI, we previously reported that both muscle mass and mitochondrial oxidative capacity derived from 31P-MRS of phosphocreatine (PCr) kinetics in vivo recovered within 3 weeks post-SCI.6 This phenomenon, attributed to “self training”, constitutes a confounding factor and limits the time window available for treatment evaluation. We propose to address this issue by combining severe contusion SCI (sSCI) and activity restriction by cast immobilization using a rat model that we previously validated with muscle 3D-MRI.5 We report on high field 31P-MRS measures to 1) characterize for the first time lower leg muscles bioenergetics after sSCI and 2) determine the effect of cast immobilization after sSCI.METHODS
Experimental groups: 16-week-old female Sprague-Dawley rats (n=37) were divided into 5 groups. Three groups were subjected to sSCI of the T8 segment of the cord using the New York University impactor (10-g weight drop, 50-mm height). Animals were scanned 1 week post-surgery (SCI-1wk, n=9), 3 weeks post-surgery (SCI-3wk, n=5), or after bilateral cast immobilization for 2 weeks from day 8 after SCI (SCI-3wk+IMM, n=7). Uninjured animals served as controls (CTR, n=9).
Locomotor function was assessed weekly using the Basso-Beattie-Bresnahan-(BBB) locomotor scale.1
31P-MRS acquisitions were performed under
anesthesia in a 11.1T/470MHz Agilent system using VnmrJ 2.3. Data were
collected with a 10x15 cm2 surface coil placed over the leg. A 1H coil was placed
orthogonally for shimming. Muscles were repeatedly electrically stimulated (1ms
pulses, 1Hz, 15-20 V) using subcutaneous needles. 31P spectra were acquired
during rest (2 min), exercise (5 min) and recovery (20 min) (20 µs bp, ernst
angle, TR=1 s, SW=10 kHz, 4096 points, NA=10). The carrier frequency was set
4.5 ppm up-field from PCr. Fully relaxed spectra were acquired for T1
saturation correction. Data were processed in jMRUI 5.0. After 0/1st order
phasing, spectra were fitted using AMARES assuming prior knowledge of the peaks
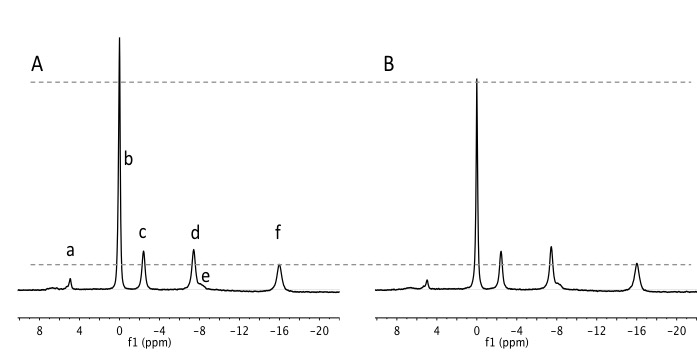
frequencies with reference to PCr (Figure 1), gaussian shapes and linewidth
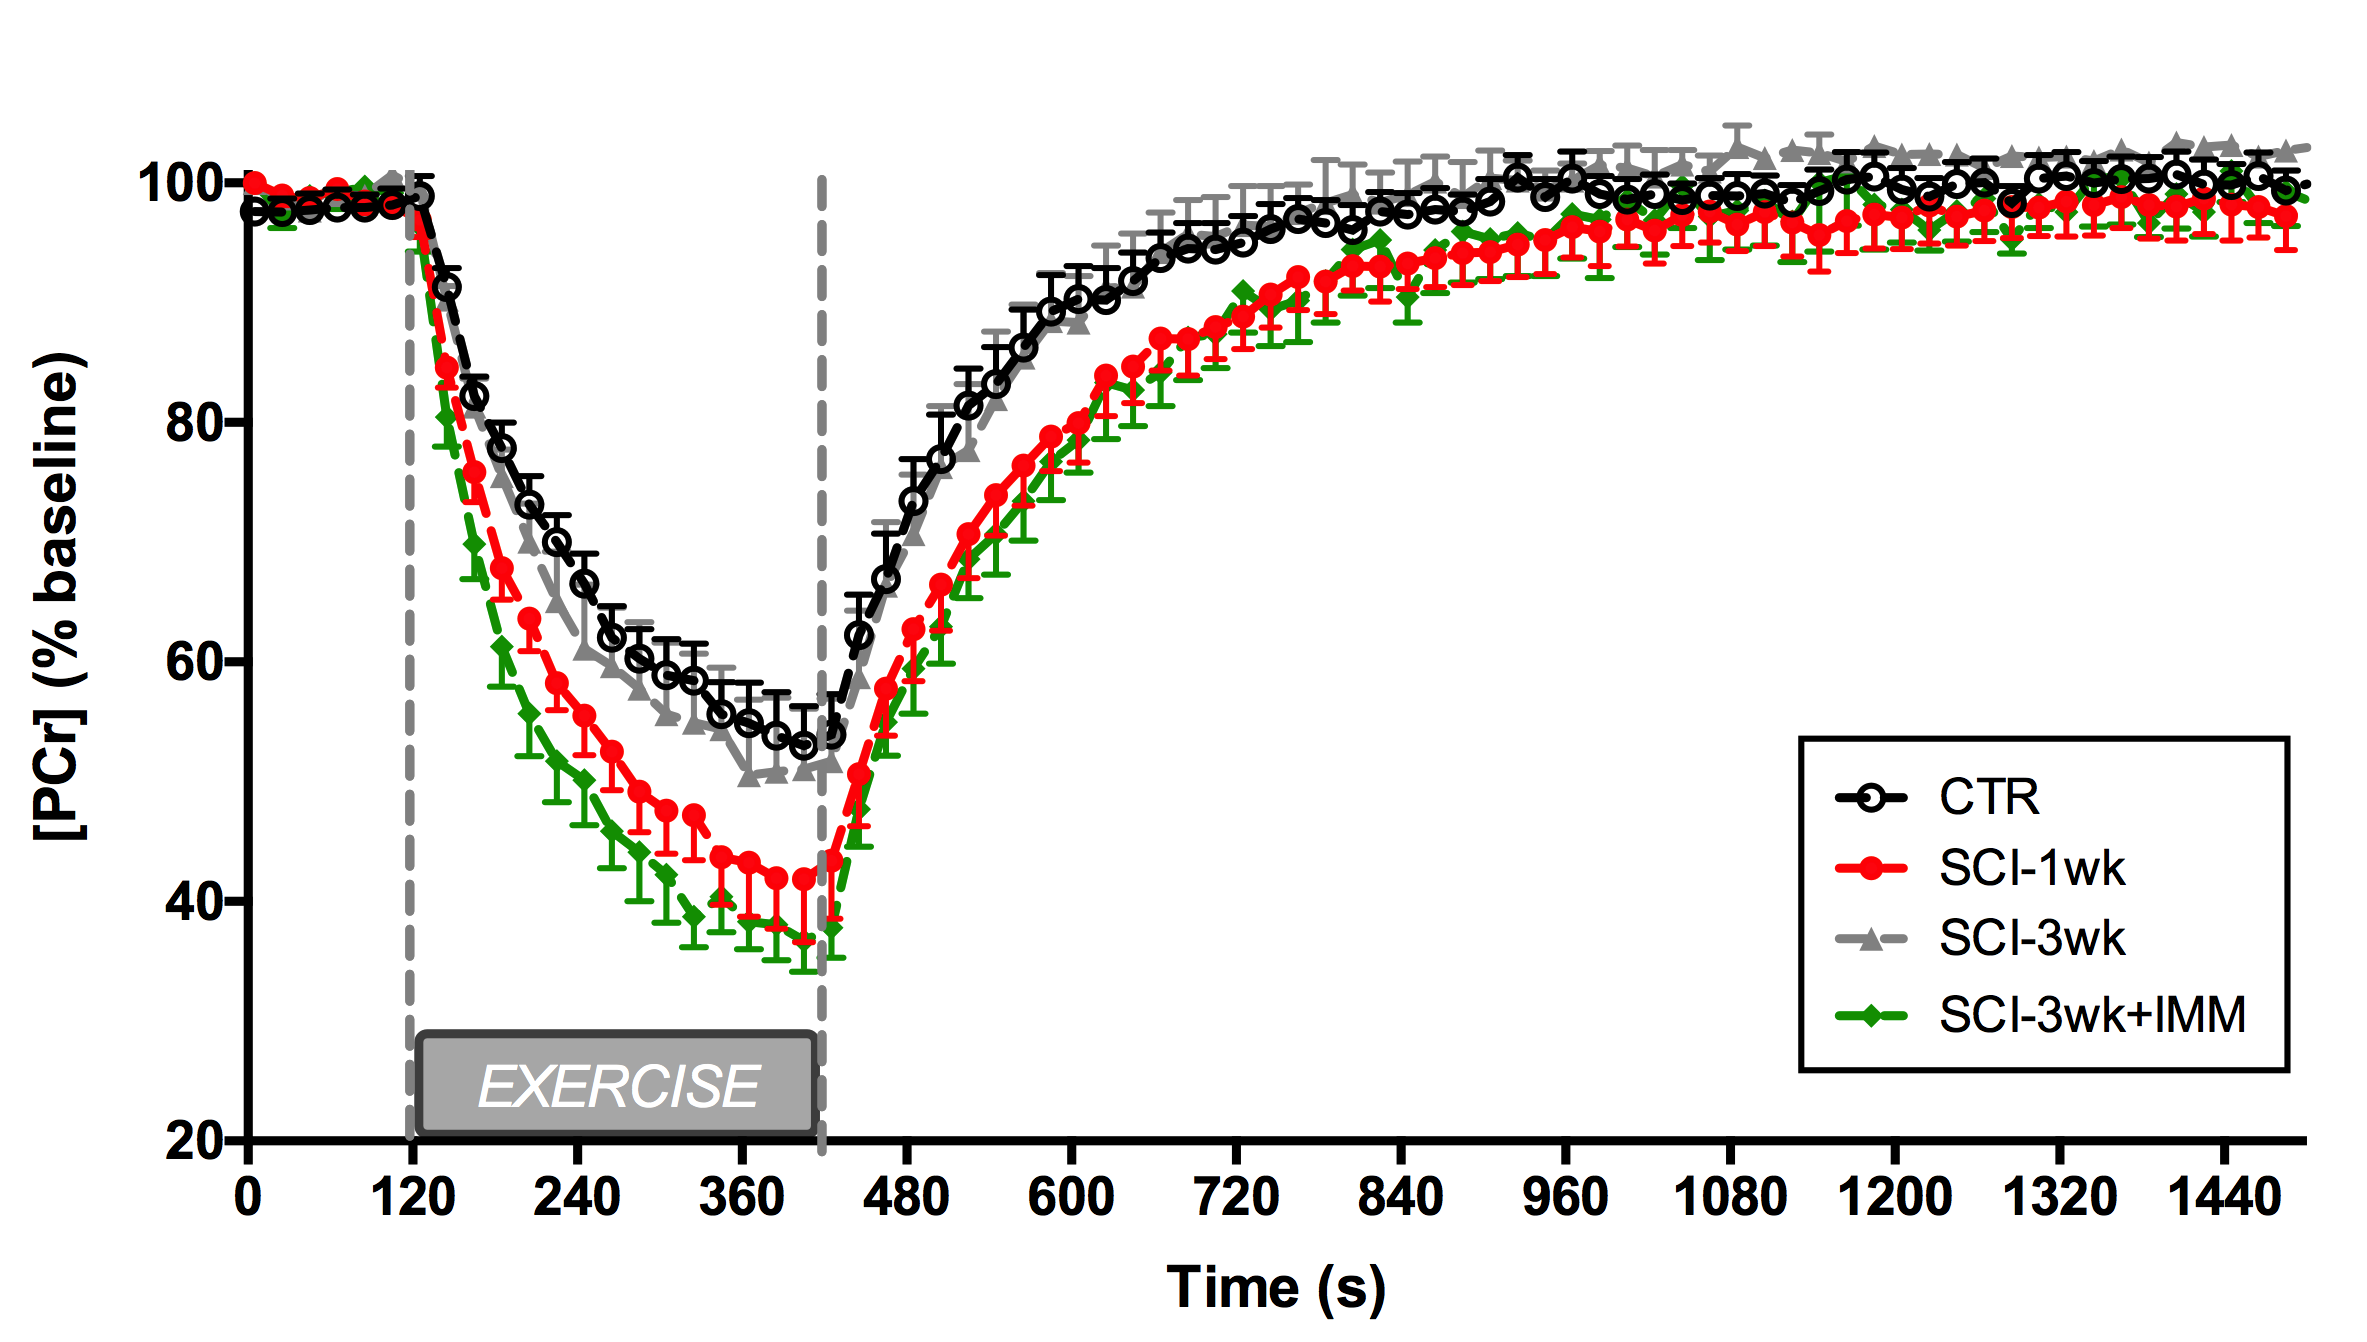
<50 MHz. PCr signal time course was fitted to a mono-exponential function
(Figure 2) to determine PCr recovery rate kPCr, a marker of mitochondrial
oxidative capacity, and pHi was calculated.7 Finally, the triceps
surae muscles were harvested and weighed. Statistical tests and p values are
detailed in the figure legends.
RESULTS
1) Locomotor function scores on day 7 were consistent with that expected after sSCI1 (1.03 ± 0.22 in SCI1-wk, and 0.92 ± 0.21 in SCI-3wk+IMM). SCI-3wk BBBs reached 4.4 ± 0.5, whereas BBB was 0 in all animals in SCI-3wk-IMM.
2) Differences in metabolites levels and pH at rest: We found no difference in the resting pHi, and Pi/PCr levels. On the other hand, PCr/ATP was significantly lower SCI-1wk compared to CTR (Figure 1; 2.82±0.27 vs. 3.48±0.37; p=0.02). However, PCr/ATP had returned to control values in the SCI-3wk and was different from SCI-1wk (3.54±0.44; p=0.02). SCI-3wk+IMM showed a decrease in PCr/ATP compared to CTR (2.98 ± 0.55) to the same extent of that observed in the SCI-1wk group.
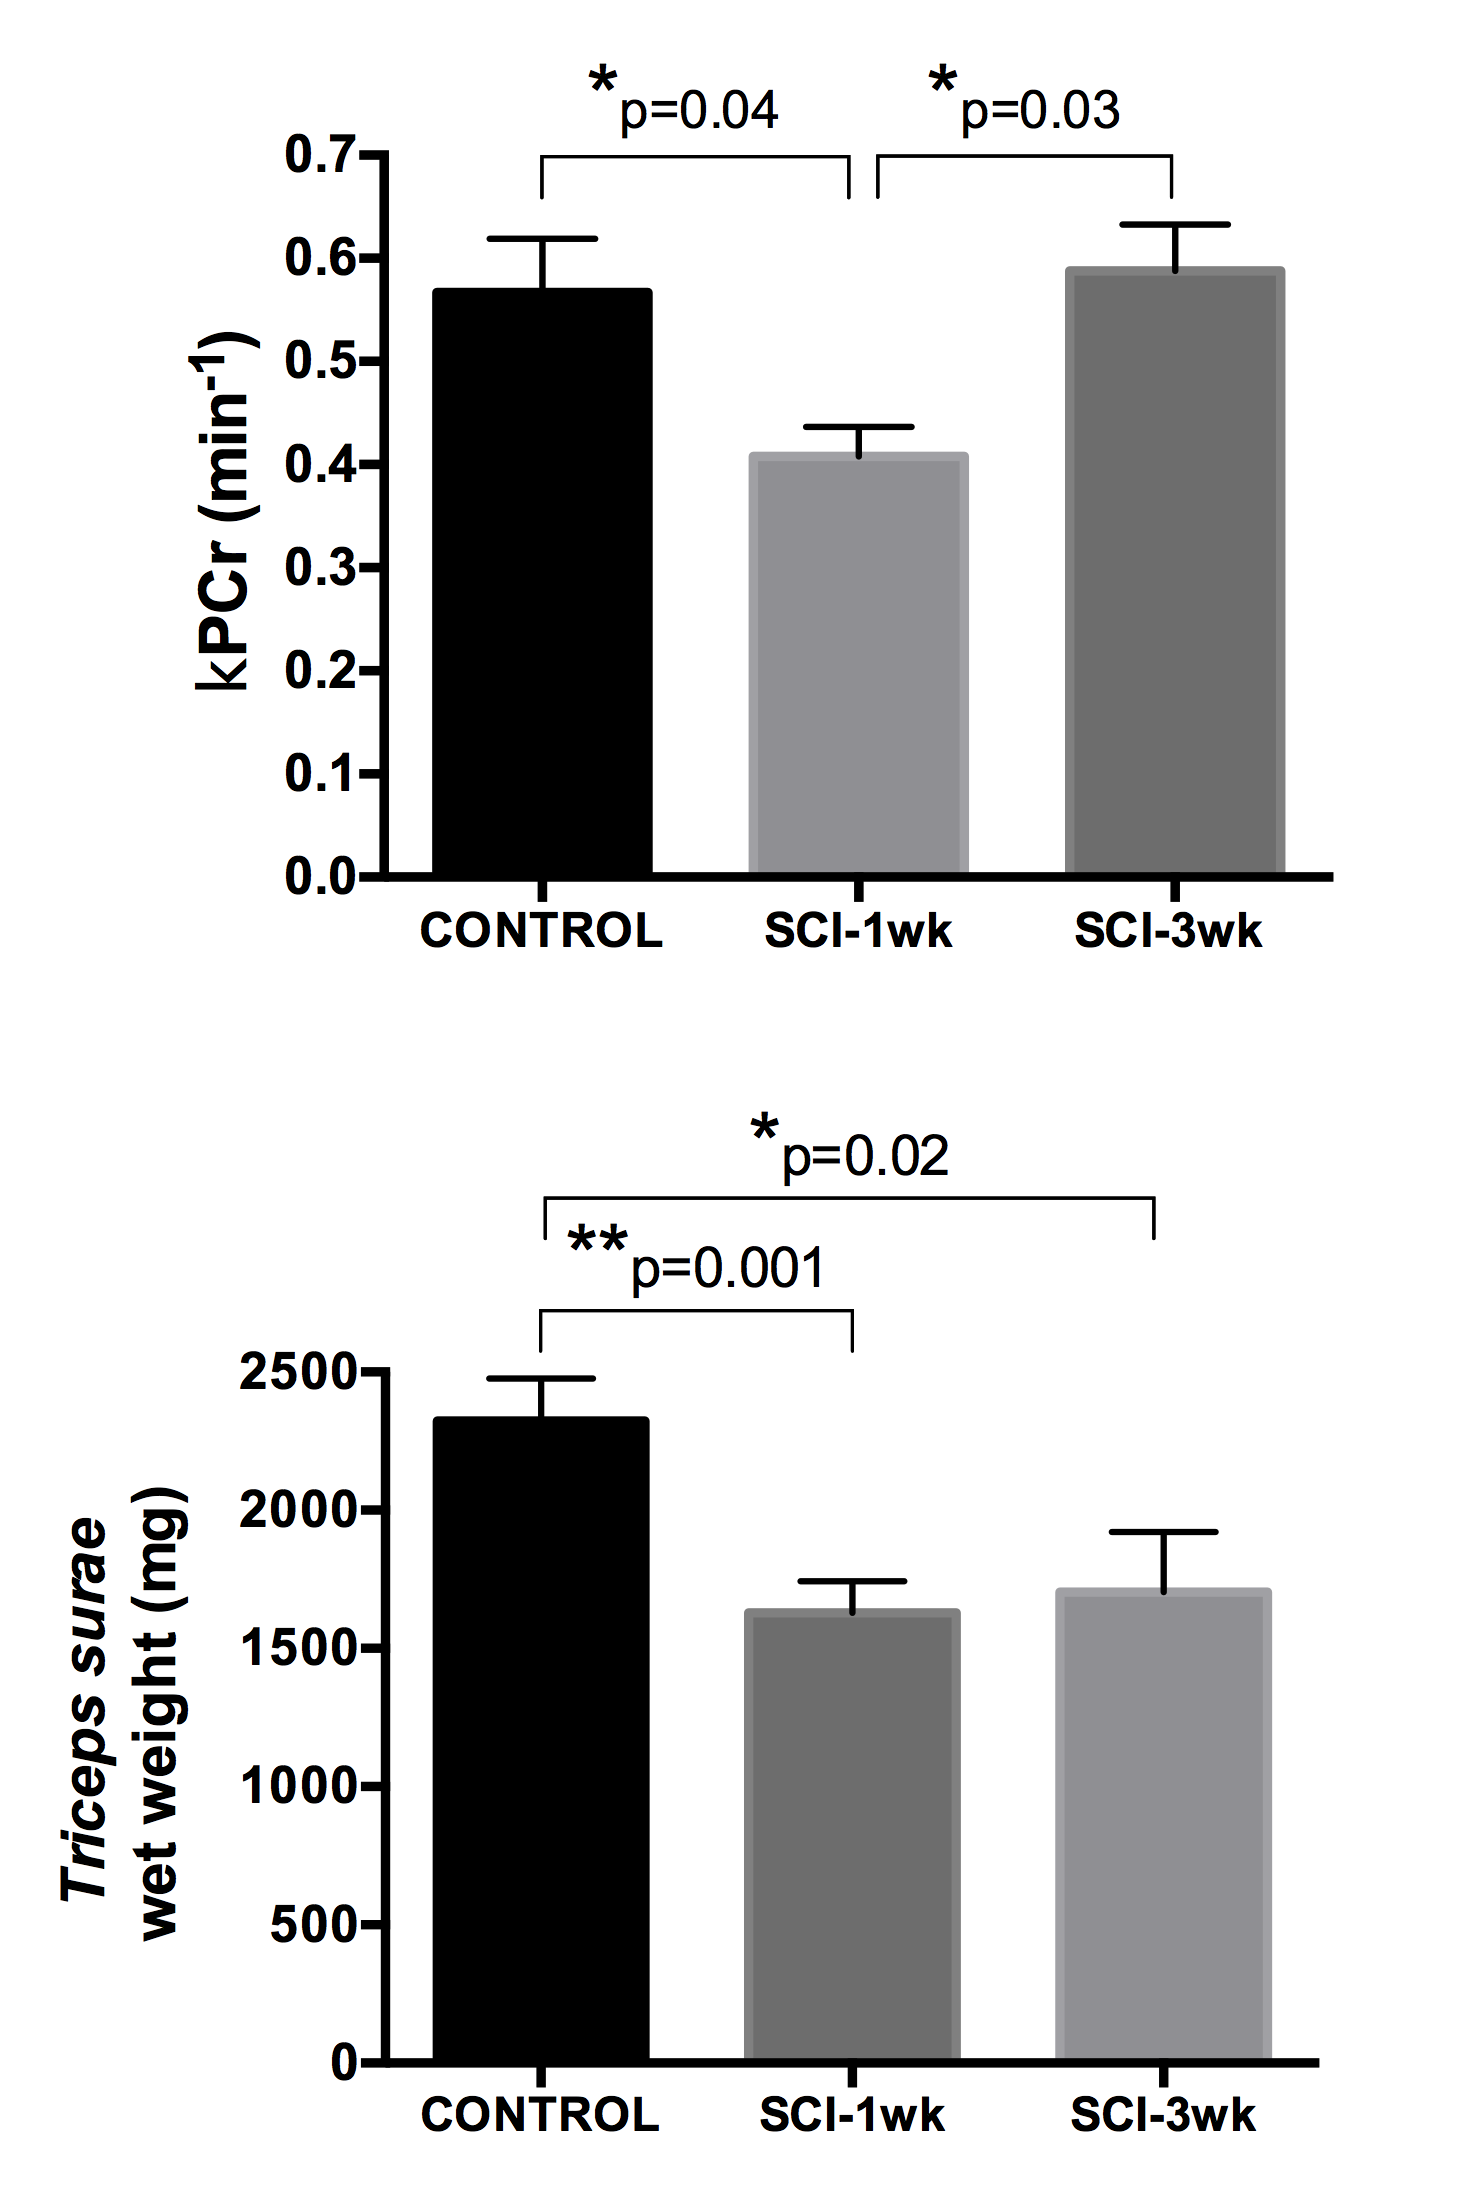
3) Severe SCI affects PCr kinetics post-exercise: We observed a significant decrease in kPCr in the SCI-1wk group as compared to controls (CTR: 0.57±0.16 min-1, SCI-1wk: 0.41±0.09 min-1; p<0.05) (Figure 2&3). The average muscle wet weight was significantly decreased by 30% in SCI-1wk (p= 0.001; Figure 3). While muscle wet weight remained significantly lower in SCI-3wk (p=0.02), kPCr returned within control values (0.59±0.1 min-1).
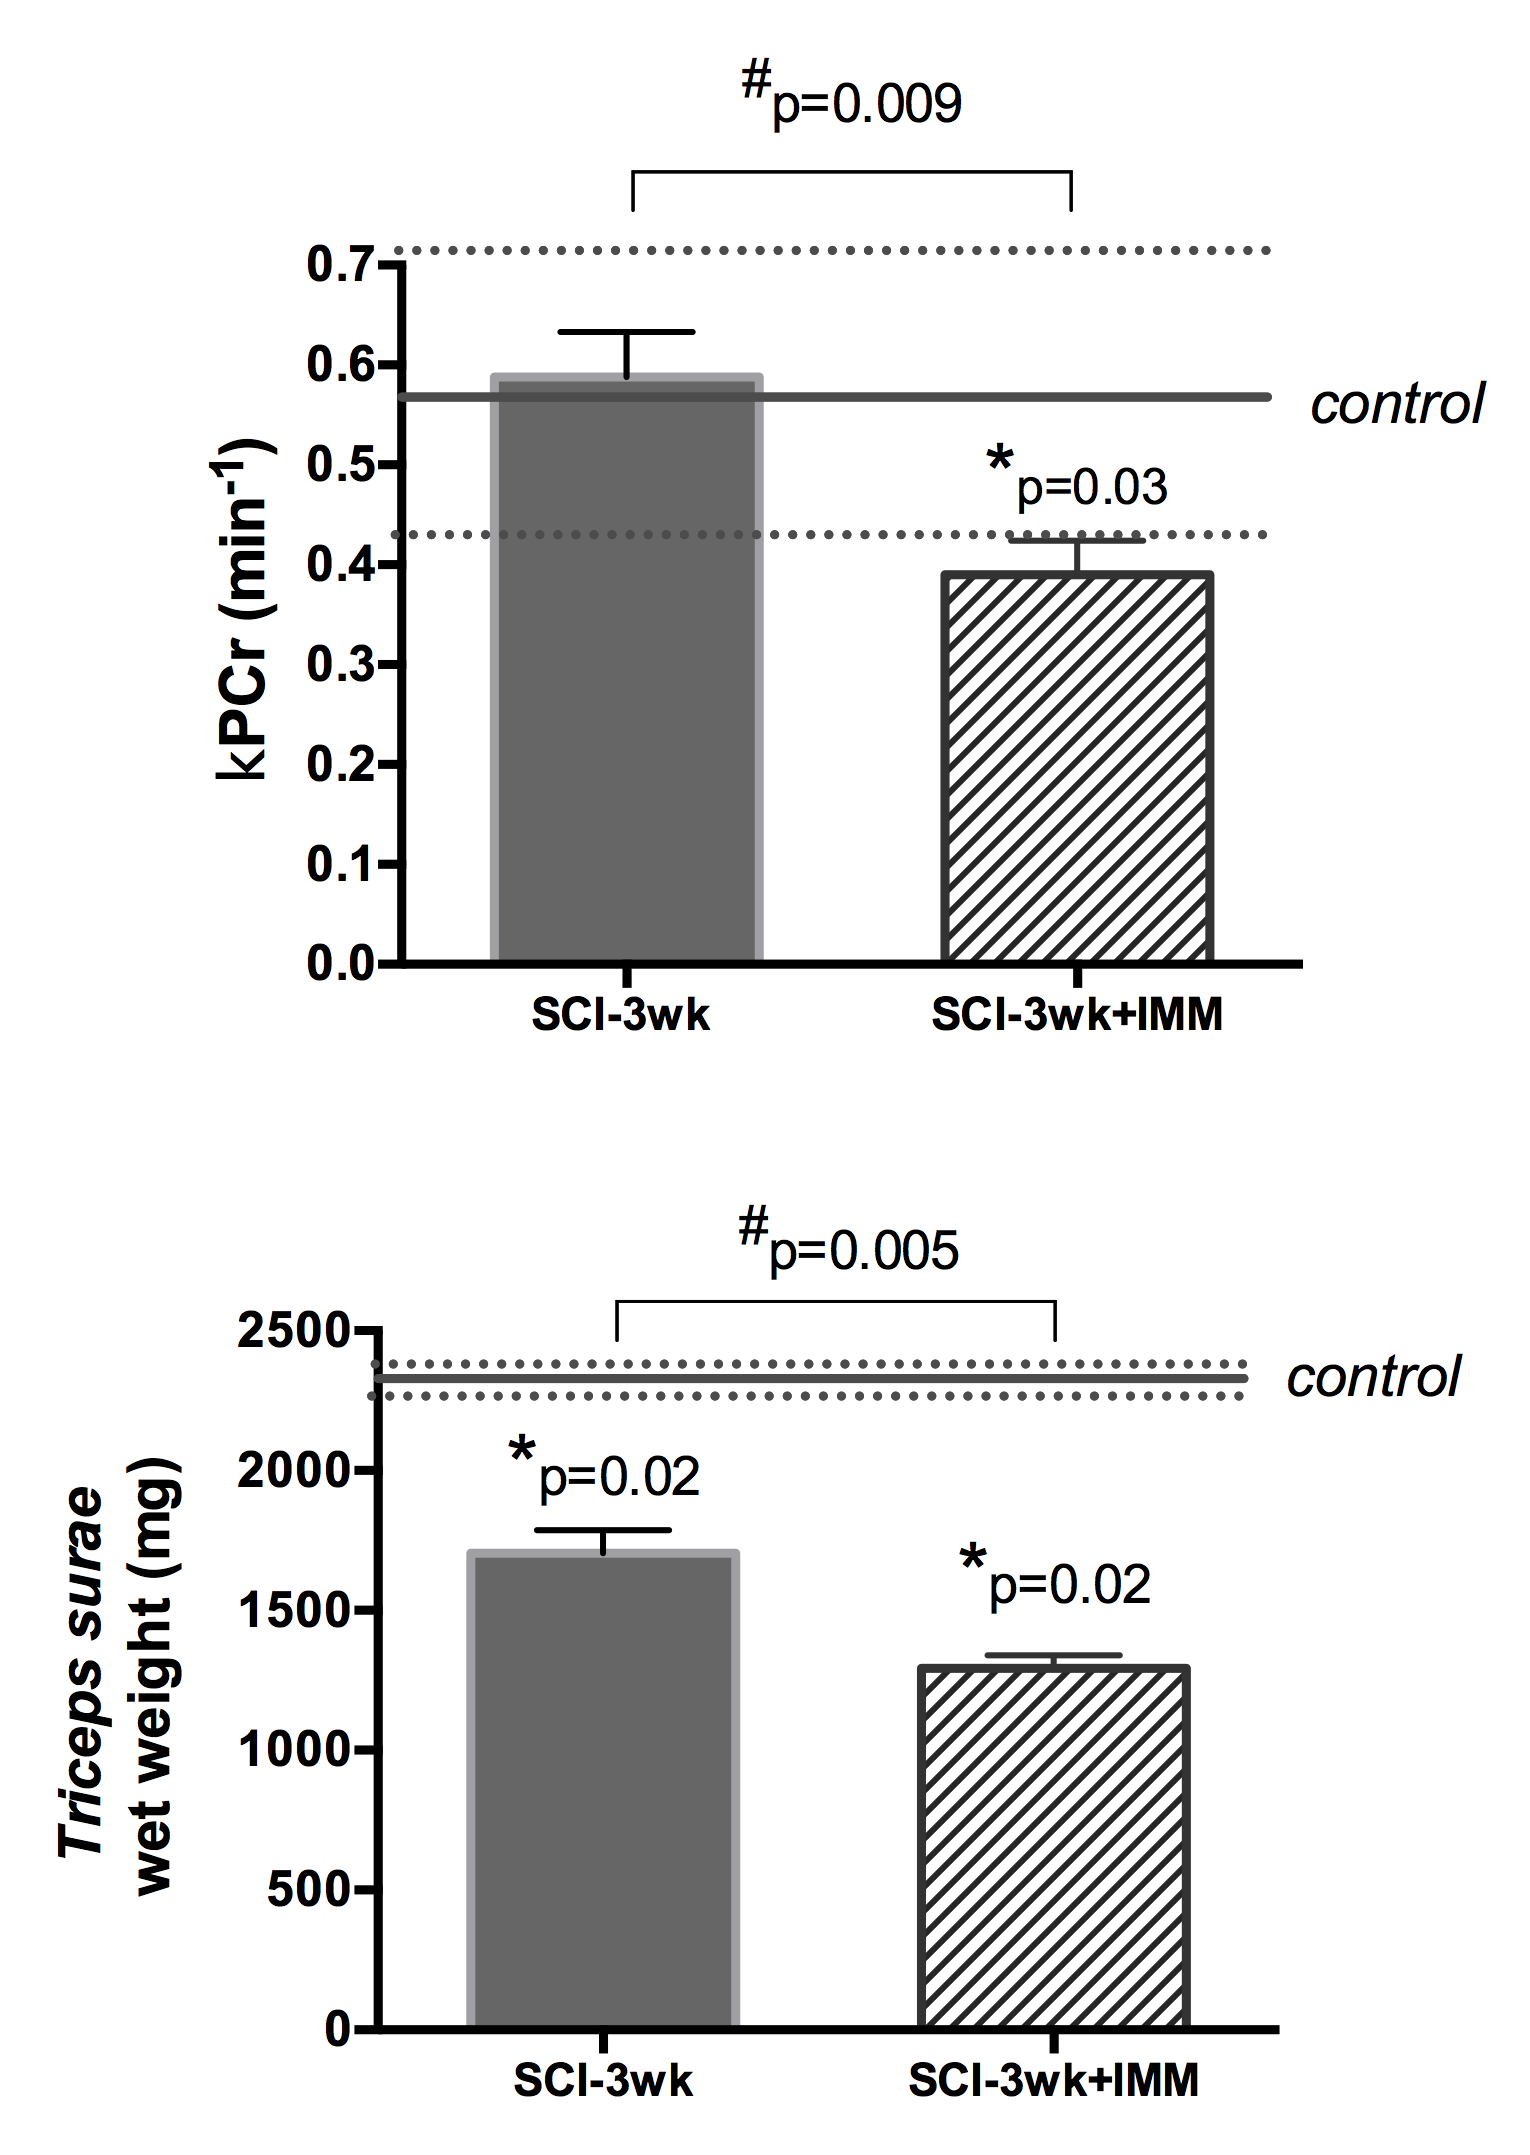
4) Cast immobilization prevents the recuperation of normal PCr kinetics after sSCI: Three weeks after sSCI, kPCr was significantly lower in SCI-3wk+IMM compared to CTR (0.39±0.08; p=0.02) and SCI-3wk (p=0.009; Figure 4). Muscle wet weight was further decreased in SCI-3wk+IMM compared to SCI-3wk (p=0.005).
CONCLUSION
For the first time, we characterized muscle exercise metabolism in vivo in a rat model of sSCI with restricted activity. Muscle mitochondrial oxidative capacity was strongly impaired 1 week after sSCI, similar to moderate SCI.6 While unconstrained activity allowed for full recovery of mitochondrial oxidative capacity within 3 weeks, we demonstrated that cast immobilization as a mean to restrict muscle activity significantly delayed the restoration of mitochondrial oxidative capacity. The metabolic characteristics of this new SCI model makes it better suited for preclinical research and implementation of rehabilitation strategies targeting mitochondrial function.Acknowledgements
The authors thank James Colee for statistical analysis. This work was supported by grants from the National Institutes of Health (PO1 HD059751-01A1), the United States Department of Veterans Affairs (VA Rehabilitation R&D Merit Review B5037R), and the National High Magnetic Field Laboratory.References
[1] Basso, D.M., Beattie, M.S. and Bresnahan, J.C. (1996). Graded histological and locomotor outcomes after spinal cord contusion using the NYU weight-drop device versus transection. Experimental neurology 139, 244-256.
[2] Fouad, K., Metz, G.A., Merkler, D., Dietz, V. and Schwab, M.E. (2000). Treadmill training in incomplete spinal cord injured rats. Behavioural brain research 115, 107-113.
[3] Liu, M., Bose, P., Walter, G.A., Thompson, F.J. and Vandenborne, K. (2008). A longitudinal study of skeletal muscle following spinal cord injury and locomotor training. Spinal cord 46, 488-493.
[4] Caudle, K.L., Brown, E.H., Shum-Siu, A., Burke, D.A., Magnuson, T.S., Voor, M.J. and Magnuson, D.S. (2011). Hindlimb immobilization in a wheelchair alters functional recovery following contusive spinal cord injury in the adult rat. Neurorehabilitation and neural repair 25, 729-739.
[5] Ye, F., Baligand, C., Keener, J.E., Vohra, R., Lim, W., Ruhella, A., Bose, P., Daniels, M., Walter, G.A., Thompson, F. and Vandenborne, K. (2013). Hindlimb muscle morphology and function in a new atrophy model combining spinal cord injury and cast immobilization. Journal of neurotrauma 30, 227-235.
[6] Shah PK, Ye F, Liu M, Jayaraman A, Baligand C, Walter G, Vandenborne K. In-Vivo 31P NMR Spectroscopy Assessment of Skeletal Muscle Bioenergetics after Spinal Cord Contusion in Rats. European journal of applied physiology. 2014;114(4):847-858. doi:10.1007/s00421-013-2810-9.
[7] Taylor, D.J., Bore, P.J., Styles, P., Gadian, D.G. and Radda, G.K. (1983). Bioenergetics of intact human muscle. A 31P nuclear magnetic resonance study. Molecular biology & medicine 1, 77-94
Figures