3895
Investigation of ethanol stimulation on HepG2 cells in a high density cell culture on chip by correlation spectroscopy1Computer Assisted Clinical Medicine, Heidelberg University, Mannheim, Germany, 2Institute of Functional Interfaces, Karlsruhe Institute of Technology, Karlsruhe, Germany
Synopsis
Ethanol-induced toxicity leads to alterations of certain cellular functions such as mitochondrial dysfunction. This study investigated the feasibility to detect changes induced by 2‰ ethanol stimulation on HepG2 cells in an NMR-compatible bioreactor system by double quantum filtered correlation spectroscopy. During ethanol stimulation, the spectra with cells led to an increased SNR of the glucose (15.5±2.1 %) and lactic acid (10.8%) cross peaks. These changes were larger than the SNR reproducibility of (3.94±2.44)%. Our results show that the DQF-COSY sequence can be used for the investigation of ethanol-induced damage on cells in a bioreactor system (worse shim condition).
Purpose:
Ethanol consumption is a major world health problem1. The liver mainly degrades ethanol causing the inhibition of lipid peroxidation, damage to the mitochondria1 as side effects. The use of an NMR-compatible bioreactor2 allows for non-invasive monitoring of cellular changes in a well-controlled environment without a biopsy3. However, proton spectroscopy of such a bioreactor system is challenging because of large magnetic susceptibility differences (worse shim condition) and large plastic signals. To cope with this double quantum filtered correlation spectroscopy (DQF-COSY), shim-independent water suppression, can be used. This study evaluated the feasibility to detect ethanol-induced alterations on liver cancer cells (HepG2) in a bioreactor system with a high density 3D cell culture on chip by DQF-COSY.Material and Methods:
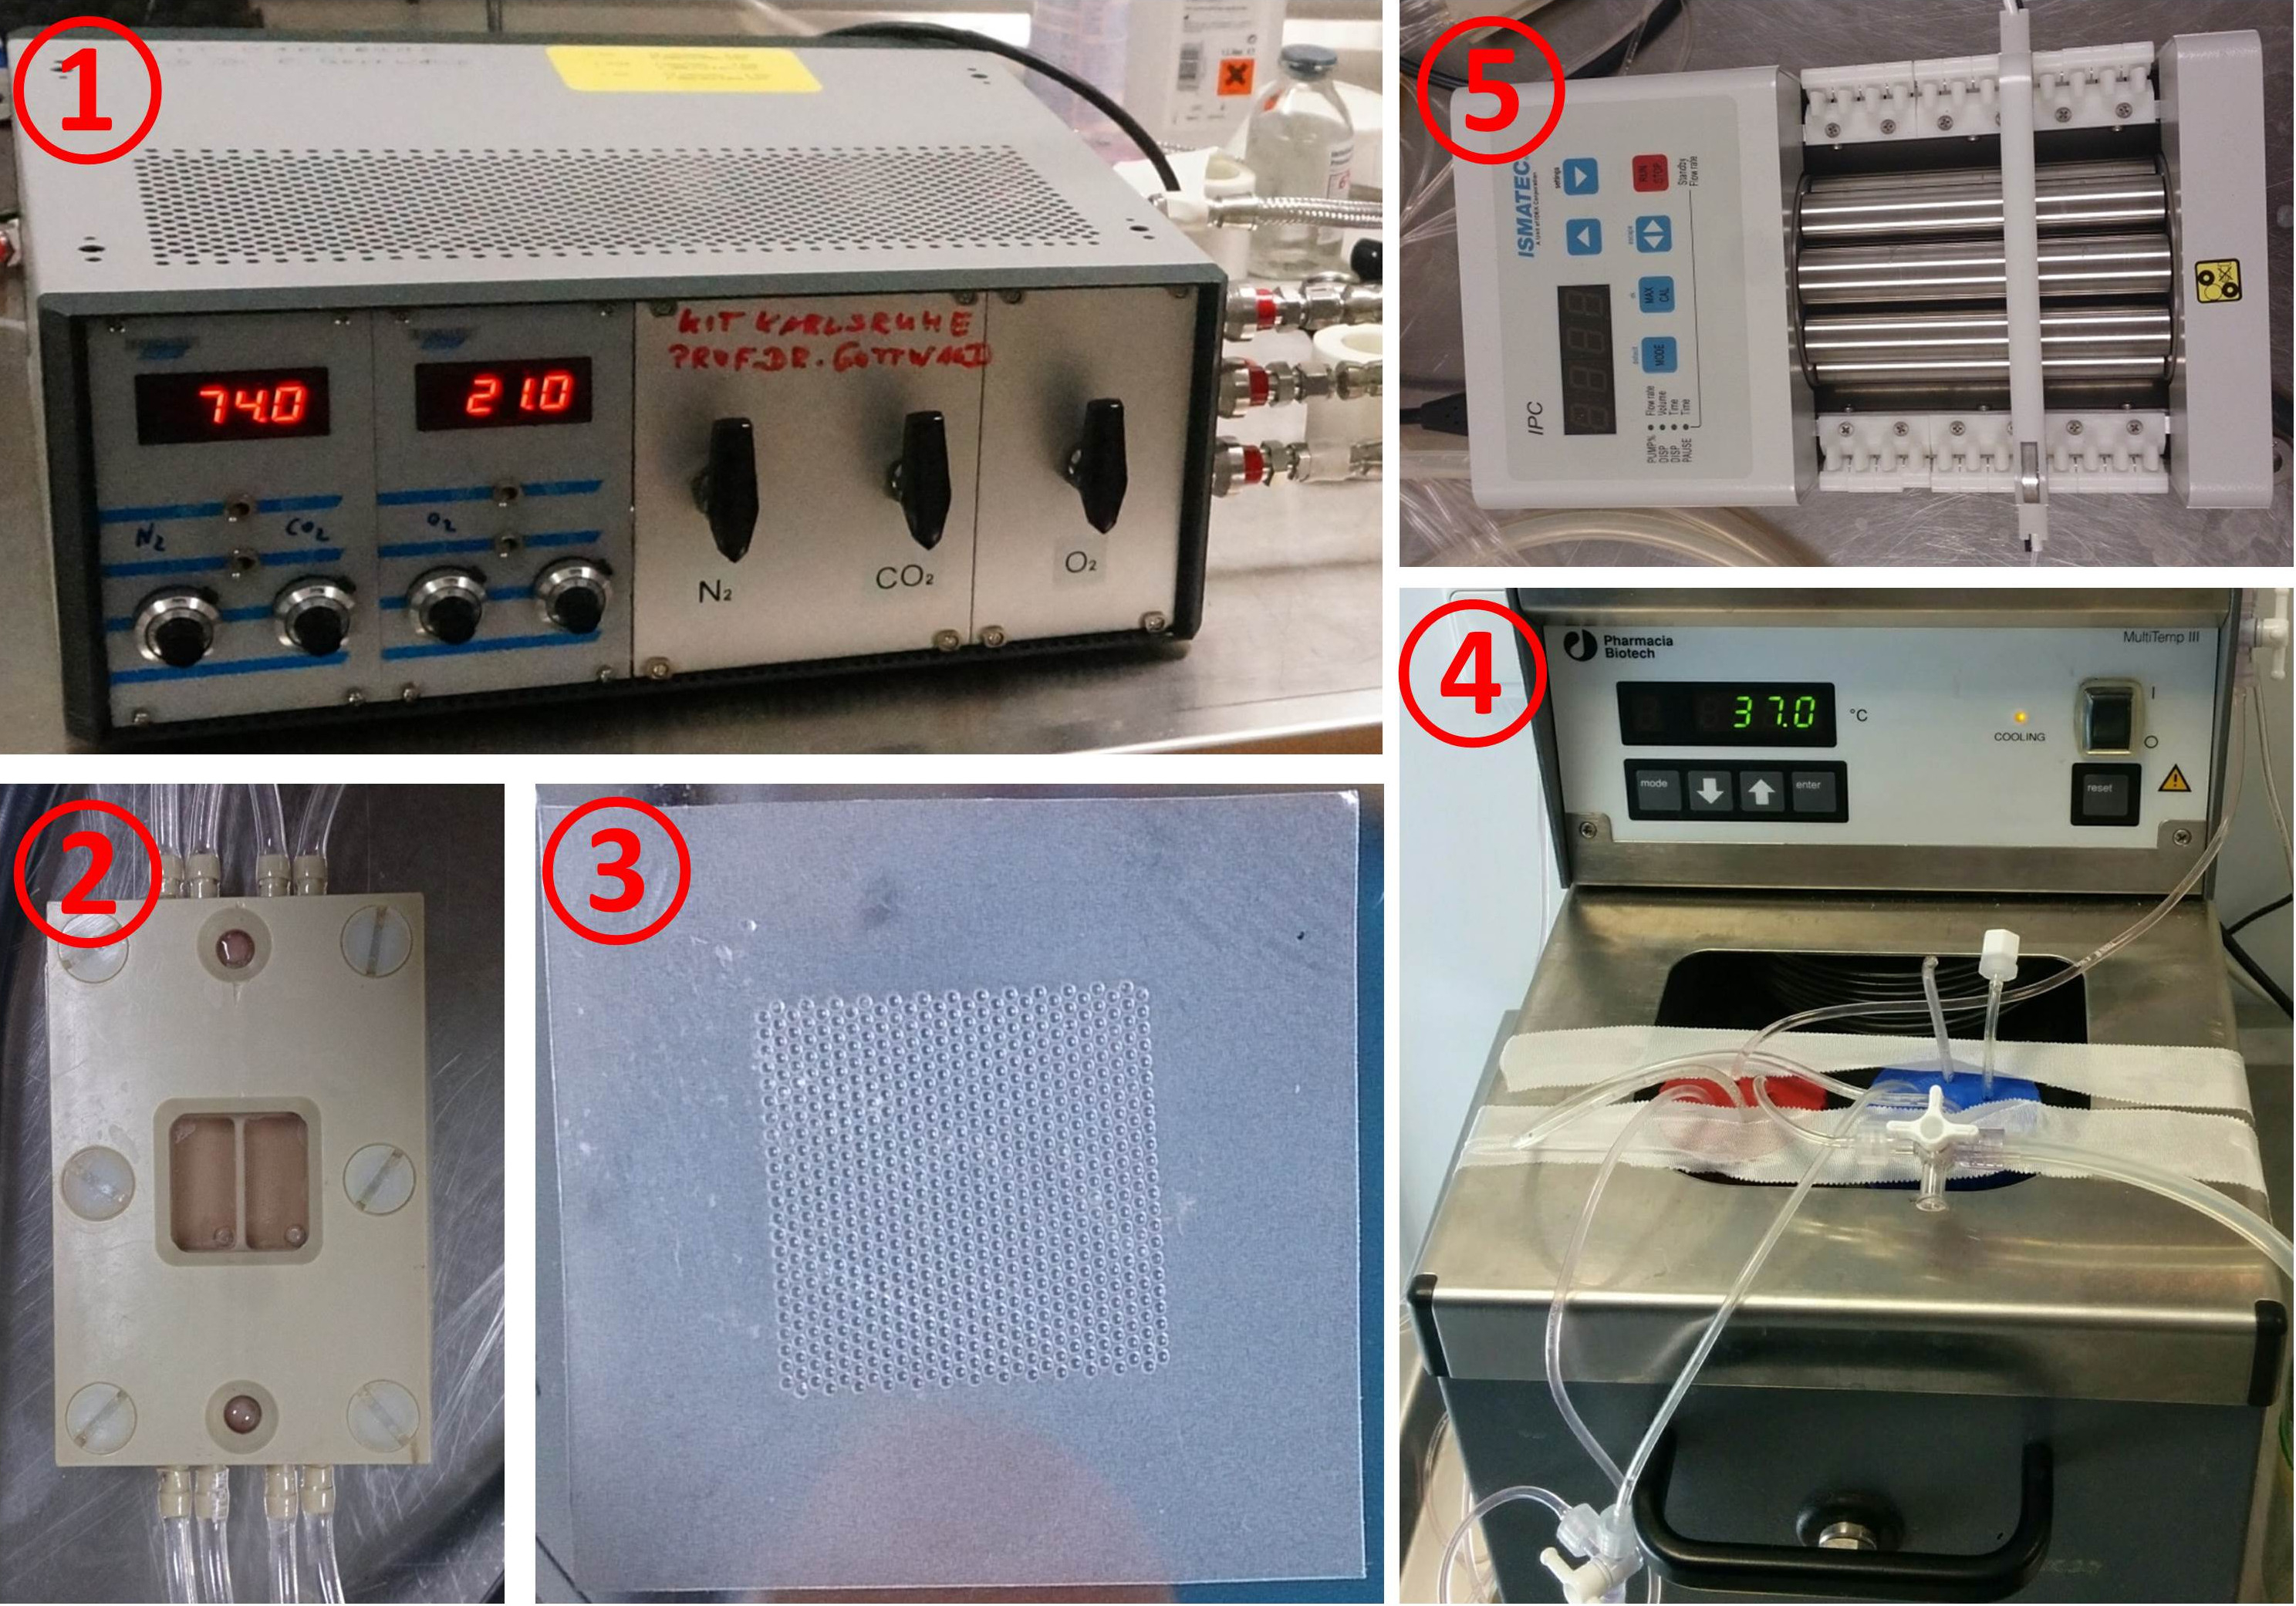
Experiments were carried out on a 9.4T preclinical small animal scanner (Bruker Biospec 94/20, Ettlingen, Germany) using ParaVision 6.0.1 with a linear volume coil (transmit-only) and a rat surface coil (receive-only) both by Bruker. The bioreactor2 which contained a 3D culture in a microcavity area (DYNARRAYS(R)) separated into two compartments was actively perfused (400μl/min) under normoxic conditions (Fig.1). The heating baths maintained the bioreactor system at a temperature of 37°C. The HepG2 cells (ATCC HB-8065, Manassas, USA) were prepared according to2,4,5. Addition of 2‰ ethanol to the cell medium achieved the ethanol stimulation.
The DQF-COSY sequence used a 90°-90°-180°-90°-180° pulse scheme with block pulses. The minimal delay was set to 4μs and three sinusoidal gradients with 2ms duration (+ 100μs ring down delay) and 20%/40% strength selected the double quantum coherence. An eight step phase cycle6,7 eliminated rapid pulsing artefacts. Scan parameters were: TR = 3s, 2048 points, 8 averages, Δτ = 113.6μs, 756 t1 increments with time proportional phase incrementation.
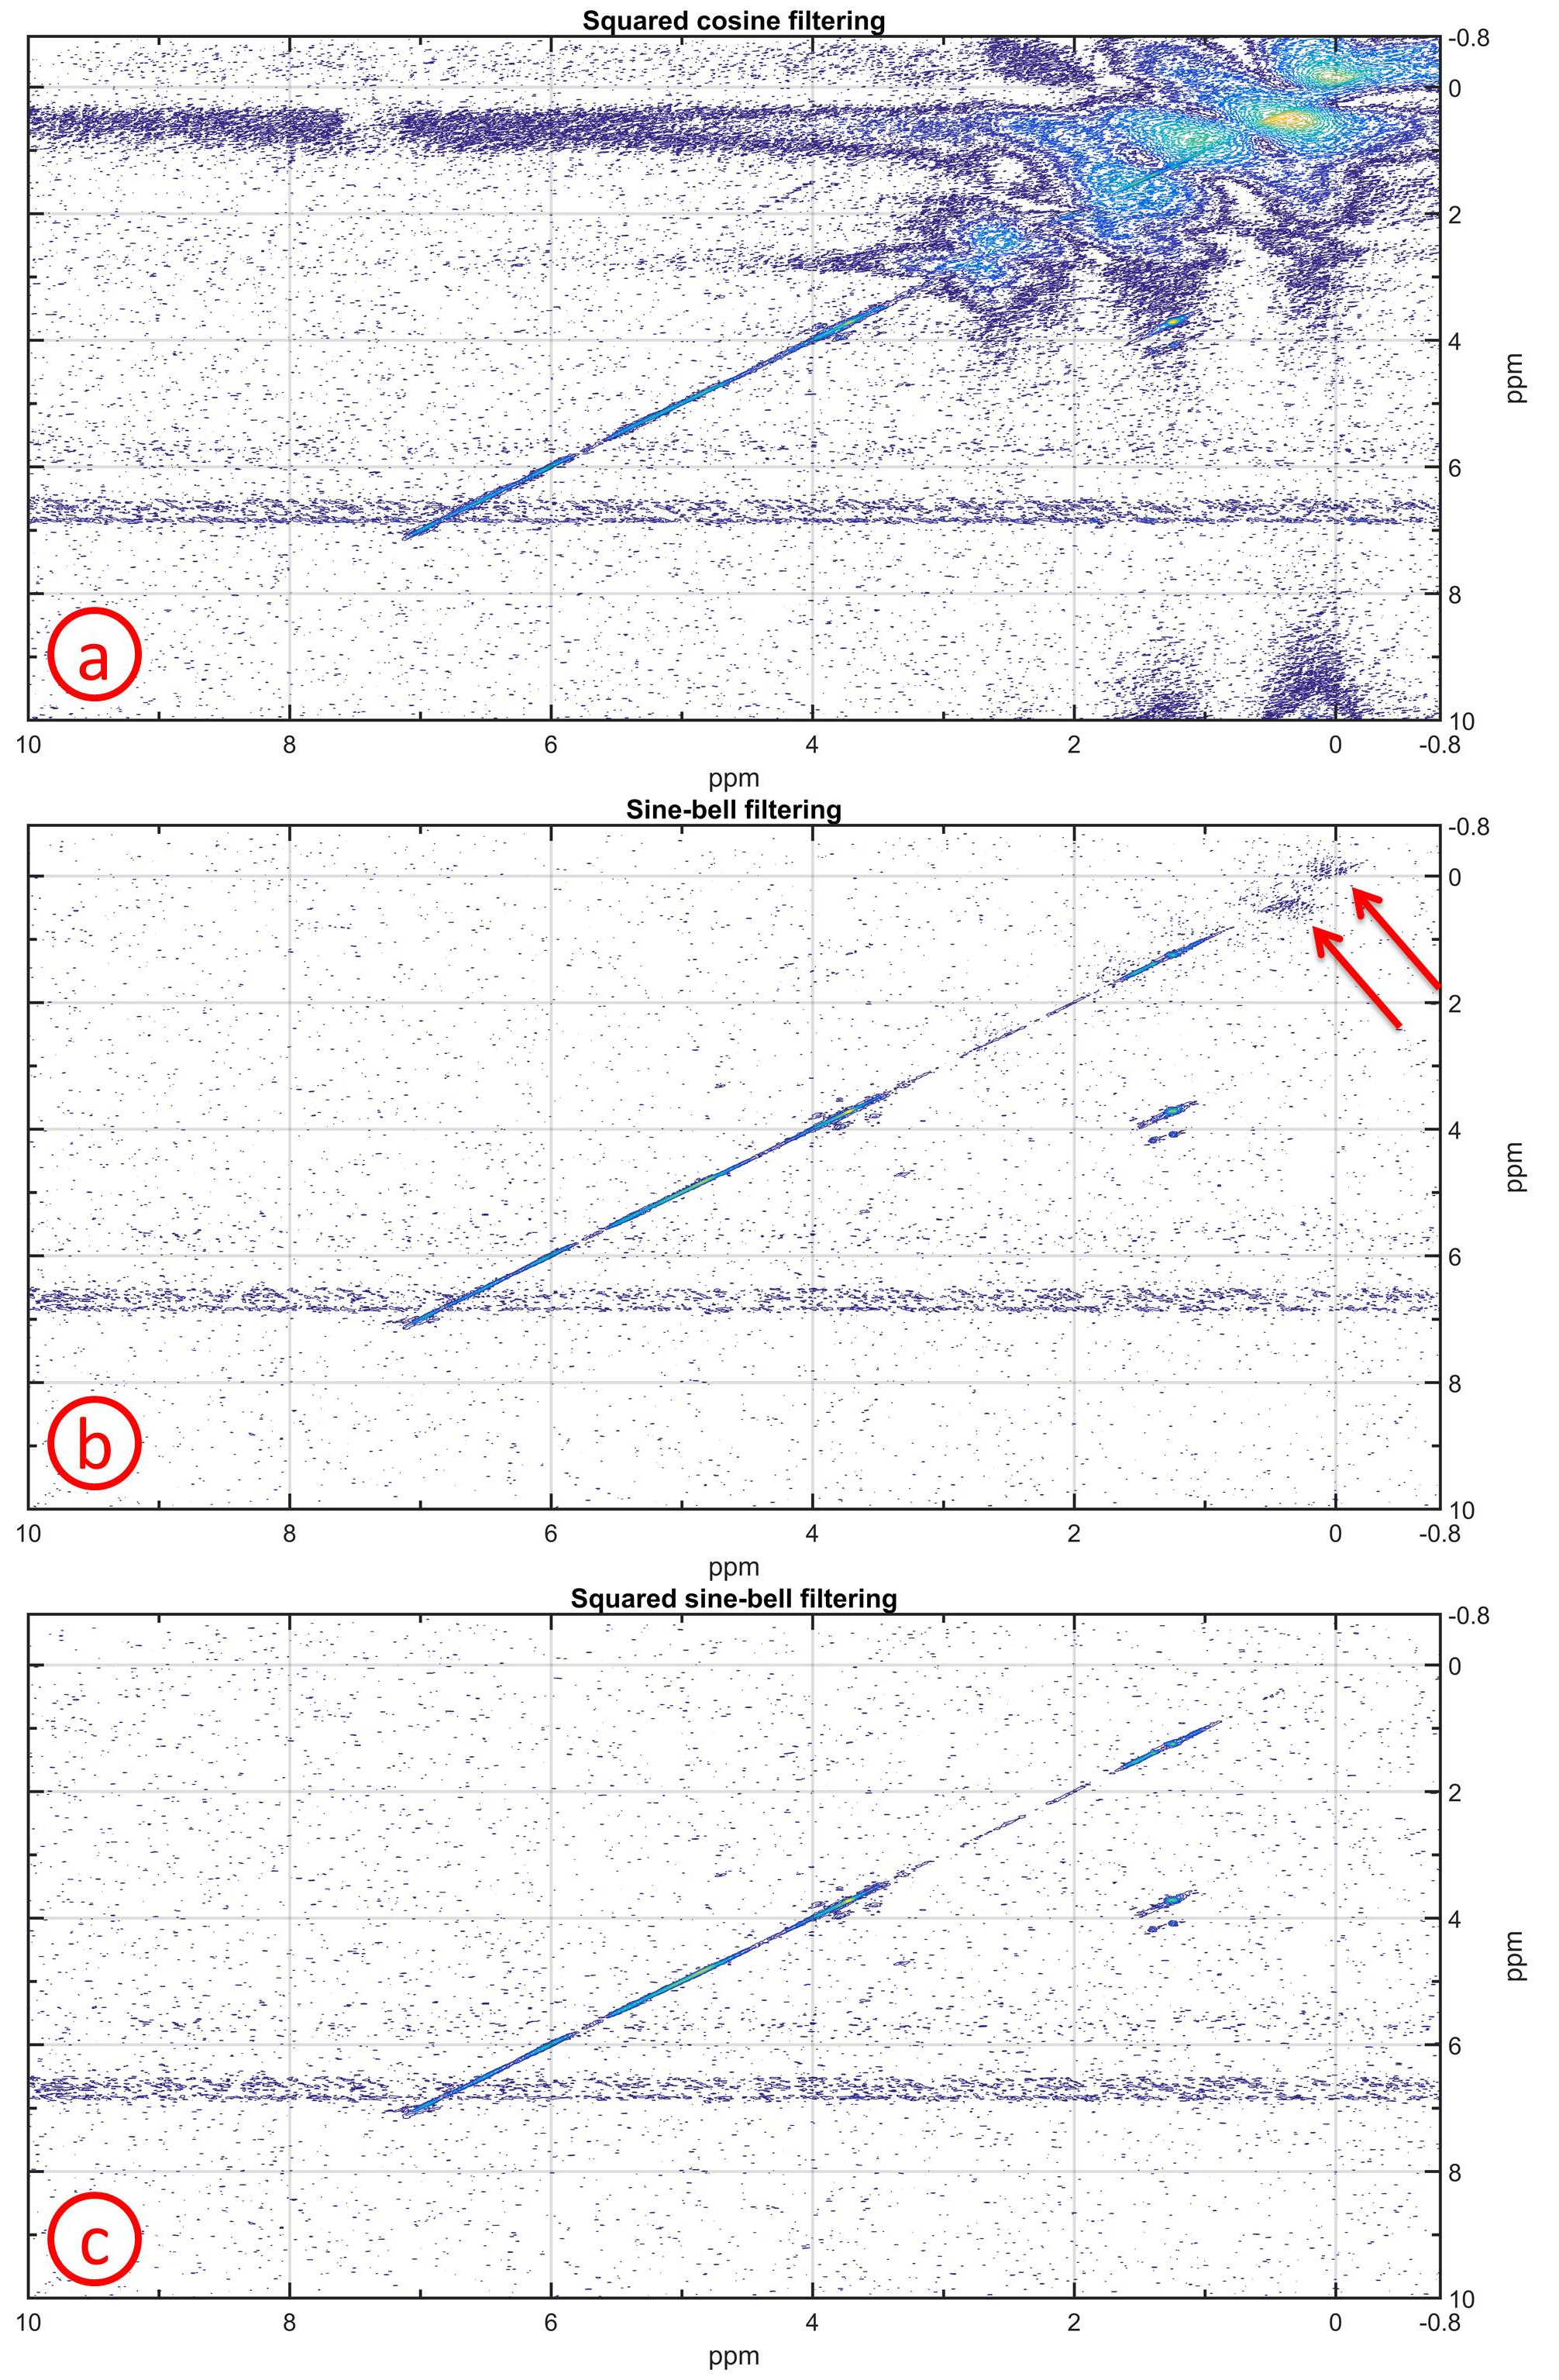
The large amount of plastic signals from the bioreactor housing (polyether ether ketone) and the DYNARRAYS(R) (polycarbonate) distorted the spectra. To remove these unwanted spectral peaks, different filtering functions (squared cosine, unshifted sine-bell and unshifted squared sine-bell) in the t1 dimension were evaluated by using the spectrum of the cells with ethanol cell medium. For the t2 dimension, the squared cosine filtering was used.
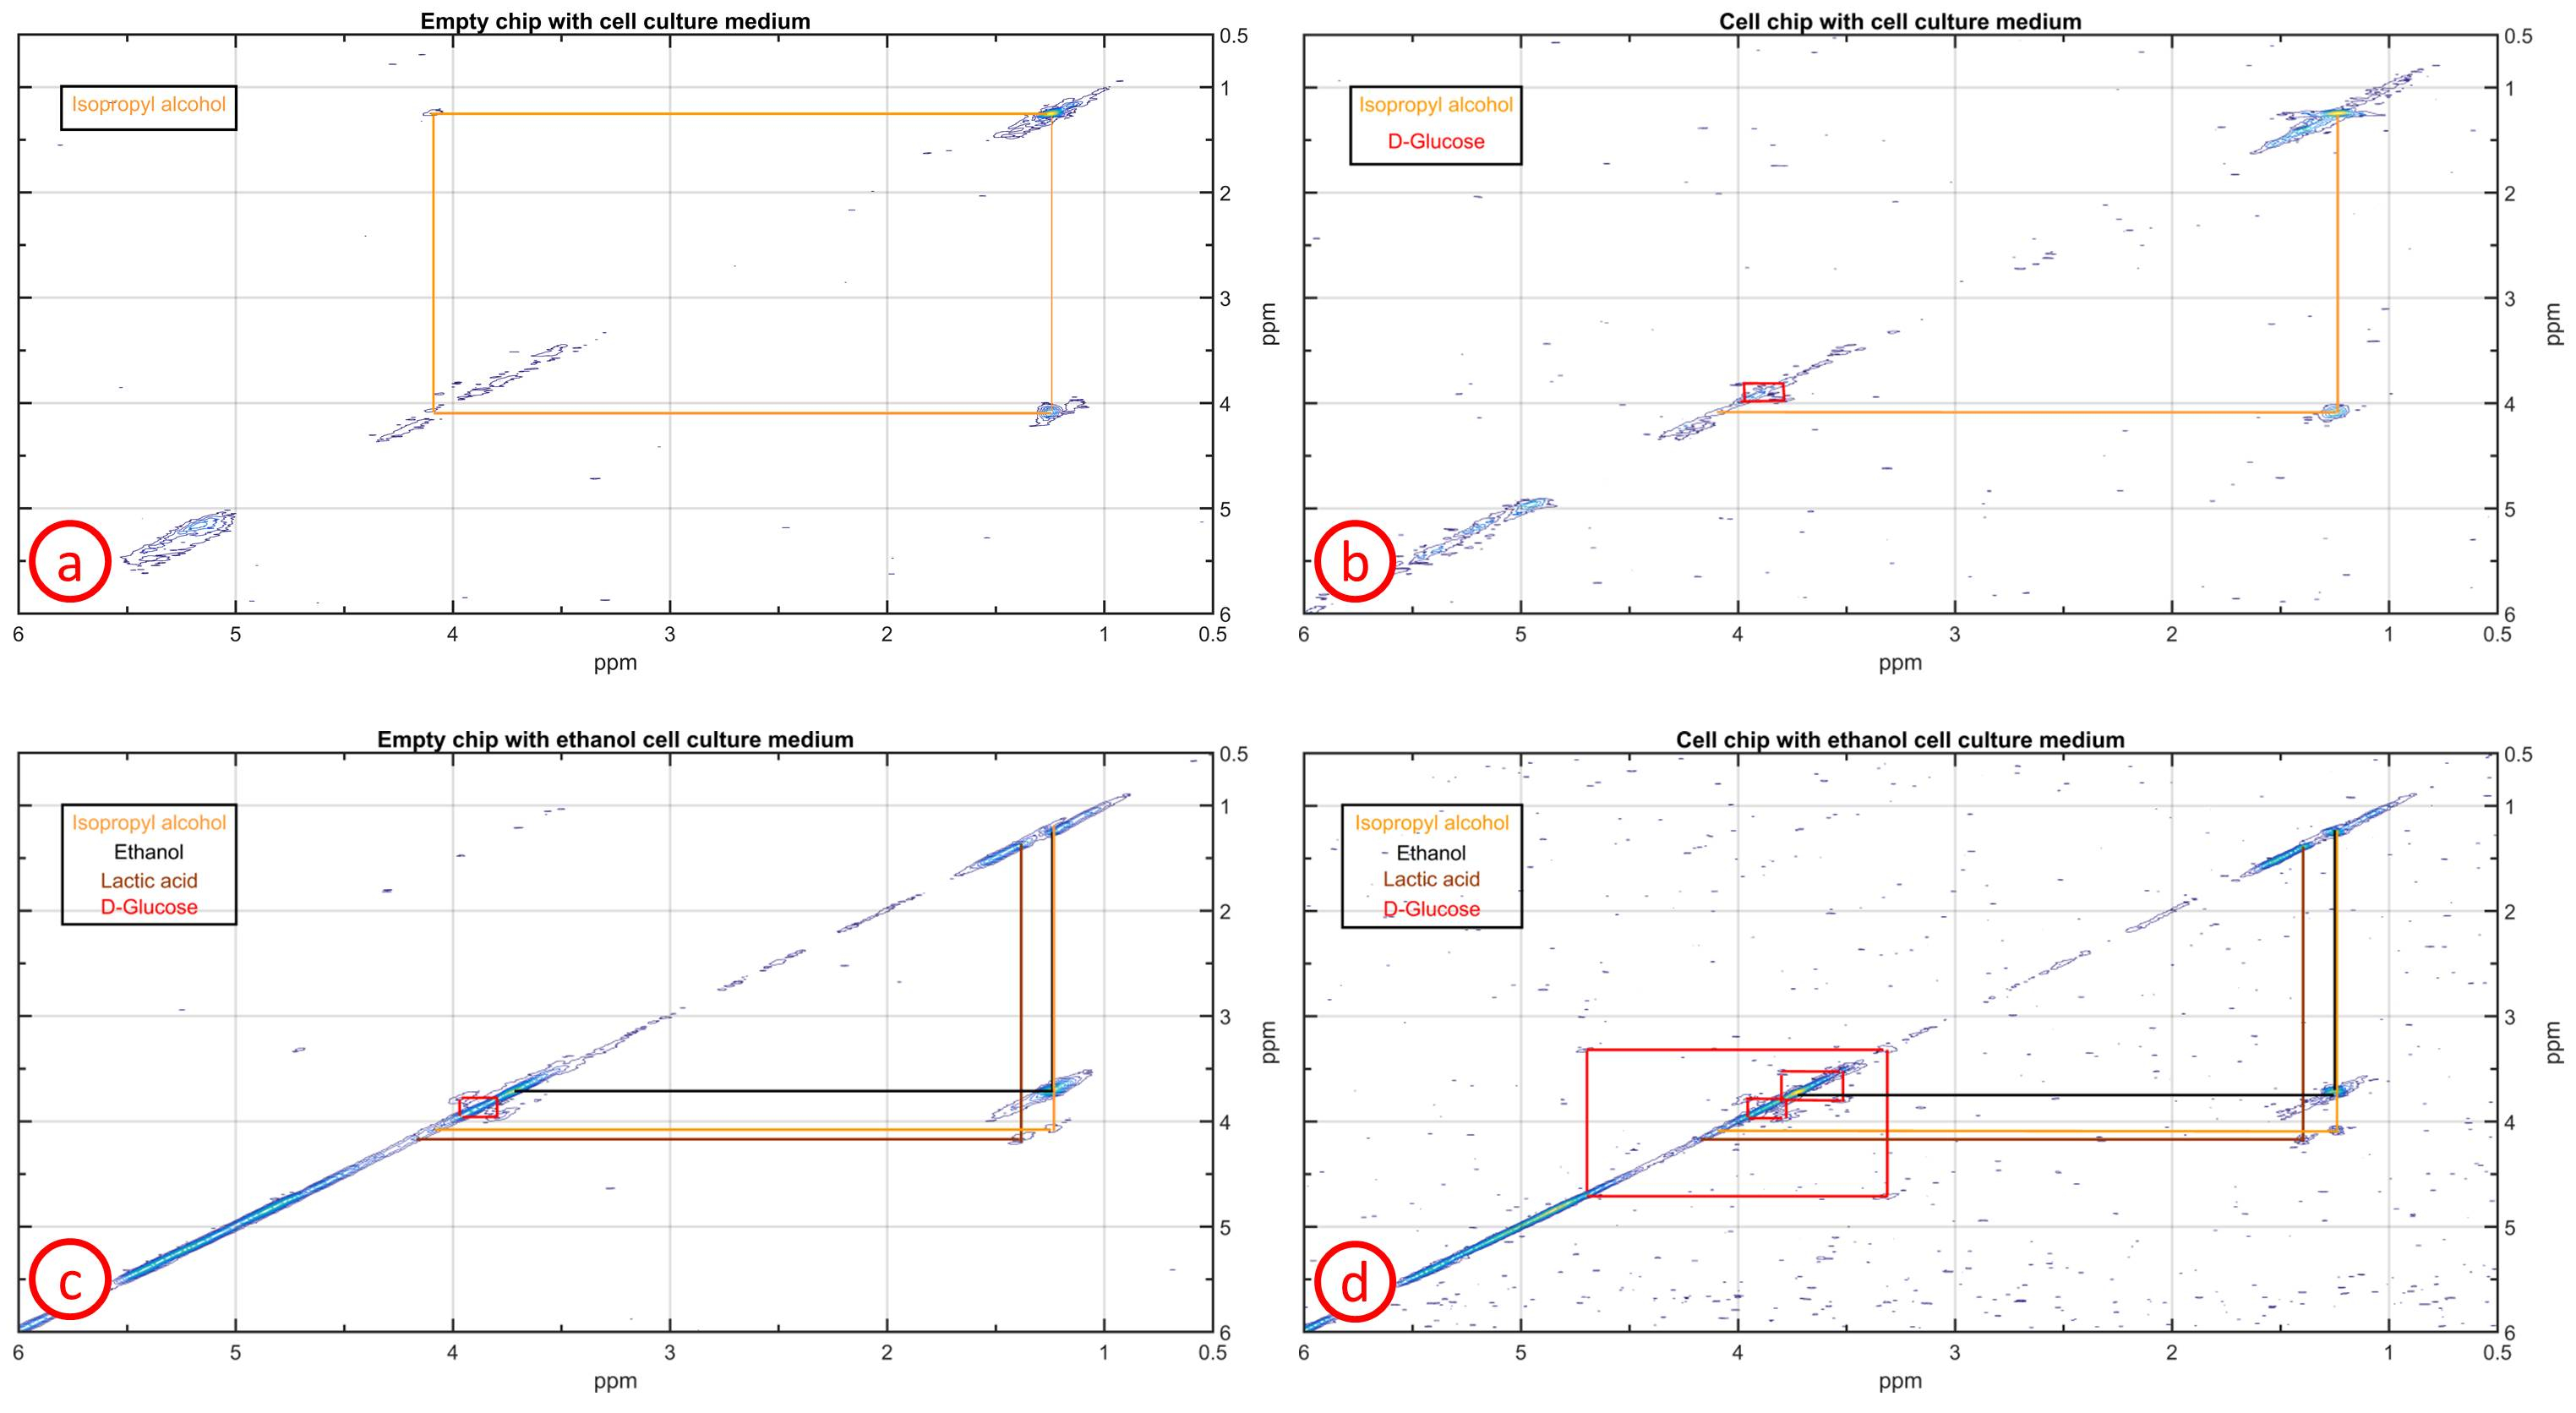
For the identification of ethanol-induced alterations on the cells, four different spectra were measured: no cells with cell medium, cells with cell medium, cells with ethanol cell medium (6h stimulation) and no cells with ethanol cell medium. The latter was repeated to determine the reproducibility of the cross peak signal to noise ratio (SNR). Integrating the complete cross peak divided by the standard deviation of noise calculated from a signal free region determined the SNR of the cross peak. The SNR change between the spectra with and without cells was referenced to the spectrum without cells. A standard deviation of the SNR change was calculated when both cross peaks were visible in both spectra. For the analysis of the spectra, Matlab R2015a (The MathWorks Inc, Natick, Massachusetts USA) was used.
Results and Discussion:
The squared cosine filtering did not remove the plastic signals making the identification of cross peaks in most parts of the spectrum impossible (Fig.2a). The unshifted sine-bell filtering eliminated nearly all plastic signals except some residues between 0-1 ppm (Fig.2b). The unshifted squared sine-bell filtering was optimal for removing all plastic signals (Fig.2c). The plastic signals passed through the sequence only at the first t1 increments whereas at later t1 increments the magnetization had already decayed. Therefore, the unshifted squared sine-bell filtering was optimal.
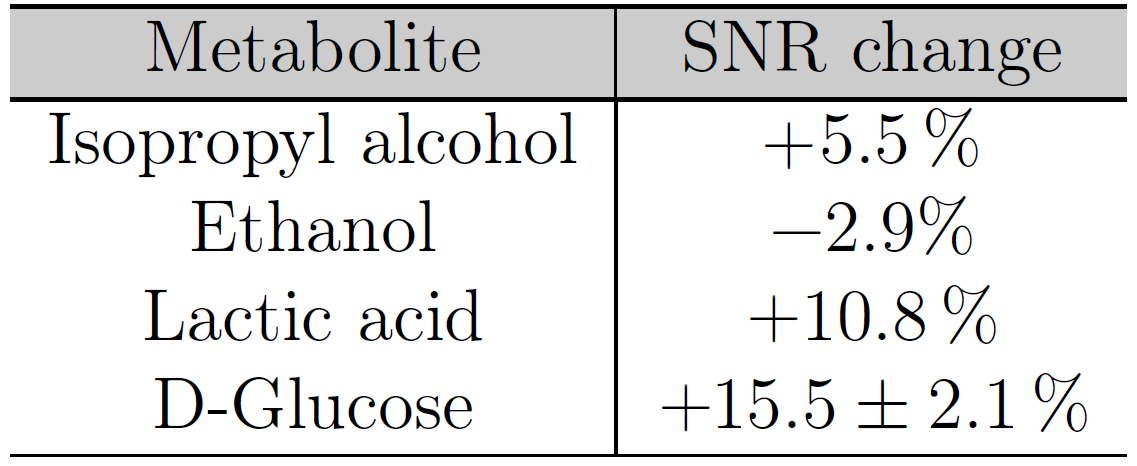
In the spectrum with cells two glucose and one isopropyl alcohol cross peaks could be identified whereas in the spectrum without cells only two isopropyl cross peaks were visible (Fig.3a and Fig.3b). The ethanol stimulation improved the overall signal strength leading to a lactic acid cross peak and two more glucose cross peaks (only with cells), Fig.3c and Fig.3d. The cross peak SNR between both ethanol spectra changed by 10.8% (lactic acid) and (15.5±2.1)% (glucose), see Table 1. These changes were larger than the SNR change of (3.94±2.44)% between two succeeding scans (SNR reproducibility). Glycogenesis8 and a high metabolic rate can lead to a glucose SNR increase. Ethanol-induced damage1 might explain the lactic acid increase but ethanol degradation9 and the high metabolic rate also increase the lactic acid concentration.
Conclusion:
Our results indicate that the DQF-COSY sequence allows for the detection of SNR alterations in the bioreactor system with an excellent reproducibility. But ethanol-induced damage was not the only reason for these alterations. By improving the sensitivity of the sequence and acquiring two additional spectra after the ethanol stimulation, ethanol-induced damage might be identified without disturbing the biological environment.Acknowledgements
This work was carried out with the support of the Karlsruhe Nano Micro Facility (KNMF, www.kit.edu/knmf ), a Helmholtz Research Infrastructure at Karlsruhe Institute of Technology (KIT, www.kit.edu ).References
1. Manzo-Avalos S, et al., Cellular and Mitochondrial Effects of Alcohol Consumption. Int J Environ Res Public Health, 2010;7:4281–4304.
2. Gottwald E, et al., Characterization of a chip-based bioreactor for three-dimensional cell cultivation via Magnetic Resonance Imaging. Z Med Phys, 2013;23:102-110.
3. Fernando H, et al., Lipidomic changes in rat liver after long-term exposure to ethanol. Toxicol Appl Pharmacol 2011;255:127–137.
4. Gottwald E, et al., A chip-based platform for the in vitro generation of tissues in three-dimensional organization. Lab Chip, 2007;7:777-785.
5. Altmann B, et al., The three-dimensional cultivation of the carcinoma cell line HepG2 in a perfused chip system leads to more differentiated phenotype of the cells compared to monolayer culture. Biomed Mater, 2008;3:034120.
6. Derome A, et al., Rapid-pulsing artifacts in double-quantum-filtered COSY. J Magn Reson, 1990;88: 177–185.
7. Vanzijl P, et al., Magic-Angle-Gradient Double-Quantum-Filtered COSY. J Magn Reson Series A, 1995;113:265–270.
8. Okamoto T, et al., Establishment and characterization of a novel method for evaluating gluconeogenesis using hepatic cell lines, H4IIE and HepG2. Arch Biochem Biophys 2009;491:46–52.
9. Tymoczko J, et al., Biochemistry. A short course. WH Freeman, 2015; 3rd edition.
Figures