3892
Shorter apparent T2 relaxation times of metabolites in the older human brain1University of Minnesota, Minneapolis, MN, United States, 2Veterans Affairs Health Care System, Minneapolis, MN, United States
Synopsis
The goal of this study was to compare the apparent transverse relaxation time constants (T2) of metabolites obtained in young and older subjects in three brain regions (occipital cortex (OCC), posterior cingulate cortex (PCC) and prefrontal cortex (PFC)) using LASER at 3T. A lower apparent T2s of N-acetyl aspartate and tissue water were measured in older adults in all three regions. T2 for total creatine and myo-inositol were also shorter in older adults in OCC and PCC. In conclusion, differences in T2 values of metabolites during normal brain aging are region-dependent.
Purpose
Proton magnetic resonance spectroscopy (1H MRS) is a noninvasive technique that allows the measurement of various metabolites in the brain in vivo. These MR visible metabolites are located in the intracellular compartments. Using transverse relaxometry technique, the cellular microenvironment of these metabolites can be examined. During normal aging, the human brain undergoes both molecular to morphological changes1. As such, several studies have reported the transverse relaxation time constants (T2) of several metabolites with contradicting results in the aging brain2-4. We previously showed that reliable T2 of N-acetyl aspartate (NAA), total creatine (tCr) and total choline (tCho) can be measured at high-field strength and these values were shorter in older adult by 10 to 23% in the occipital cortex (OCC)5. Since it is known that structural and neurochemical changes vary between brain regions, there is a need to investigate if T2 changes are also regional. Therefore, the aim of this study was to compare the T2 relaxation times of the five major metabolites and tissue water in the human brain between young and older adults in the OCC, posterior cingulate (PCC) and prefrontal (PFC) cortices.Methods
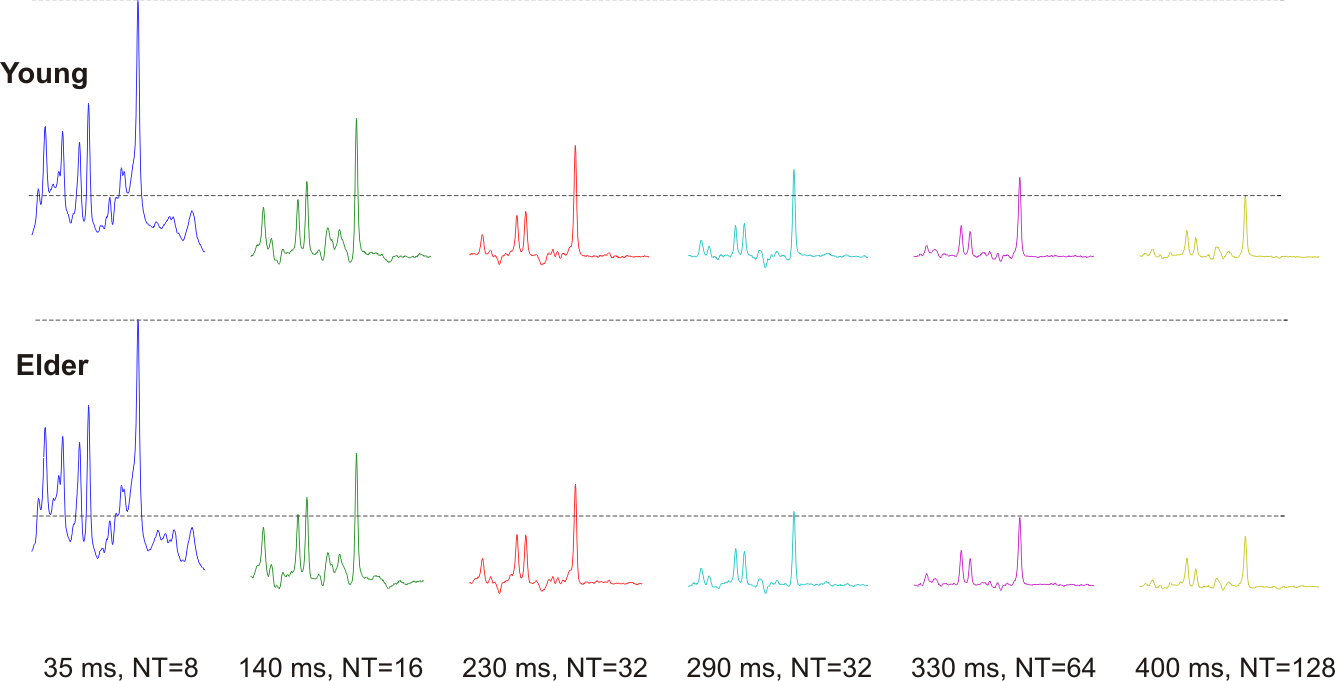
31 young (21 ± 1 years) and 25 older (74 ± 3 years) adults were scanned on a Siemens 3 T scanner after giving informed consent for the study approved by the IRB. Body coil was used for excitation while the 32-channel receive-only head-coil was used for signal reception. Localized spectra were measured using LASER6 from three VOIs: PFC (15.6 mL), PCC (15.6 mL) and OCC (15.9 mL). Data were acquired at six different TEs (35, 140, 230, 290, 330, 400 ms with different averages (Figure 1)) to measure the T2 relaxation of metabolites. Water reference scans were also acquired for eddy-current correction and to measure the T2 of water tissue. All spectra were processed in Matlab7: eddy-current effect was first corrected followed by single-shot frequency and phase corrections. Spectra were analyzed with LCModel8 using simulated basis sets and measured macromolecule spectra. T2 values were obtained by fitting the amplitudes obtained from LCModel with an exponential fit.Results and Discussion
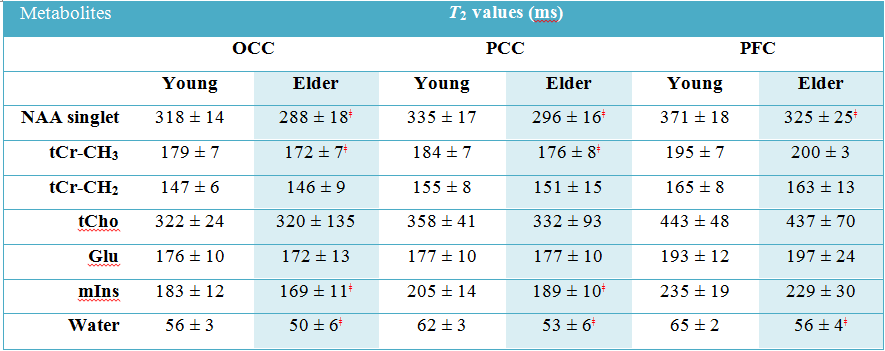
Proton spectra acquired from one young and older subject at different TEs with LASER are shown in Figure 1. There is a noticeable difference in the peak heights of tNAA and tCr, mostly visible at long echo times suggesting that the apparent T2s of these metabolites are different between two cohorts. The T2 relaxation time of NAA was found to be statistically lower by ~11% in older adult in all three brain regions (Table 1). The T2 of tCr-CH3 was also shorter by ~4% in both OCC and PCC regions in older adults while no statistically difference in T2 value for this metabolite was observed in PFC. No difference of T2 values for tCho was found in the selected brain regions. These findings are consistent with previous studies5,9. Similarly, the T2 value of mIns, a J-coupled metabolite, was statistically lower by ~7% in the older brain in both OCC and PCC regions. Since mIns is exclusively located in the astrocytes, this change in T2 value suggests the possibility to examine metabolic change due to astrogliosis in the aging brain10. The T2 of tissue water was found to be faster in the elderly cohort in all three regions studied (Table 1). The decrease in T2 values during aging might be a contribution from several factors: change in iron and water content, loss in white and gray matter, macroscropic morphological changes, and cerebral changes in metabolism11.Conclusion
In summary, this study shows that the apparent T2 relaxation time constants of singlets are shorter in the older adult brain. Results show that OCC and PCC are more sensitive compared to PFC to detect changes in the cellular microenvironment in the aging brain. In conclusion, changes in T2 values of metabolites during normal brain aging are region-dependentAcknowledgements
This work was supported by NIH grants: R21AG045606, P41 EB015894, P30 NS076408. We thank Andrew Oliver for study coordination and for neuropsychological testing, Sarah Bedell for study coordination and Akshay Patke for neuropsychological testing.References
1. Peters. Ageing and the brain. Postgrad Med J. 2006;82(964):84-8.
2. Christiansen et al. The concentration of N-acetyl aspartate, creatine + phosphocreatine, and choline in different parts of the brain in adulthood and senium. Magn Reson Imaging. 1993;11(6):799-806.
3. Kirov et al. Age dependence of regional proton metabolites T2 relaxation times in the human brain at 3 T. Magn Reson Med. 2008;60(4):790-5.
4. Kreis
et al. Integrated
data acquisition and processing to determine metabolite contents,
relaxation times, and macromolecule baseline in single examinations of
individual subjects.Magn Reson Med. 2005;54(4):761-8.
5. Marjańska
et al. Faster metabolite (1)H transverse relaxation in the elder human brain. PLoS One. 2013;8(10):e77572.
6.
Deelchand et al. Transverse relaxation time constants of the five major metabolites in human brain measured in vivo using LASER and PRESS at 3 T. Magn Reson Med. doi: 10.1002/mrm.26826.
7. Deelchand. MRspa (https://www.cmrr.umn.edu/downloads/mrspa/).
8. Provencher. Estimation of metabolite concentrations from localized in vivo proton NMR spectra. Magn Reson Med. 1993;30(6):672-9.
9. Eylers et al.Detection of Normal Aging Effects on Human Brain Metabolite Concentrations and Microstructure with Whole-Brain MR Spectroscopic Imaging and Quantitative MR Imaging. AJNR Am J Neuroradiol. 2016;37(3):447-54
10. Cotrina et al. Astrocytes in the aging brain. J Neurosci Res. 2002;67(1):1-10.
11. Knight et al. Quantitative T1 and T2 MRI signal characteristics in the human brain: different patterns of MR contrasts in normal ageing. MAGMA. 2016;29(6):833-842
Figures