3889
Metabolite concentration changes associated with positive and negative BOLD signal in the human visual cortex: a functional magnetic resonance spectroscopy study at 7T.1LIFMET, Ecole Polytechnique Fédérale de Lausanne, Lausanne, Switzerland, 2CIBM, Ecole Polytechnique Fédérale de Lausanne, Lausanne, Switzerland, 3Spinoza Centre for Neuroimaging, Amsterdam, Netherlands, 4Department of Radiology, University of Geneva, Geneva, Switzerland, 5Department of Radiology, University of Lausanne, Lausanne, Switzerland
Synopsis
The metabolite correlates of the negative BOLD signal were investigated using functional MRS and compared to the changes produced by the positive BOLD response. The participants were scanned in a 7-T MRI while passively viewing visual checkerboards. For the positive BOLD response, increases of glutamate and lactate concentrations were observed, while the negative BOLD response in a similar voxel was linked to a decrease of glutamate, lactate and GABA concentrations. This measured decrease of oxidative metabolism during the negative BOLD response suggest a reduction a glutamatergic activity in the visual cortex.
Introduction
Beside the well-known and widely-used positive BOLD response used in most fMRI studies to infer neuronal activity1, a sustained negative BOLD signal has also been observed2. Several theories for the origin of the negative BOLD response have emerged, such as reallocation of the blood flow from less to more CBF-demanding regions (i.e. blood stealing)3 or neuronal deactivation4. Nevertheless, a negative BOLD response in the peripheral visual regions, triggered by a small centered checkerboard, seems to be linked to neuronal deactivation4. However, it is not clear whether this deactivation is due to a local increase of GABAergic activity or a decrease of remote excitatory inputs in the visual area. To investigate this question, a functional magnetic resonance spectroscopy (fMRS) study was conducted at 7 Tesla on healthy human participants.Methods
Two groups of healthy participants took part to this study: i) one group of 12 participants (2 women, 21.6±1.3 years old) participated in the positive BOLD (posBOLD) run and ii) one group of 21 participants (10 women, 21.3±2.6) in the negative BOLD (negBOLD) run. All participants were scanned on a head-only 7-Tesla/68cm MRI scanner (Siemens Medical Solutions, Germany) using a 1H quadrature surface coil. A “localizer” functional MRI (fMRI) experiment was acquired with sinusoidal EPI (2*2*2 mm voxels, matrix 106x106x26, coronal-oblique acquisition, TR/TE:2000/27ms) followed by an MP2RAGE5 anatomical scan (TR/TE/TI1/TI2 5500/1.84/750/2350ms, matrix 152x152x144, 1.2x1.2x1.2mm3). First- and second order shims were adjusted with FAST(EST)MAP (shim VOI: 20x20x20 mm3)6,7. 1H-MR spectra were acquired using a semi-adiabatic SPECIAL sequence8 (TR/TE=7500/16ms, VOI=18×18×18mm3, 88×2 scans). During the functional acquisitions, the posBOLD group was stimulated with a full screen radial checkerboard and the negBOLD group with a small central checkerboard, both alternating between stimulation (STIM) and rest (REST) periods: i) 10s STIM and 20s REST x 12 for the fMRI part and ii) 2min REST and four alternate periods of 5min STIM and REST for the fMRS part. EPI data were corrected for slice timing, motion and smoothed with a Gaussian of 3.5 mm FWHM. The signal percent change and fraction of voxels displaying positive/negative BOLD responses inside the spectroscopy VOI were extracted. The spectra were checked for quality, corrected for phase, small B0 drifts, averaged, corrected for the T2* line broadening effect and quantified using LCModel with a basis set including 20 different metabolites and an experimental measured macromolecular baseline. Only 15 metabolites with a Crámer-Rao lower bound (CRLB) below 30% (except glucose: CRLB<50%) were considered for further analysis. Statistics were performed using paired t-tests with p-values FDR-adjusted.Results
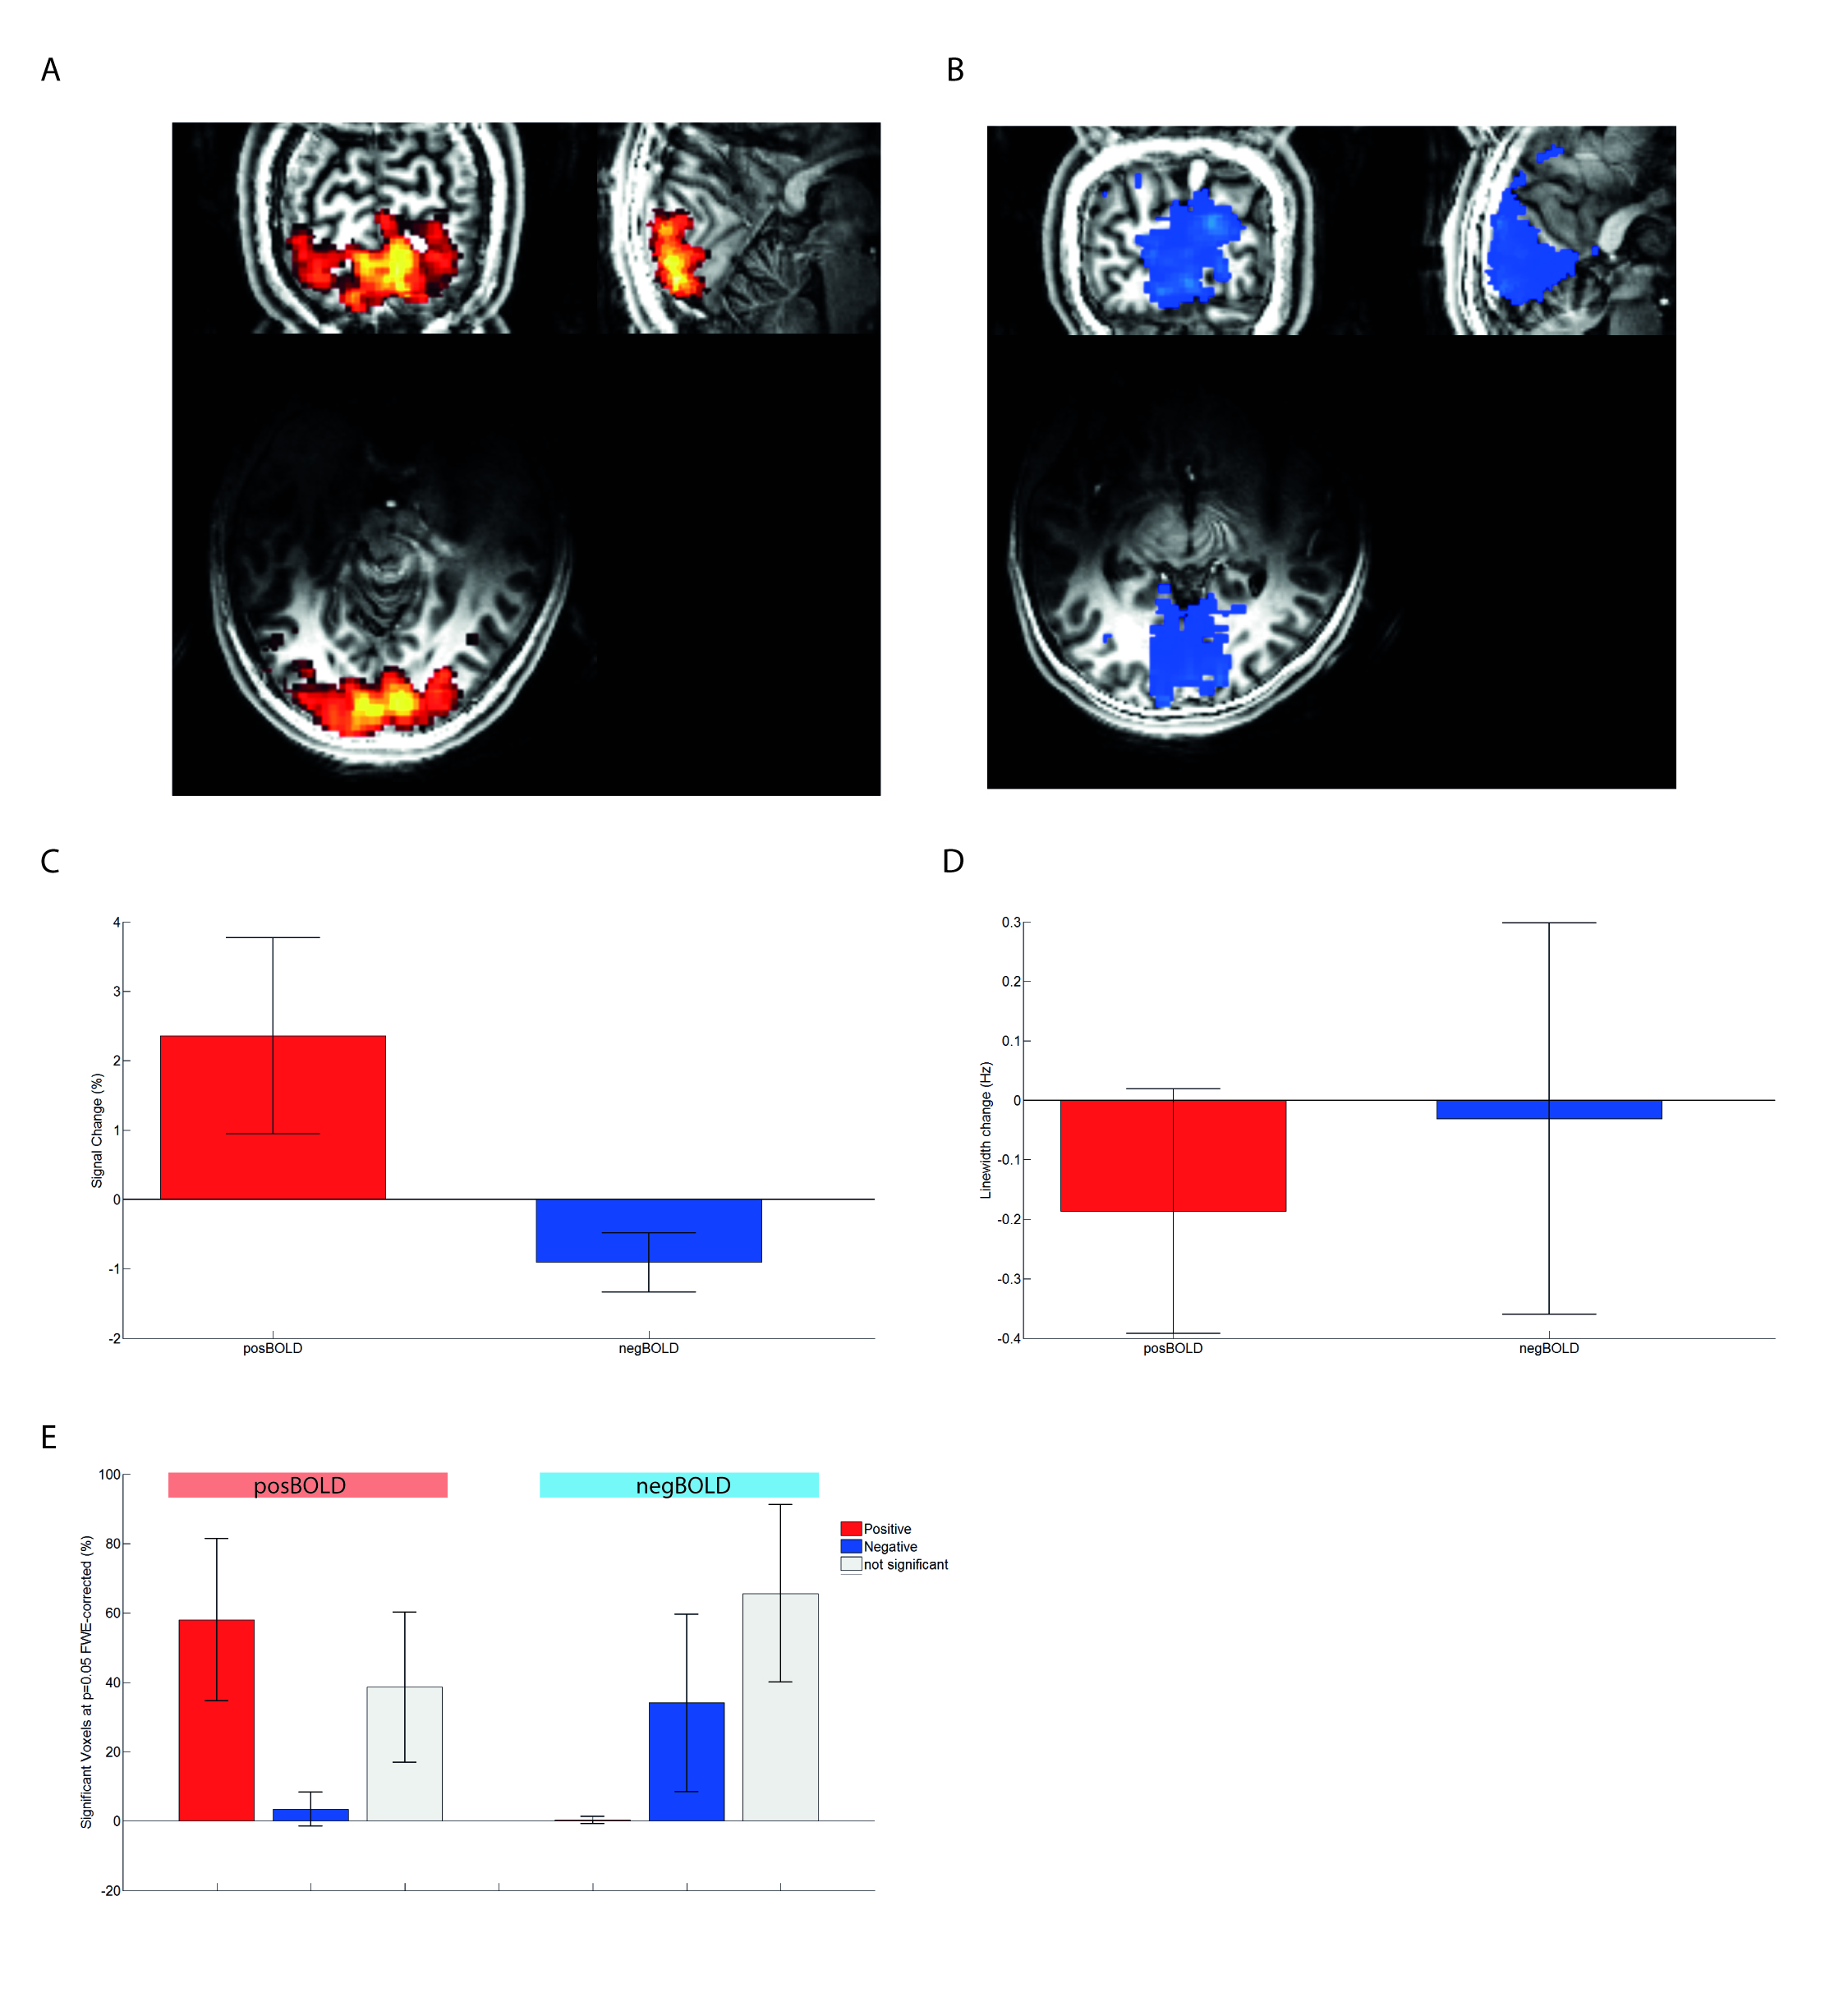
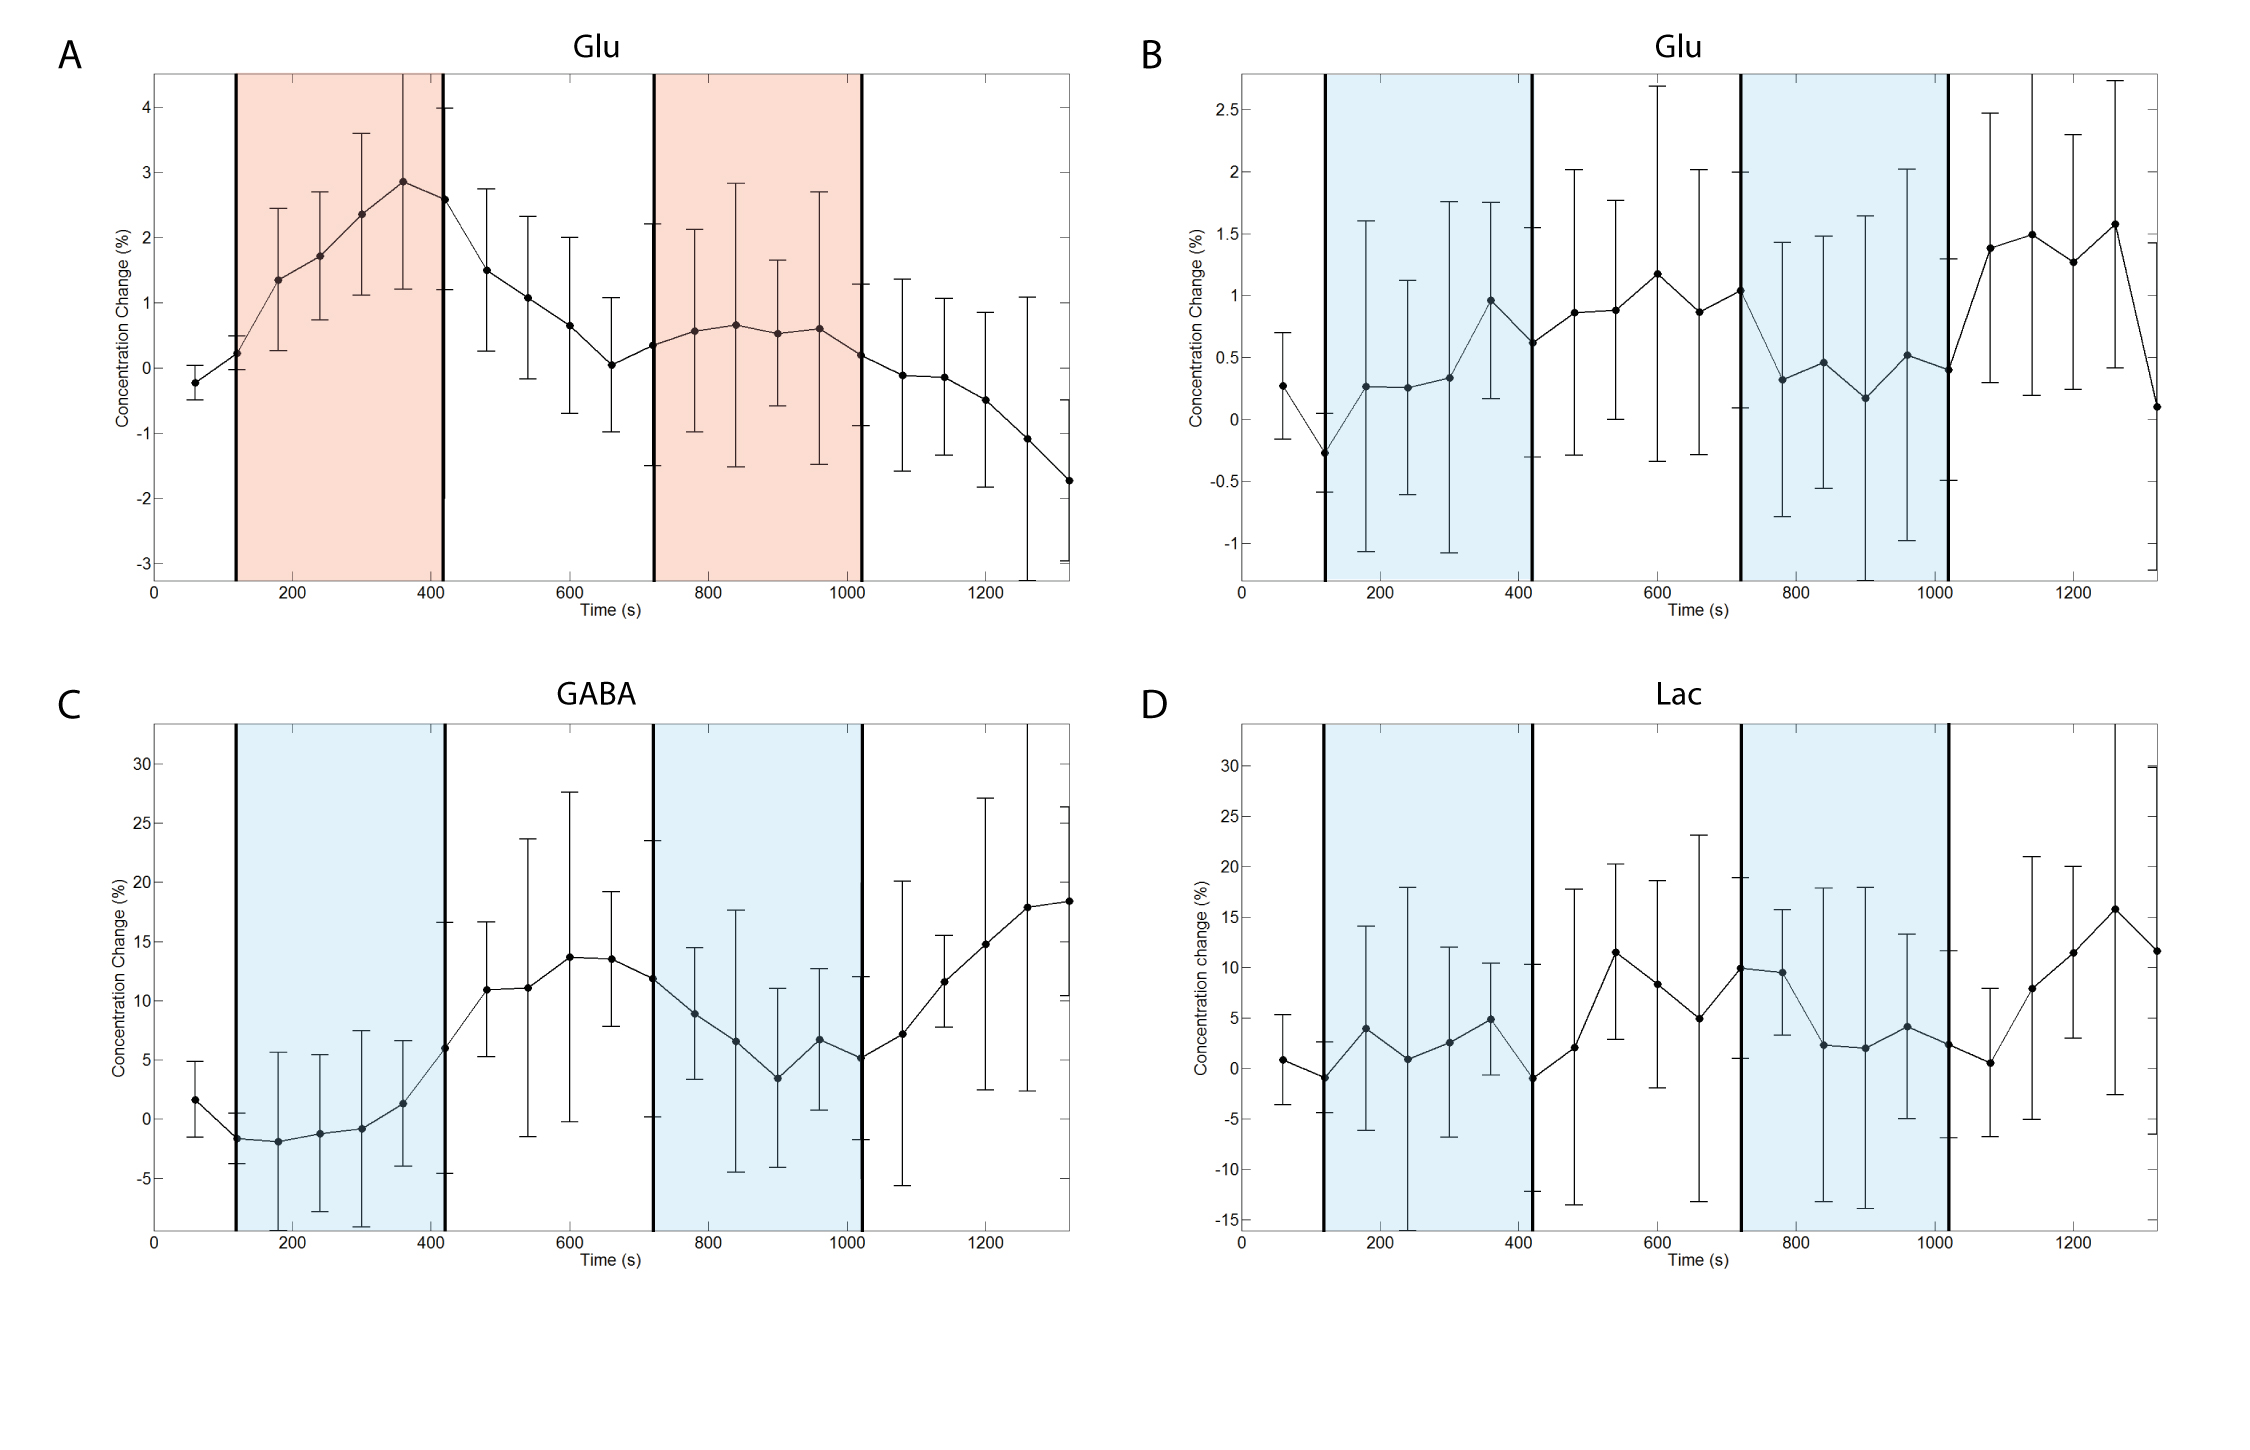
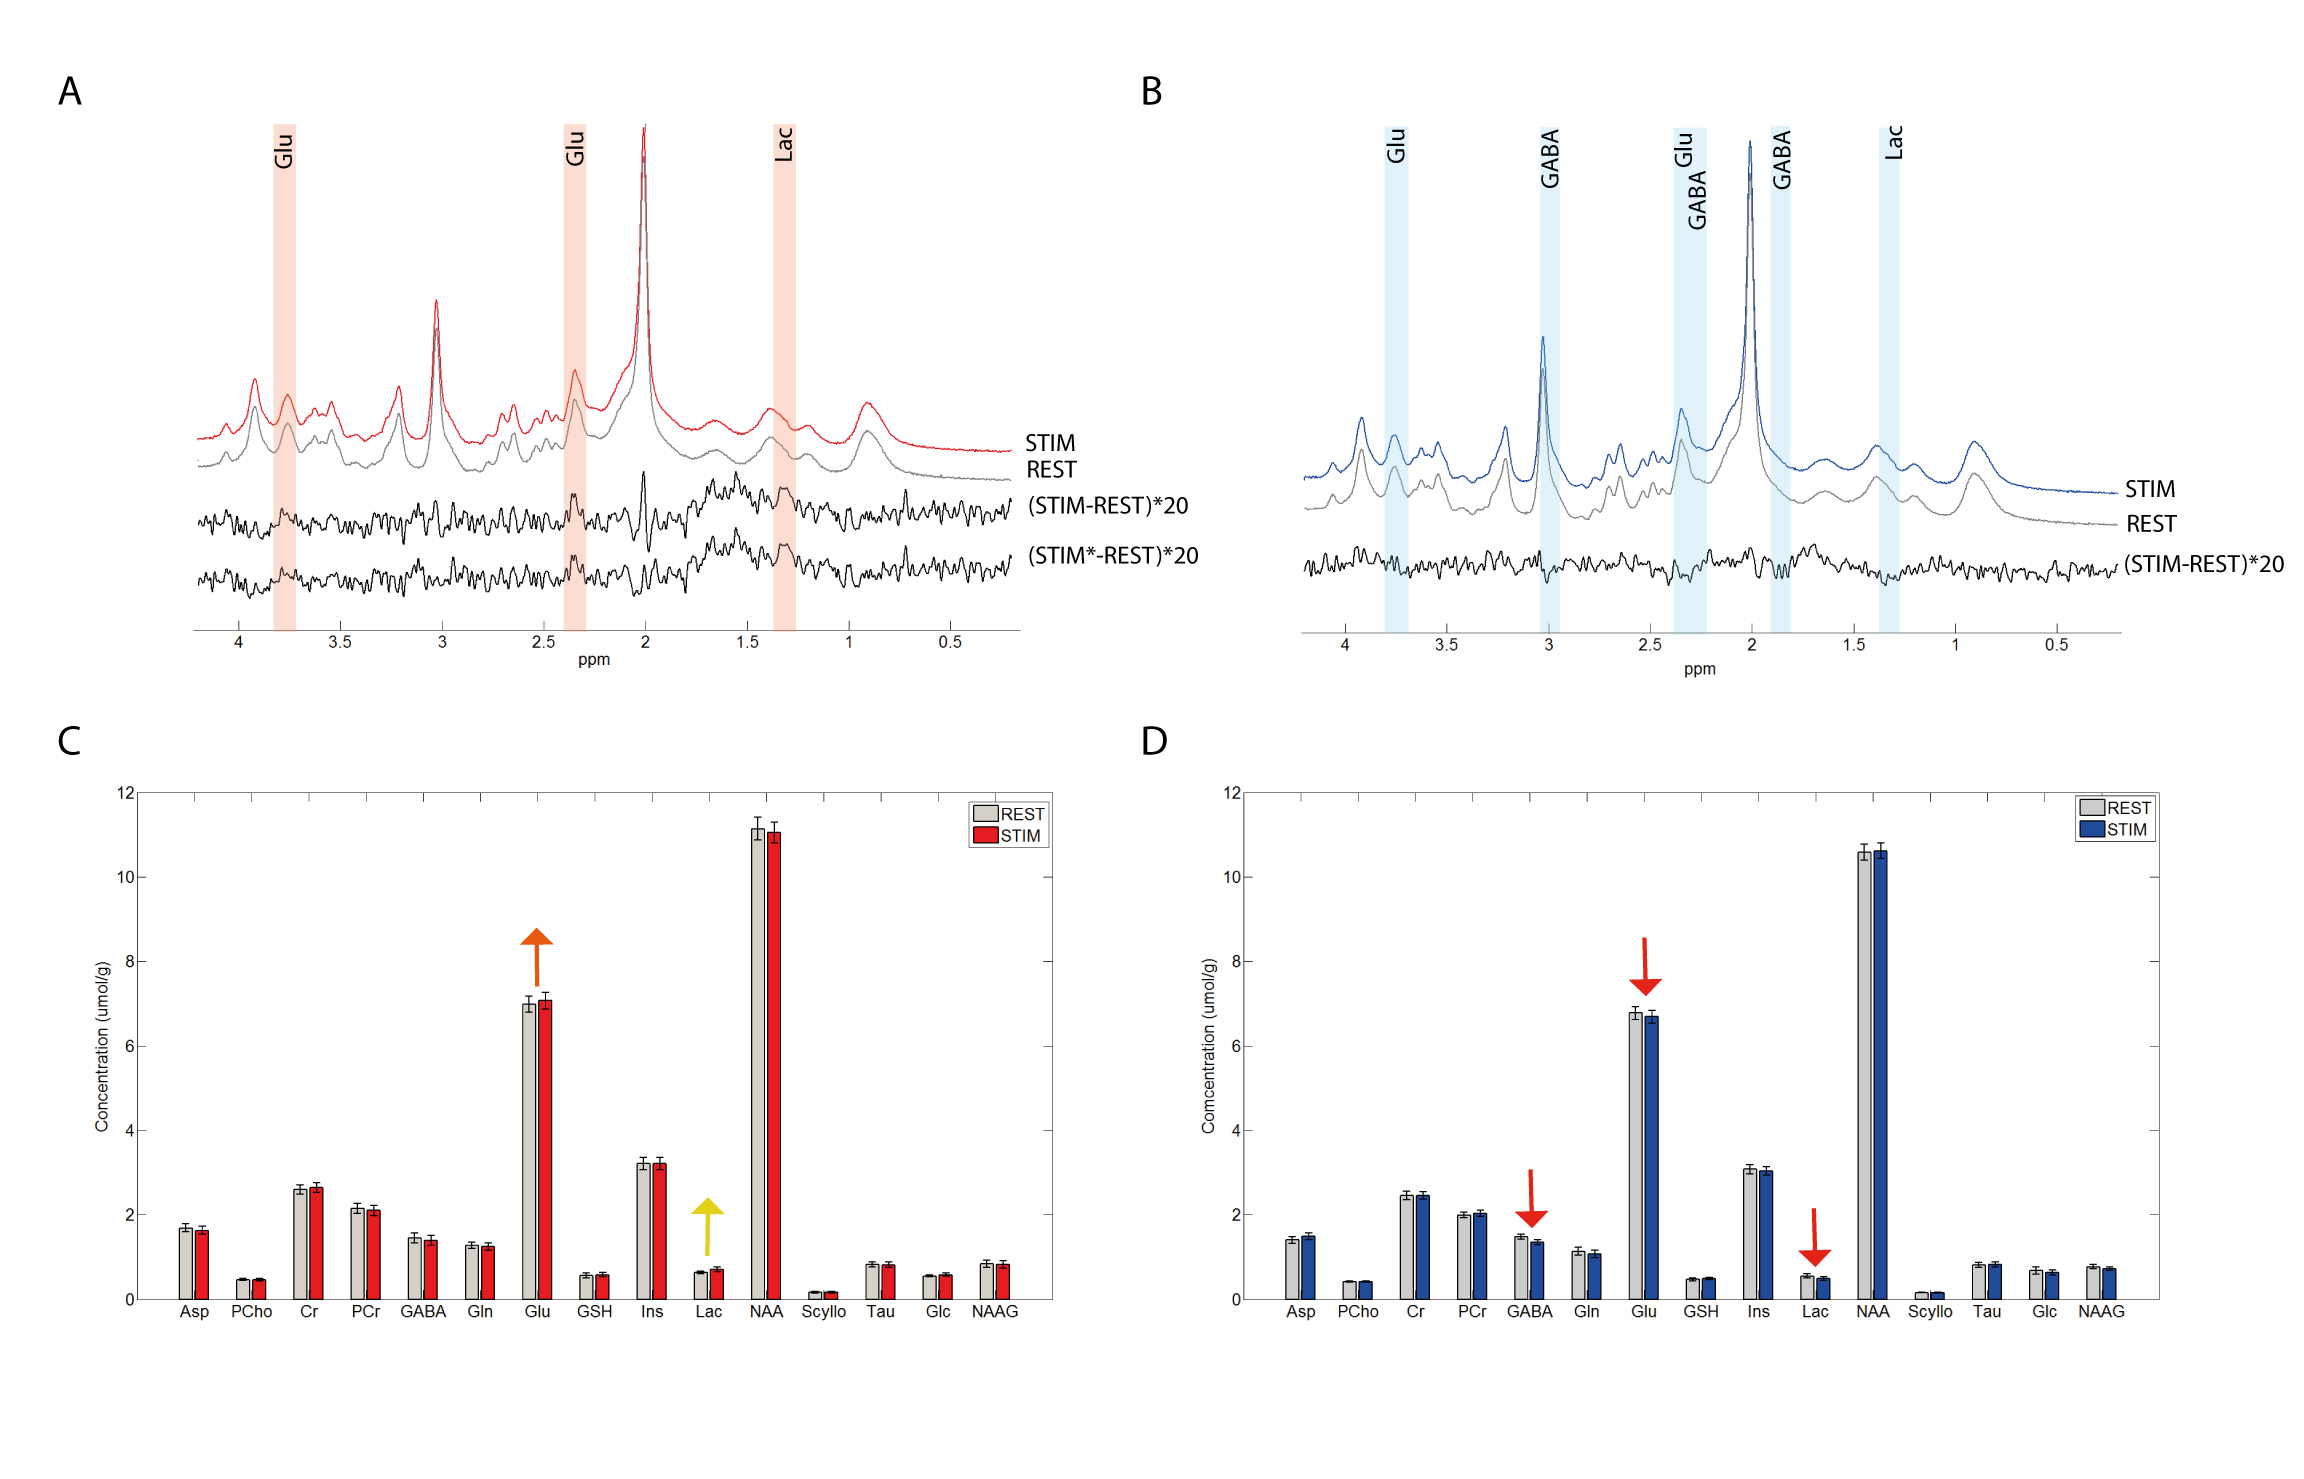
Both groups showed their respective BOLD response with the amplitude of the positive BOLD signal being about twice larger than the negative BOLD response (Figure1A,B&C). The negBOLD VOIs were not affected by partial voluming with significant positive BOLD signal (Figure1D). However, because of its small amplitude (Figure 1E), the negative BOLD effect on the spectral linewidth showed a lot of variability across participants (see also Figure2B). The negBOLD group showed a significant decrease (p<0.05 FDR-corrected) of glutamate (-0.08µmol/g), GABA (-0.11µmol/g) and lactate (-0.06µmol/g; Figure2B&D). The time courses of these three metabolites are consistent with the stimulation paradigm (Figure3B,C&D). In the posBOLD group, only a change for glutamate (+0.11µmol/g, p<0.05 uncorrected) and a trend for lactate (+0.06µmol/g) were observed (Figure2A&C; Figure 3A). In the difference spectra (Figure2A&B), the posBOLD showed a strong T2* linewidth effect with distinguishable peaks of glutamate and lactate.Discussion
As observed in previous fMRS studies9–12, the positive BOLD is accompanied with increases in glutamate and lactate reflecting increases in excitatory neurotransmission, glycolytic and oxidative metabolism. The reduced glutamate and lactate concentrations together with the decreases in CBF and O2 consumption14 during the negative BOLD response suggest a reduction of glycolysis and oxidative energy metabolism, which may be the results of a decrease of glutamatergic activity. Whether this decrease is due to an increased local or remote inhibition (GABAergic) is not clear. Note that inhibitory neurotransmission requires less energy compared to the glutamatergic activity12 and the energy increases required by increased inhibition activity is most likely covered by the major drop of energy demands due to decreased glutamatergic neurotransmission. On the other hand, only a small part of the GABA pool is used for neurotransmission13. Therefore, the significant reduction of GABA concentration during the negative BOLD response may be dominated by a collateral effect of the glutamate pool diminution.Taken together, these metabolite concentration changes and the decrease of blood flow and oxygen consumption14 indicates a diminution of oxidative energy metabolism in the presence of negative BOLD. However, further investigation would be required about the change of GABAergic activity.Acknowledgements
This work was supported by the Centre d'Imagerie BioMédicale (CIBM) of the UNIL, UNIGE, HUG, CHUV, and EPFL and the Leenaards and Jeantet FoundationsReferences
1. Logothetis, N. K., Pauls, J., Augath, M., Trinath, T. & Oeltermann, a. Neurophysiological investigation of the basis of the fMRI signal. Nature 412, 150–157 (2001).
2. Huang, W. et al. Magnetic resonance imaging (MRI) detection of the murine brain response to light: temporal differentiation and negative functional MRI changes. Proc. Natl. Acad. Sci. U. S. A. 93, 6037–6042 (1996).
3. Harel, N., Lee, S.-P., Nagaoka, T., Kim, D.-S. & Kim, S.-G. Origin of negative blood oxygenation level-dependent fMRI signals. J. Cereb. Blood Flow Metab. 22, 908–917 (2002).
4. Shmuel, A., Augath, M., Oeltermann, A. & Logothetis, N. K. Negative functional MRI response correlates with decreases in neuronal activity in monkey visual area V1. Nat. Neurosci. 9, 569–577 (2006).
5. Marques, J. P. et al. MP2RAGE, a self bias-field corrected sequence for improved segmentation and T1-mapping at high field. Neuroimage 49, 1271–81 (2010).
6. Gruetter, R. & Tkac, I. Field Mapping Without Reference Scan Using Asymmetric Echo-Planar Techniques. 323, 319–323 (2000).
7. Gruetter, R. Automatic, localizedin Vivo adjustment of all first-and second-order shim coils. Magn. Reson. Med. 29, 804–811 (1993).
8. Xin, L., Schaller, B., Mlynarik, V., Lu, H. & Gruetter, R. Proton T 1 relaxation times of metabolites in human occipital white and gray matter at 7 T. Magn. Reson. Med. 69, 931–936 (2013).
9. Schaller, B., Xin, L., O’Brien, K., Magill, A. W. & Gruetter, R. Are glutamate and lactate increases ubiquitous to physiological activation? A 1H functional MR spectroscopy study during motor activation in human brain at 7Tesla. Neuroimage 93, 138–145 (2014).
10. Schaller, B., Xin, L. & Gruetter, R. olite concentration changes in the human auditory cortex using functional Magnetic Resonance Spectroscopy (fMRS) at 7 Tesla. Proc. Intl. Soc. Mag. Reson. Med. 22 1806. (2014). doi:10.1017/CBO9781107415324.004
11. Bednařík, P. et al. Neurochemical and BOLD responses during neuronal activation measured in the human visual cortex at 7 Tesla. J. Cereb. Blood Flow Metab. 35, 601–610 (2015).
12. Mangia, S. et al. Metabolic and hemodynamic events after changes in neuronal activity: current hypotheses, theoretical predictions and in vivo NMR experimental findings. J. Cereb. Blood Flow Metab. 29, 441–463 (2009).
13. Rae, C. D. A guide to the metabolic pathways and function of metabolites observed in human brain 1H magnetic resonance spectra. Neurochem. Res. 39, 1–36 (2014).
14. Shmuel, A. et al. Sustained negative BOLD, blood flow and oxygen consumption response and its coupling to the positive response in the human brain. Neuron 36, 1195–1210 (2002).
Figures