3888
Probing alterations of cellular metabolism in a mouse model of Huntington’s disease (R6/1) using in vivo MRS and DW-MRS1Molecular Imaging Research Center (MIRCen), Commissariat à l'Energie Atomique (CEA), Fontenay aux Roses, France, 2UCL, London, United Kingdom, 3UMS 27, INSERM, Fontenay aux Roses, France
Synopsis
Huntington’s disease is a genetic neurodegenerative disorder caused by the abnormal repetition of the CAG triplet in the gene coding for huntingtin (Htt). R6/1 mouse model, expressing a human form of mutated huntingtin, exhibits a progressive neuronal alteration in the striatum. We use in vivo MRS and diffusion-weighted MRS at various diffusion-weightings and diffusion times to detect changes in cellular metabolic content and structure R6/1 mice striatum. We report massive metabolic remodeling, especially for N-acetyl aspartate (NAA) and Glutamine (Gln), as well as changes in glutamate diffusion properties that we tentatively relate to variations in glutamate cellular compartmentation.
Purpose
The mouse model R6/1 of Huntington’s disease exhibits motor impairments at 4 months (early stage) and a neuropathology is expected in striatum. In this work we use in vivo MRS and diffusion-weighted MRS (DW-MRS) to detect changes in cellular metabolic content and compartmentation in mice and we particularly report changes in Glu/Gln concentrations and diffusion properties, associated to a dysregulation of Glu/Gln cycle.Methods
Ten R6/1 male mice (4-months old) and ten littermates (gender/age matched) were scanned using an 11.7T Bruker Scanner (Gmax=752 mT/m), equipped with a cryoprobe. MRS and DW-MRS were acquired using our STE-LASER sequence[1]. A 56mm3 voxel was positioned around the striatum. For each mouse, spectra were acquired at diffusion time td=53 ms up to very high b (b=0, 3, 6, 10, 20, 30 and 50 ms/µm²) to try to be sensitive to restriction due to short-range structure, in particular fiber diameter[2], and at much longer td (103, 253, 503, 1003, 1503 and 2003 ms at b=0 and 3 ms/µm²) to try to be sensitive to the long-range structure of cellular processes[3]. Post-processing was performed as described in[1]. Macromolecule spectra were acquired for each phenotype and included in the LCModel basis set. Metabolites concentrations were determined from spectra at b=0. [tCr] being increasing in R6/1 group, we normalized concentrations by the mean macromolecule concentration appearing to be the most stable element between R6/1 and control group.Results and discussion
General atrophy: R6/1 mice (22.0 ± 0.9g) are significantly lighter than littermates (28.8 ± 1.8g) at 18-weeks. We observe general brain atrophy and we have roughly quantified 20%-decreased striatal volume from T2-weighted images (Fig1A and Table 1).
Metabolic alterations: Sum of spectra for each group are shown in Fig1A, illustrating the striking metabolic remodeling associated to mutated huntingtin. Significant decrease was observed for NAA (-21%), lactate (Lac) (-27%), and glutamate (Glu) (-6%) and significant increase for Gln (+59%), choline compounds (tCho) (+23%) ans tCr (+10%). This model is poorly described in NMR literature, but results are consistent with prior MRS studies on early stages of R6/2 mice[4], a similar but stronger Htt mouse model. They suggest a neuronal metabolic remodeling and an alteration of the Glu/Gln cycle. Macromolecule spectra are similar between both phenotypes, except for the unclear resonances under Gln signal that seem higher in R6/1 group(Fig 2). It might be due to the polyglutamine chain in huntingtin.
Absence of alterations of long-range cellular structure: ADC as a function of td is similar between R6/1 and littermates for most metabolites(Fig3), suggesting no alteration of long-range cellular structure. Histochemistry and confocal microscopy is ongoing to confirm this observation in cellular structure of neurons or astrocytes.
High-b measurements, and relation to Glu/Gln cycle dysregulation: Metabolite signal attenuation as a function of b is slightly stronger for tCr, tCho in R6/1(Fig3). Interestingly, myo-inositol (Ins) signal attenuation is very similar between both phenotypes, underlining an absence of astrocytic activation[5], which is corroborated by its stable concentration[6-9]. However the slightly stronger signal attenuation of tCho and tCr might underline another kind of glial activation, like microglial activation, reported in HD patients at early stages[10]. The increase of [tCr] and [tCho] might support this hypothesis[11].
The strongest variation of diffusion as a function of b is found for Glu, suggesting diffusion in less restricted compartments. Glu is predominantly found in neurons, however we do not expect a neuronal hypertrophy in R6/1 mice. Instead, we think that stronger Glu attenuation might rather reflect a change in Glu compartmentation (Glu accumulating in a compartment with less restriction). The hypothesis of increased extracellular [Glu] is put aside as its extracellular levels remain insignificant in HD models[12-13]. Since astrocytic processes seem thicker than neurites[2], we think that the astrocytic/neuronal [Glu] ratio can be higher in R6/1 mice. Two explanations might support this hypothesis. Firstly, the glutamine synthetase (GS) expression seem to diminish in R6 mice[12-13]: to some extent, Glu might be more concentrated in astrocytes because it would be less converted to Gln. Secondly, an hyperammonemia associated to an urea cycle deregulation has been measured in R6/2 mice[14]. This cause a strong increase of [Gln] in CNS and a diminution of GS activity[15-16] and is associated to a deregulation of Glu/Gln cycle, as we observe in our model.
Conclusion
In this mouse model of early stage HD, MRS reveals alterations which can be interpreted as alterations of neuronal and glial metabolism. Together with DW-MRS which may be sensitive to variation of glutamate cellular compartmentation, this study points toward an increase in the astrocytic/neuronal [Glu] ratio, associated to dysregulation of the Glu/Gln cycle.Acknowledgements
This work was funded by the European Research Council (grant #336331).References
[1] Ligneul C. et al. Metabolite diffusion up to very high b in the mouse brain in vivo: Revisiting the potential correlation between relaxation and diffusion properties. MRM 2017. doi:10.1002/mrm.26217
[2] Palombo et al. Modeling Diffusion of Intracellular Metabolites in theMouse Brain up to Very High Diffusion-Weighting: Diffusion in Long Fibers (Almost) Accounts for Non-Monoexponential Attenuation. MRM 2017. doi:10.1002/mrm.26548
[3] Palombo et al. New paradigm to assess brain cell morphology by diffusion-weighted MR spectroscopy in vivo. PNAS 2016. doi:10.1073/pnas.1504327113
[4] Tkac et al. Neurochemical changes in Huntington R6 / 2 mouse striatum detected by in vivo 1 H NMR spectroscopy. J. Neurochem. 2007. doi:10.1111/j.1471-4159.2006.04323.x
[5] Ligneul et al. Probing alterations of cellular metabolism and structure in CNTF-induced mouse model of astrocytic activation using in vivo MRS and diffusion-weighted MRS. Proc ISMRM 2017 #0410
[6] Filibian et al. In vivo imaging of glia activation using 1H-magnetic resonance spectroscopy to detect putative biomarkers of tissue epileptogenicity. Epilepsia 2012. doi:10.1111/j.1528-1167.2012.03685.x
[7] Chen et al. Age-related changes in brain metabolites andcognitive function in APP / PS1 transgenic mice. Behav. Brain Res. 2012. doi:10.1016/j.bbr.2012.07.016.
[8] Bitsch et al. Inflammatory CNS Demyelination : Histopathologic Correlation with In Vivo Quantitative Proton MR Spectroscopy. Am J Neuroradiol 1999.
[9] Carrillo-de Sauvage et al. The neuroprotective agent CNTF decreases neuronal metabolites in the rat striatum : an in vivo multimodal magnetic resonance imaging study. JCBFM 2015. doi:10.1038/jcbfm.2015.48
[10] Tai et al. Microglial activation in presymptomatic Huntington’s disease gene carriers. Brain 2007. doi:10.1093/brain/awm044
[11] Ercan et al. Glial and axonal changes in systemic lupus erythematosus measured with diffusion of intracellular metabolites. Brain 2016. doi:10.1093/brain/aww031
[12] NicNiocaill et al. Altered striatal amino acid neurotransmitter release monitored using microdialysis in R6/1 Huntington transgenic mice. Eur. J. Neurosci. 2001.
[13] Behrens et al. Impaired glutamate transport and glutamate-glutamine cycling : downstream effects of the Huntington mutation. Brain 2002.
[14] Chiang et al. Dysregulation of C/EBP a by mutant Huntingtin causes the urea cycle deficiency in Huntington’s disease. Hum. Mol. Genet 2007. doi:10.1093/hmg/ddl481
[15] Suarez et al. Glutamine synthetase in brain : effect of ammonia. Neurochem Int. 2002
[16] Lanz et al. MRS studies of neuroenergetics and glutamate/glutamine exchange in rats : Extensions to hyperammonemic models. Anal. Biochem. 2017
Figures
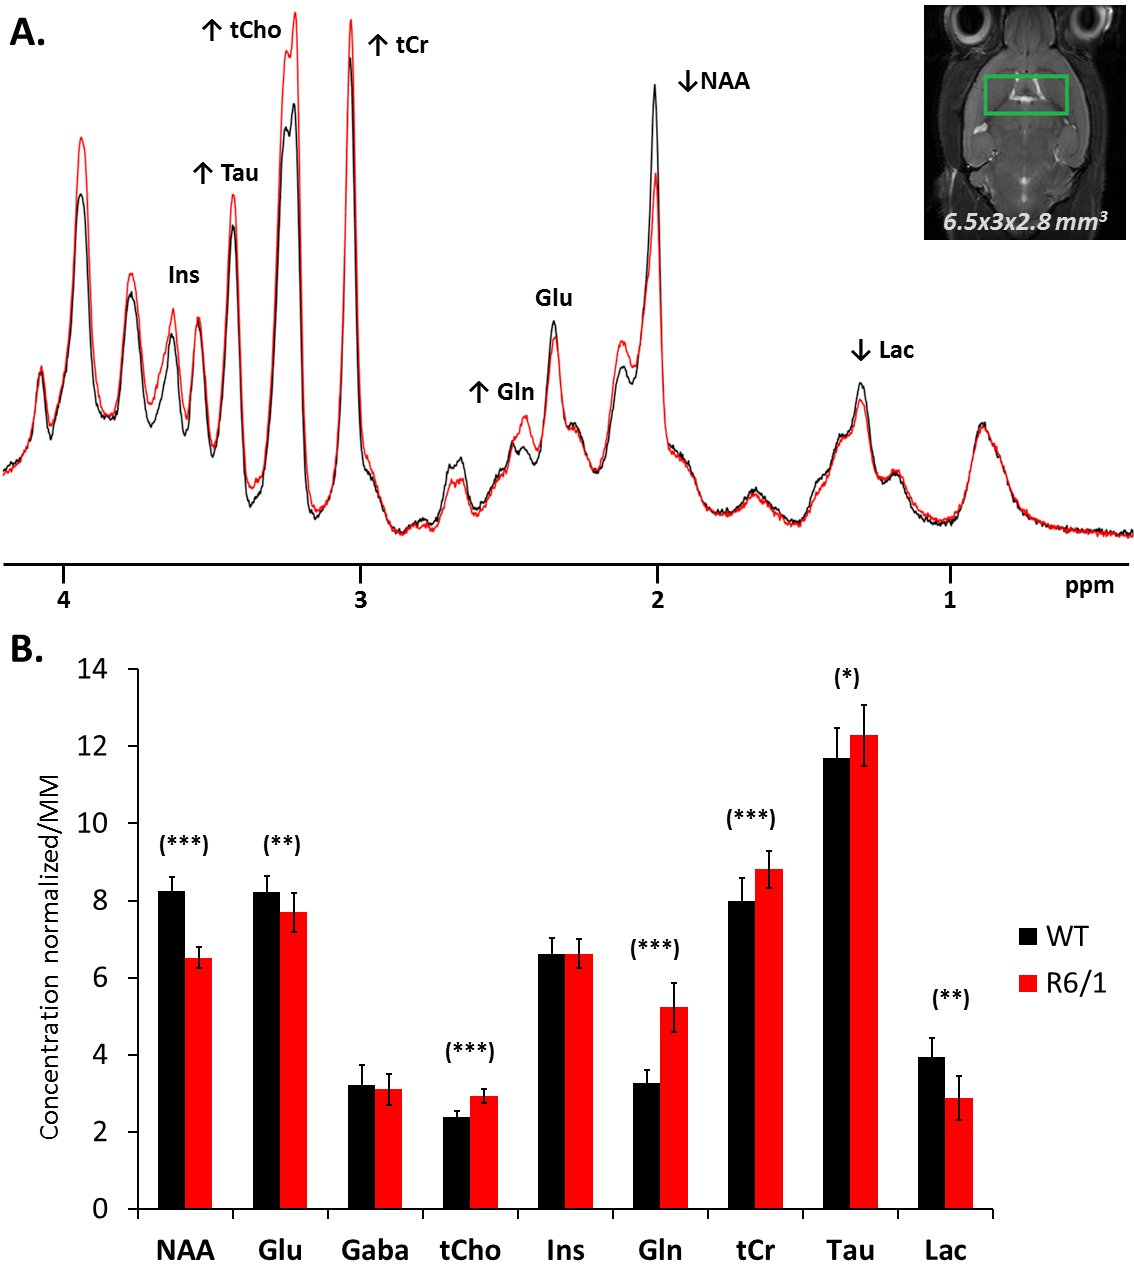
Figure 1
A) Sum of spectra acquired on the 10 mice of each group (128 individually rephased scans) at b=0.020 ms/μm² with the STELASER for R6/1 (red) or littermate (black). Despite the striatal atrophy, the macromolecule signal is very stable, other structures balancing and bringing a similar cellularity in the voxel.
B) Concentrations of metabolites normalized by the mean macromolecule concentration (scaled with [tCr]littermate at 8 mM for vizualisation). Raw concentrations before normalization correspond to absolute concentration given by LCModel for each mouse of each group. Significiance (t-test) : (***) p-value < 0.001, (**) p-value < 0.01, (*) p-value < 0.05.
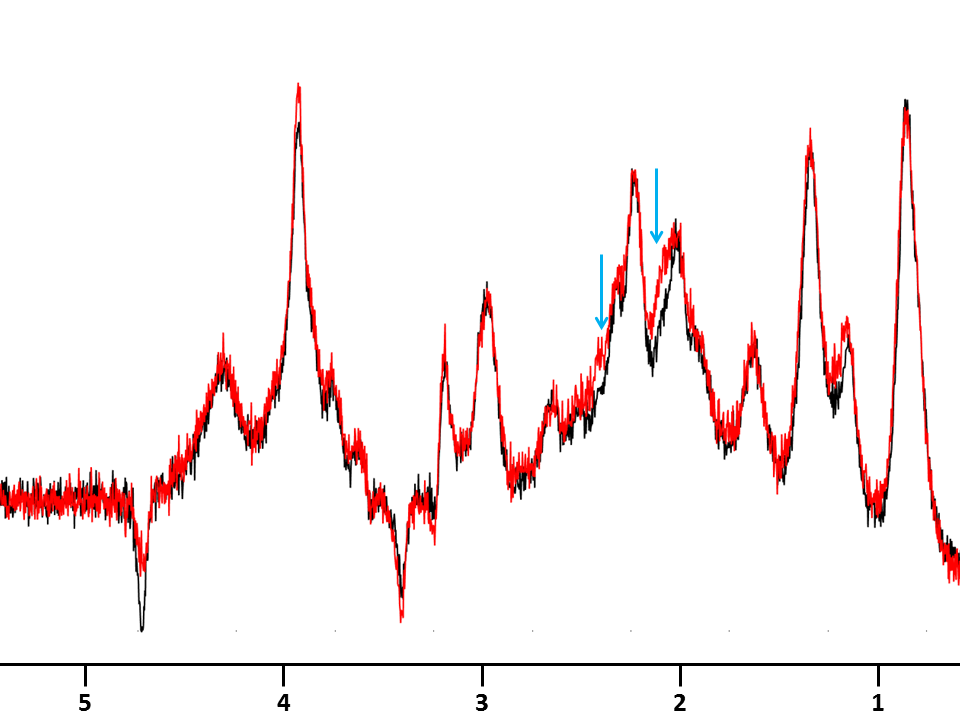
Figure 2
Macromolecules spectra for R6/1 (red) and littermate (black) resulting from sum of macromolecules spectra acquired on each mouse on each group. Each individual spectra represents 256 averages acquired with a double inversion preceding the STELASER sequence and a diffusion-weighting of 10 ms/µm². Blue arrows underline the additional contribution in R6/1 macromolecule spectrum, likely due to the long polyglutamine fragment in mutated huntingtine.
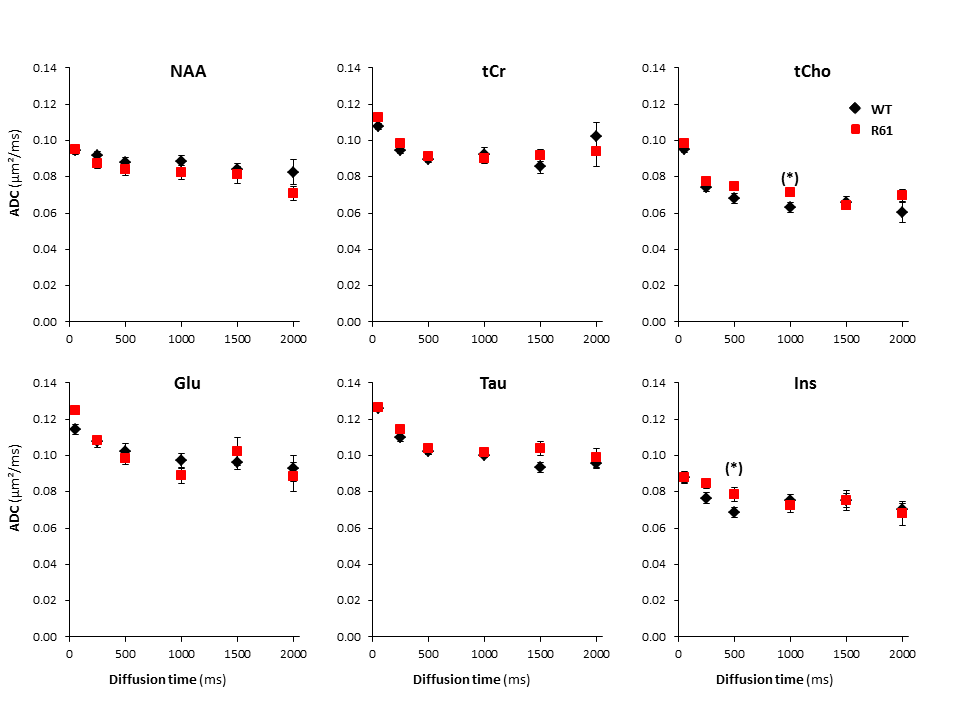
Figure 3
Apparent diffusion coefficient as a function of diffusion time, averaged over the ten mice of each group for the six main metabolites. Error bars stand for standard errors of the mean (barely visible as they are very small).

Figure 4
Logarithm of signal attenuation as a function of the diffusion-weighting b, averaged over the ten mice of each group for the six main metabolites. Error bars stand for standard errors of the mean (barely visible as they are very small).