3885
Measurement of oxygen consumption in a high density 3D cell culture on chip by 19F spectroscopy1Computer Assisted Clinical Medicine, Heidelberg University, Mannheim, Germany, 2Institute of Functional Interfaces, Karlsruhe Institute of Technology, Karlsruhe, Germany
Synopsis
Drug-induced mitochondrial dysfunction is of major clinical interest. An NMR-compatible bioreactor system was used to investigate the oxygen consumption of HepG2 cells by measuring T1 of perflubron. The oxygen consumption was measured by stopping the perfusion. This resulted in a reduction of the oxygen concentration from (19.29 ± 0.96)% to (11.41 ± 0.92)% in 104.24 min. Our results might allow for detecting a drug-induced mitochondrial dysfunction of cells in a well-controlled environment by using the two compartments of the bioreactor.
Purpose:
Drug-induced liver injury which can result in mitochondrial dysfunction is of major clinical interest1. Therefore, a method is needed to identify mitochondrial dysfunction induced by new drugs in preclinical studies. An NMR-compatible bioreactor system creates a well-controlled environment which allows for identification of mitochondrial dysfunction without the need for disturbing the biological environment. By the use of a perfluorocarbon (biologically and chemically inert2), the oxygen concentration can be non-invasively monitored via 19F. This study applied a novel method for measuring the oxygen consumption of liver cancer cells (HepG2) in a bioreactor system3 by measuring T1 of perflubron.Materials and Methods:
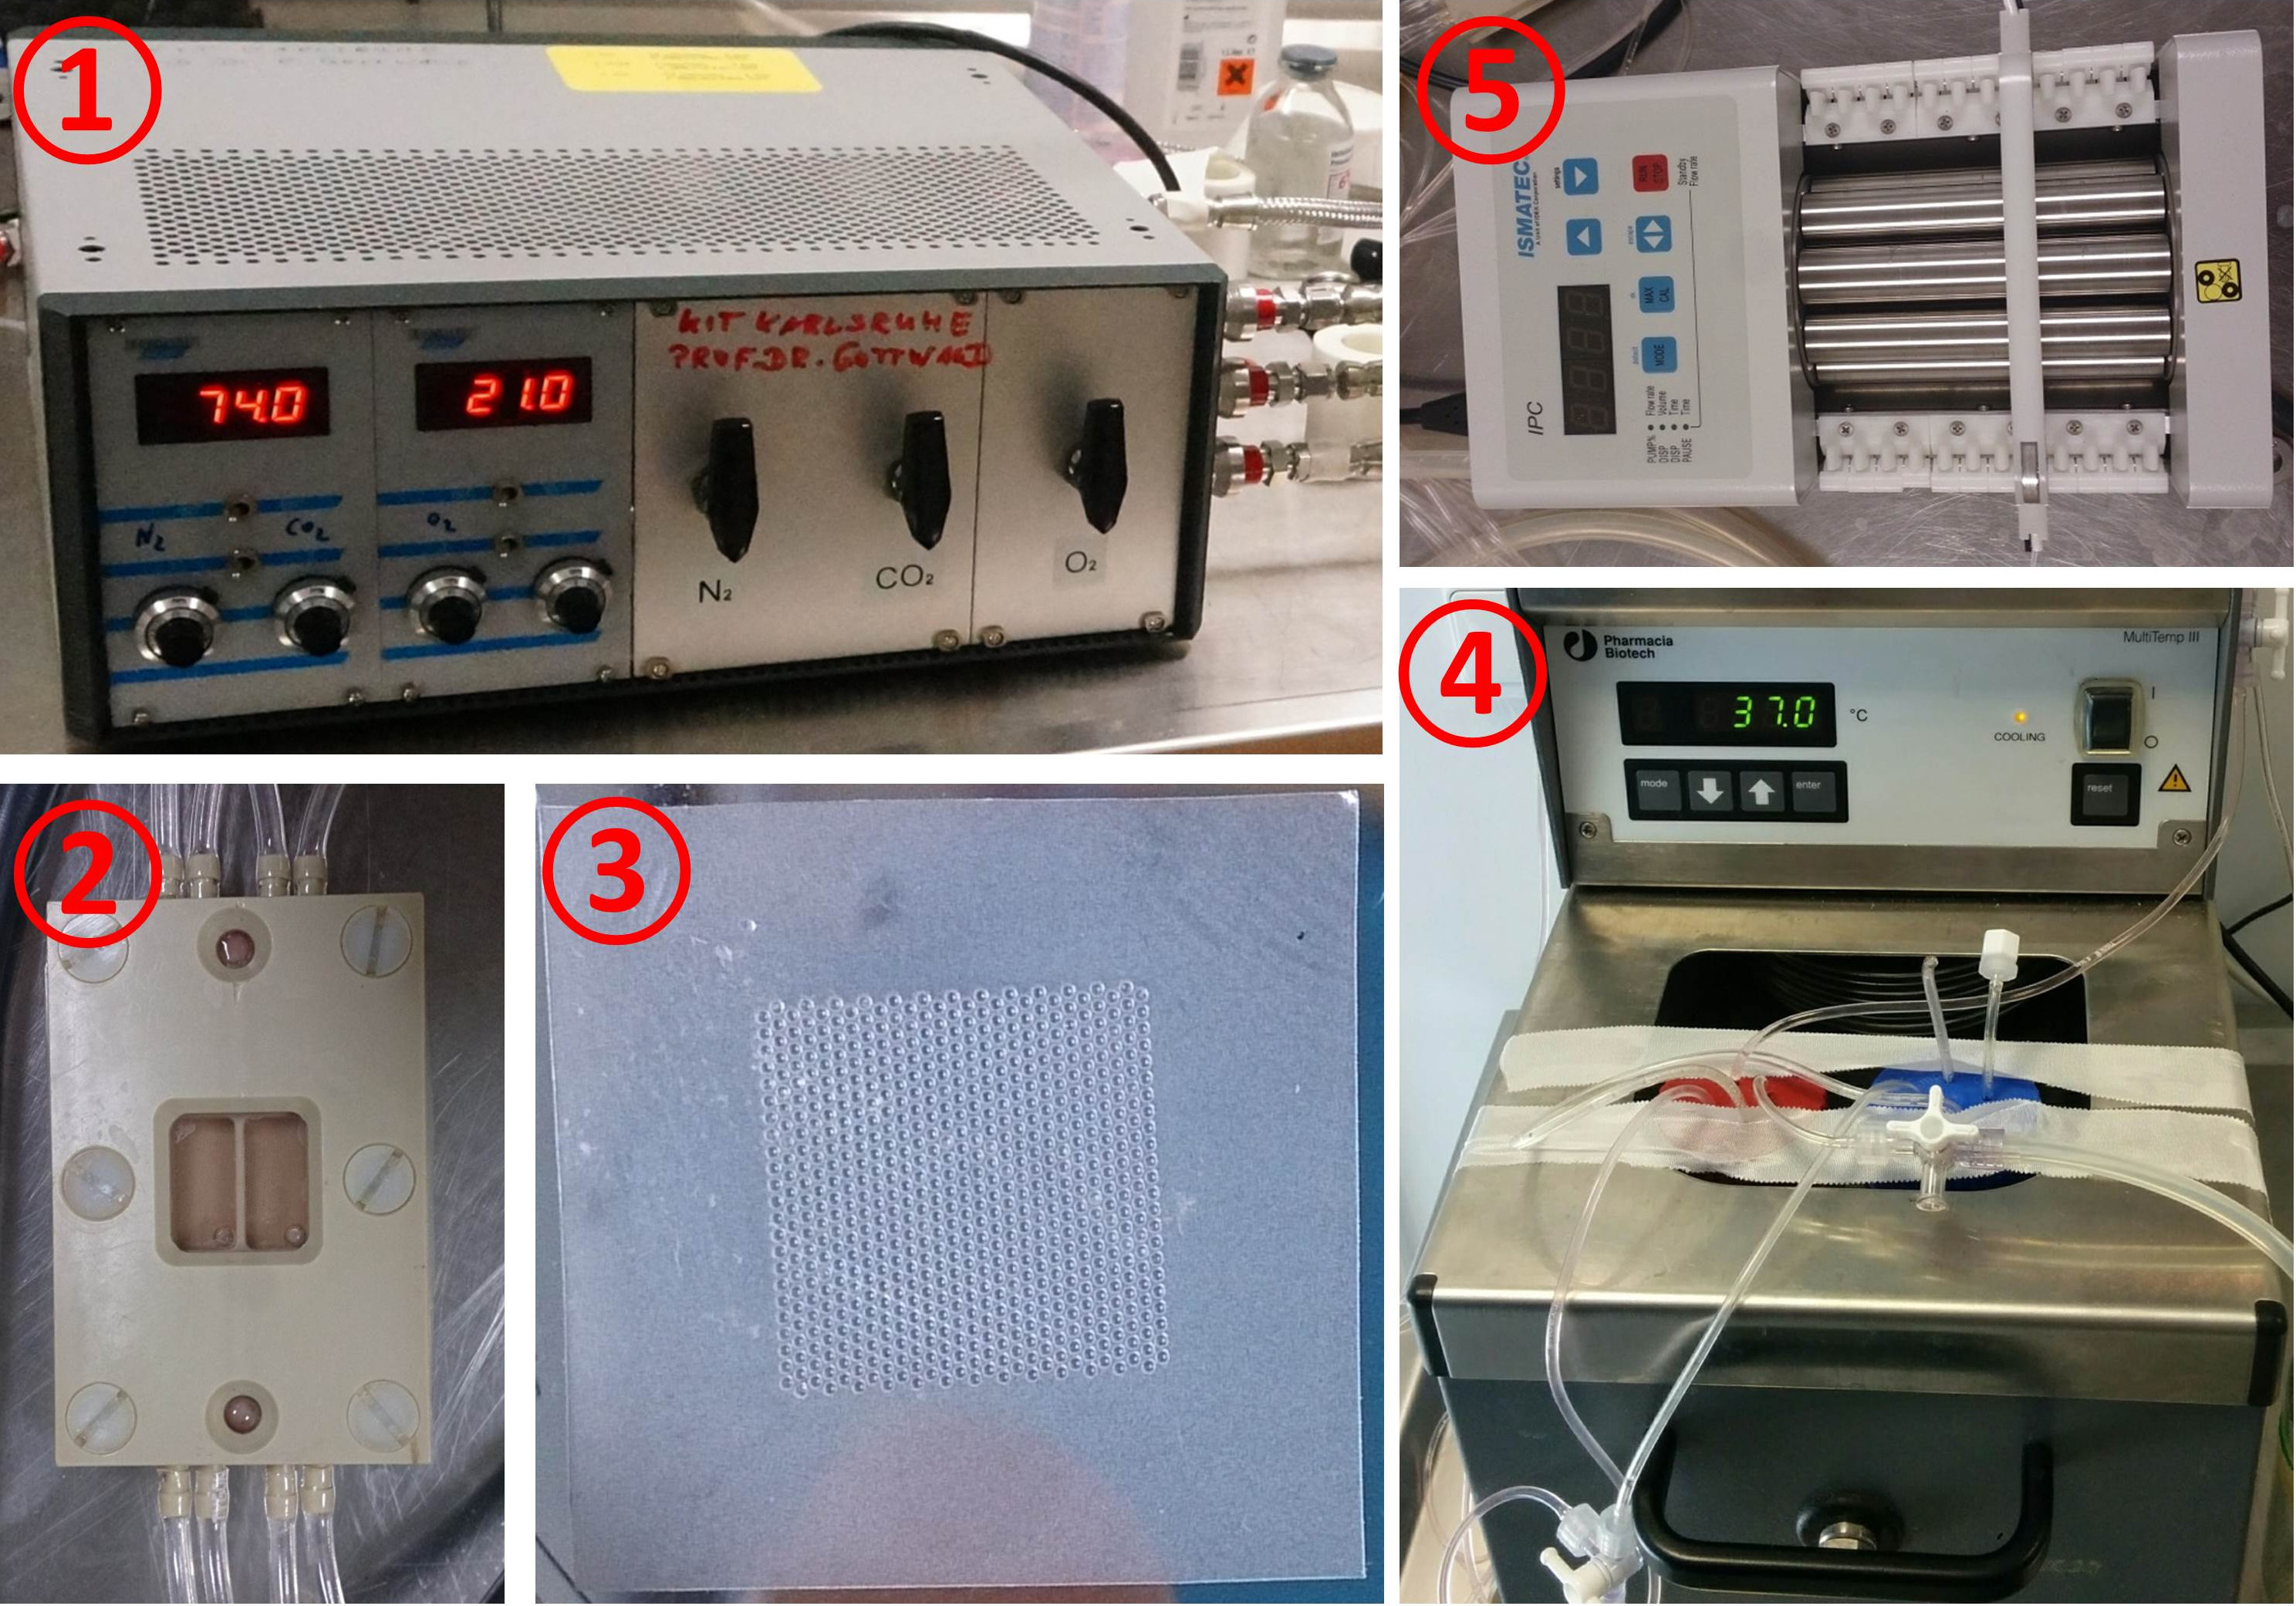
Experiments were performed on a 9.4 T preclinical small animal scanner (Bruker Biospec 94/20, Ettlingen, Germany) using ParaVision 6.0.1 with a linear polarized 1H/19F Bruker surface coil. The bioreactor3 contained a 3D culture in a microcavity area (DYNARRAYS(R)) separated into two compartments which were actively perfused (400 μl/min) under normoxic conditions (Fig.1). The HepG2 cells (ATCC, HB-8065, Manassas, USA) were prepared according to3-5.
The hydrophobicity of perflubron2 required an emulsification. Therefore, a heat-sterilized emulsion was created in-house by a high shear mixing device and a sonication bath. The formulation of the emulsion was: 20% v/v perflubron (Apollo Scientific, Bredbury, UK), 2% w/v soybean lecithin (dm-drogerie markt, Karlsruhe, Germany), 2% w/v perfluorodecyl bromide (Apollo Scientific), and distilled water. The total amount of bioreactor-medium was 80 ml (15 ml emulsion and 65 ml cell culture medium).
To convert T1 values into oxygen partial pressure (pO2), calibration measurements were performed. For this purpose, the fluid was bubbled with 0%, 10%, 21%, 60% and 100% O2 by simultaneously adapting the N2 concentration for two hours. The temperature dependence was evaluated for 32.5, 35.0, 37.5 and 40 °C. The measurement was performed when no temperature change had been observed for 30 min.
The perfusion shortened the T1 value and therefore led to a wrong oxygen concentration. To remove this influence, the change of T1 was determined by a perfusion stop with an empty chip. Then the time period to reach a constant T1 value was used for the removal of the first T1 values during the perfusion stop with cells (oxygen consumption measurement).
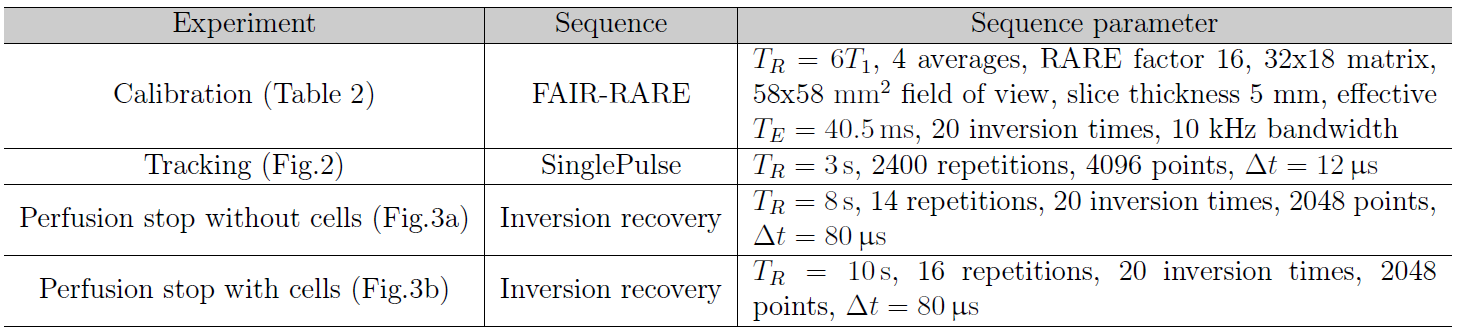
For T1 measurements, a non-localized inversion recovery sequence and a FAIR-RARE imaging sequence (T1 mapping) were used, followed by a 3-parameter least squares fit. For the calibration measurements, the mean T1 values of each T1 mapping were used for the fit of:
$$R_1 = A + B \cdot T + C \cdot pO2 + D \cdot T \cdot pO2$$
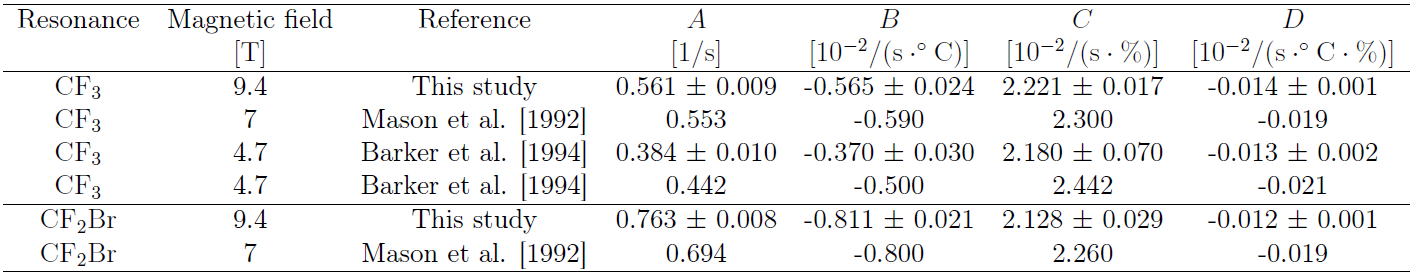
where $$$R_1 = 1/T_1$$$ is the relaxation rate, T is the temperature [°C] and A, B, C, and D are the fit parameters. Before each bioreactor experiment, T1 of the CF3 and CF2Br resonance were separately measured to solve the dependence on T and pO2. For each experiment, only T1 of the CF3 resonance was measured.
For perflubron tracking, a SinglePulse sequence was used, followed by numerical integration of the CF3 resonance. Table 1 lists the sequence parameters for each experiment. The analysis was done in Matlab R2015a (The MathWorks Inc, Natick, USA).
Results and Discussion:
Table 2 (literature values included6,7) lists the calibration parameters for both resonances. The higher magnetic field changed parameter A for CF2Br whereas the other parameters did not change much.
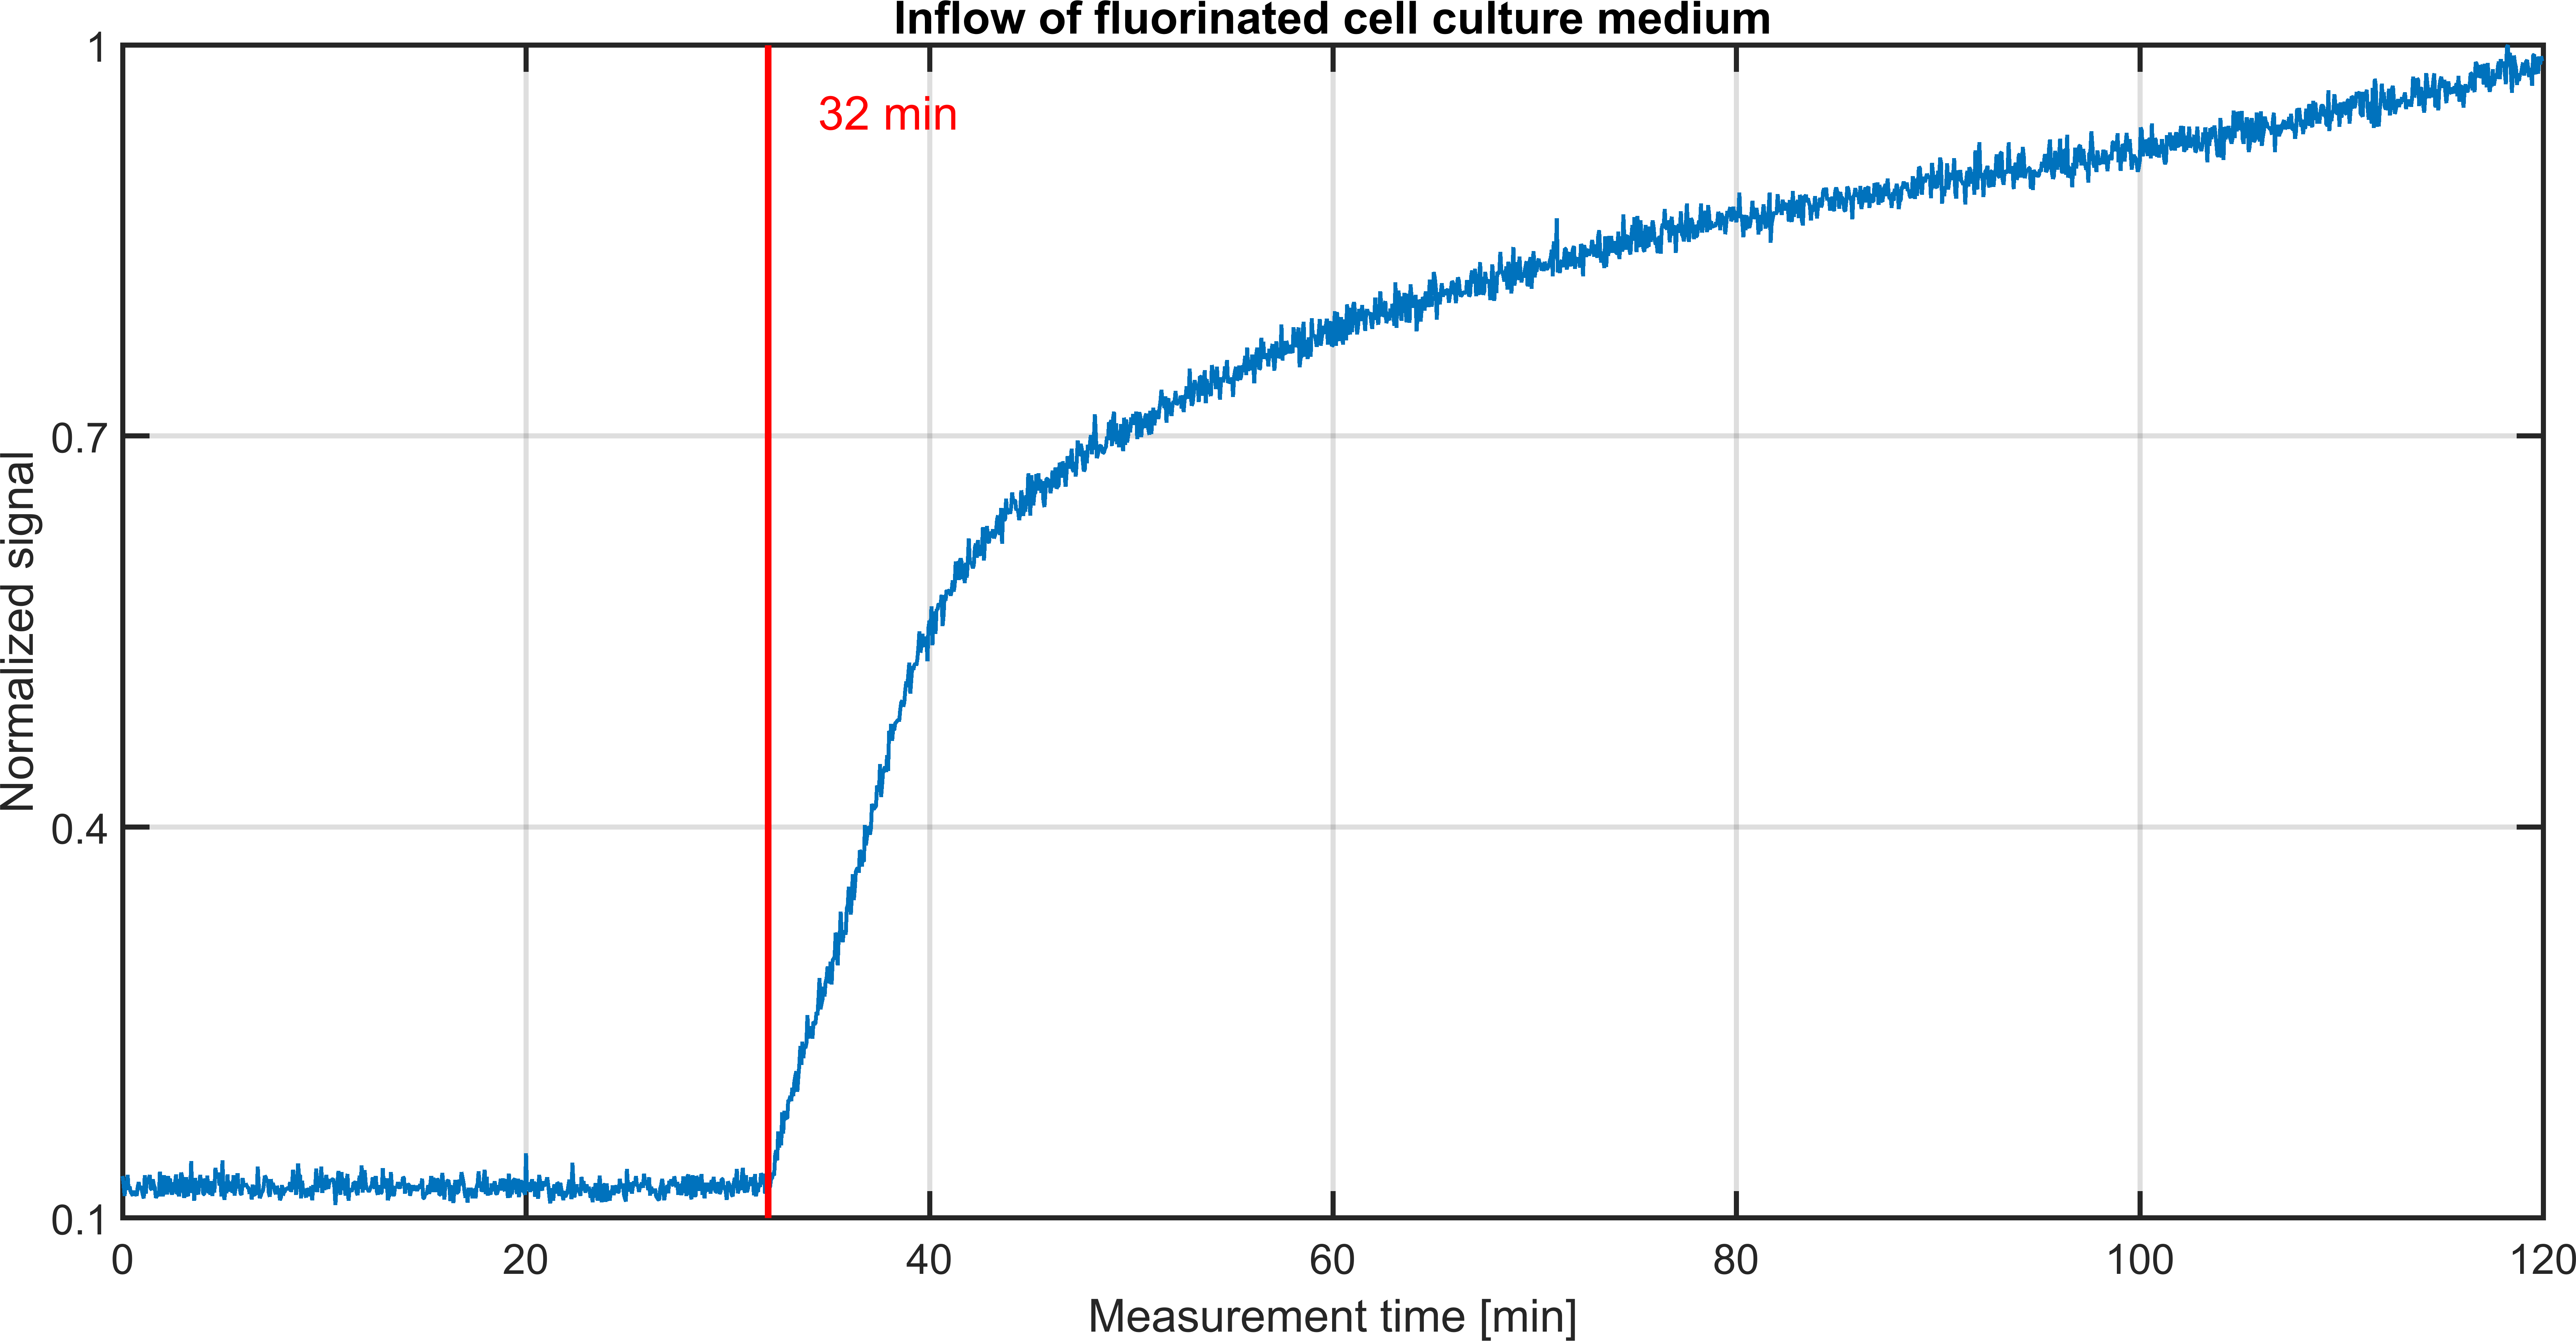
The inflow of the fluorinated medium led to a steep signal rise after 32 min (Fig.2). The placement of the pump and the heating bath outside the scanner room led to this late signal rise.
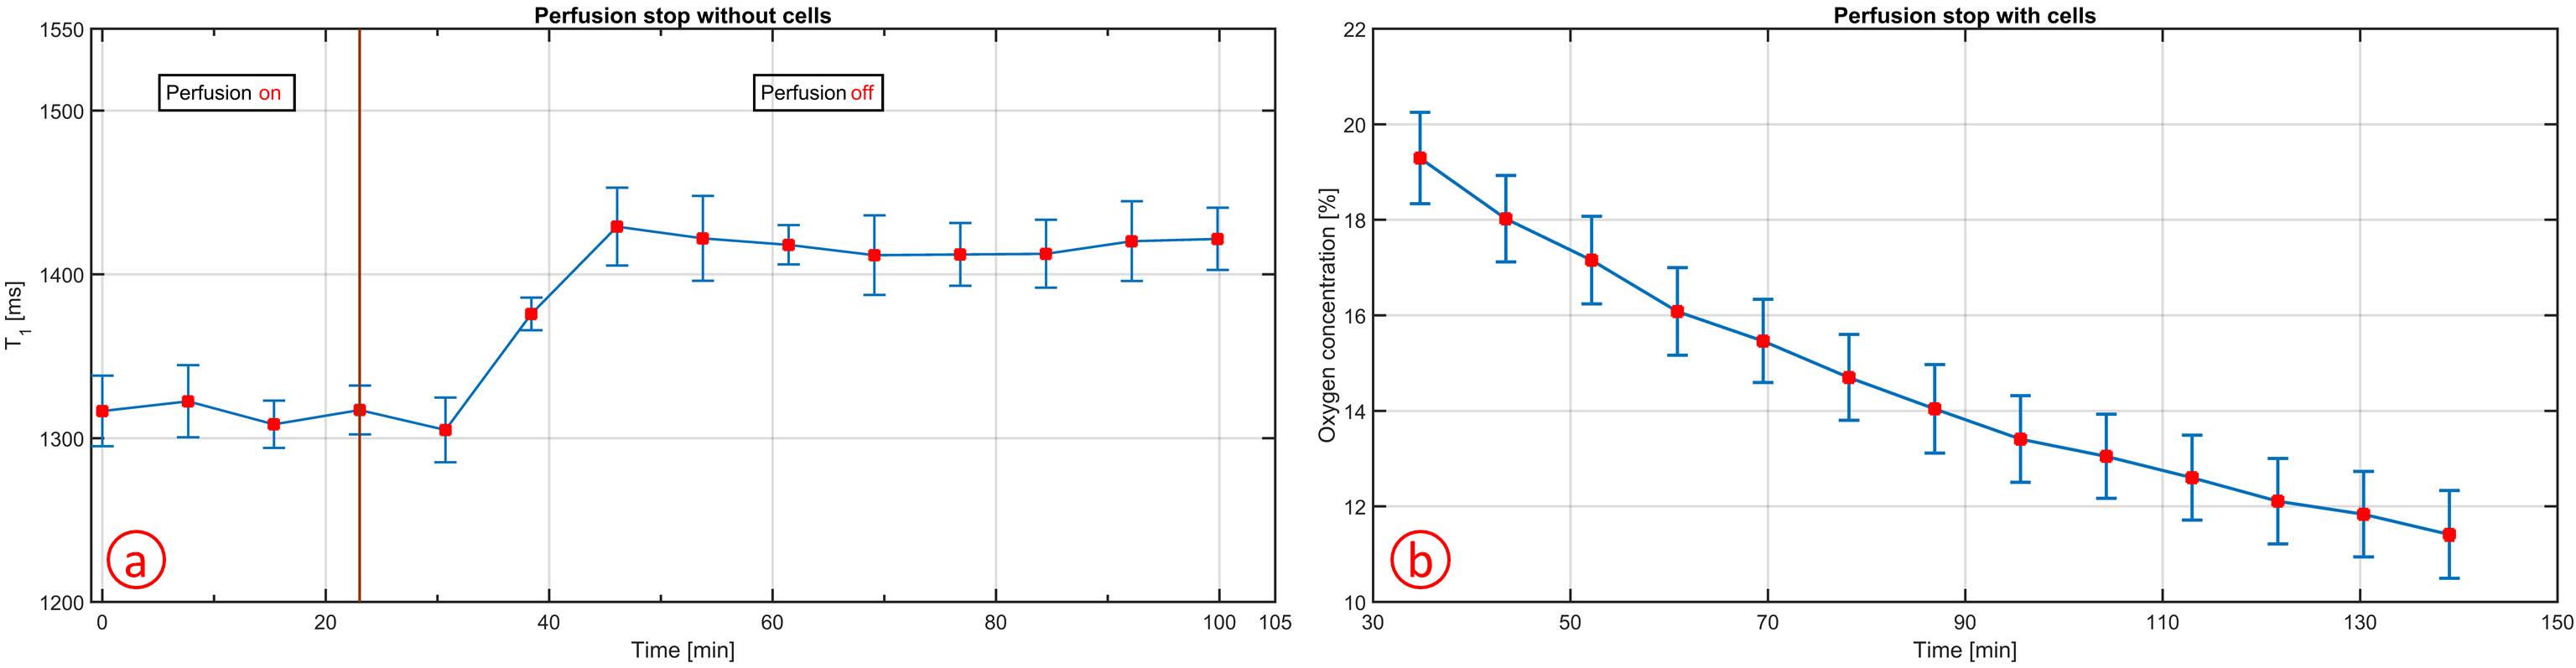
The influence of the perfusion on T1 was gone after 23.07 min (Fig.3a). Therefore, the first three T1 values during the oxygen consumption measurement were removed (Fig.3b). By replacing the empty chip with the cell chip, a reduction in the oxygen concentration from (19.29 ± 0.96)% to (11.41 ± 0.92)% in 104.24 min during a perfusion stop was observed (Fig.3b). The oxygen consumption could be completely attributed to the presence of cells as no oxygen consumption was measured without cells (Fig.3a). This novel method allowed for the determination of the oxygen consumption without the need for adapting the bioreactor setup8.
Conclusion:
The oxygen consumption of cells was successfully measured via 19F by the use of a perfusion stop. The non-invasive measurement and the high level of control of physiological parameters create unique opportunities. The next step is the induction of mitochondrial dysfunction in one compartment with the second as control. The use of the FAIR-RARE sequence allows for a determination of the oxygen consumption in both compartments. Thus, the mitochondrial dysfunction might be detected during a perfusion stop.Acknowledgements
This work was carried out with the support of the Karlsruhe Nano Micro Facility (KNMF, www.kit.edu/knmf ), a Helmholtz Research Infrastructure at Karlsruhe Institute of Technology (KIT, www.kit.edu ). The equipment for the preparation of the emulsion was provided by the Department of Clinical Radiology and Nuclear Medicine (www.umm.uni-heidelberg.de/inst/radchem).References
1 Hussaini H, et al., Idiosyncratic drug-induced liver injury: an overview. Expert Opin Drug Saf 2007;6:673–684.
2 Riess J, Oxygen Carriers(“Blood Substitues”)Raison d’Etre, Chemistry, and Some Physiology Blut ist ein ganz besondrer Saft. Chem Rev, 2001;101:2797-2920.
3 Gottwald E, et al., Characterization of a chip-based bioreactor for three-dimensional cell cultivation via Magnetic Resonance Imaging. Z Med Phys, 2013;23:102-110.
4 Gottwald E, et al., A chip-based platform for the in vitro generation of tissues in three-dimensional organization. Lab Chip, 2007;7:777-785.
5 Altmann B, et al., The three-dimensional cultivation of the carcinoma cell line HepG2 in a perfused chip system leads to more differentiated phenotype of the cells compared to monolayer culture. Biomed Mater, 2008;3:034120.
6 Mason R, et al., A noninvasive assessment of myocardial oxygen tension: 19f nmr spectroscopy of sequestered perfluorocarbon emulsion. Magn Reson Med, 1992;27:310–317.
7 Barker B, et al., Oxygen tension mapping with F‐19 echo‐planar MR imaging of sequestered perfluorocarbon. J Magn Reson Imaging, 1994;4:595–602.
8 Pilatus U, et al., Real-time measurements of cellular oxygen consumption, pH, and energy metabolism using nuclear magnetic resonance spectroscopy. Magn Reson Med, 2001;45:749–755.
Figures