3883
In vivo 31P MRI at 7 Tesla in humans using a 3D spectrally selective SSFP sequence and TPI k-space sampling.1DRF-ISVFJ-NeuroSpin, CEA, Paris Saclay University, Gif sur Yvette, France, 2Neurology Department, RWTH Aachen University Hospital, Aachen, Germany
Synopsis
Spectrally selective 31P MRI can be of interest for the study of brain energetics for clinical research. Using a 3D SSFP sequence with non-Cartesian Twisted Projection Imaging sampling, we obtained whole-brain images of ATP and PCr in healthy volunteers at 7 Tesla with a higher normalized SNR than with CSI. Local concentration quantification was performed using the phantom replacement approach after accounting for the T1/T2-weighting and the transmission and reception profiles of our coil yielding consistent results.
Introduction
31P NMR is of interest to investigate non-invasively energy metabolism in normal or pathological conditions[1-4]. While a majority of clinical studies relies on MRS approaches such as Chemical Shift Imaging (CSI)[5-7], spectrally selective approaches have recently been proposed to study one or more metabolites of interest[8-11] such as ATP, PCr or Pi. In this proof-of-concept study, we implemented a spectrally selective Steady State Free Precession (SSFP) sequence combined to a Twisted Projection Imaging (TPI) non-Cartesian k-space sampling scheme[12] to improve the clinical viability of whole brain investigation of phosphorylated metabolites.Methods
To selectively excite the different metabolites-of-interest, a Gaussian pulse was implemented within a SSFP sequence with TPI sampling, its duration and frequency offset being adjustable. At 7 Tesla, for imaging PCr or αATP, a minimum duration of 4ms was sufficient to reach a 600 Hz bandwidth corresponding to the frequency gap between their closest neighbors (with the exception of NAD/NADH for αATP), resulting in an echo-time of 2.3ms. For Pi MRI as it is surrounded by PME and PDE it was necessary to reduce the excitation bandwidth, a duration of 8ms was thus used, resulting in TE of 4.3ms. A resulting 300Hz bandwidth allows to only excite Pi.
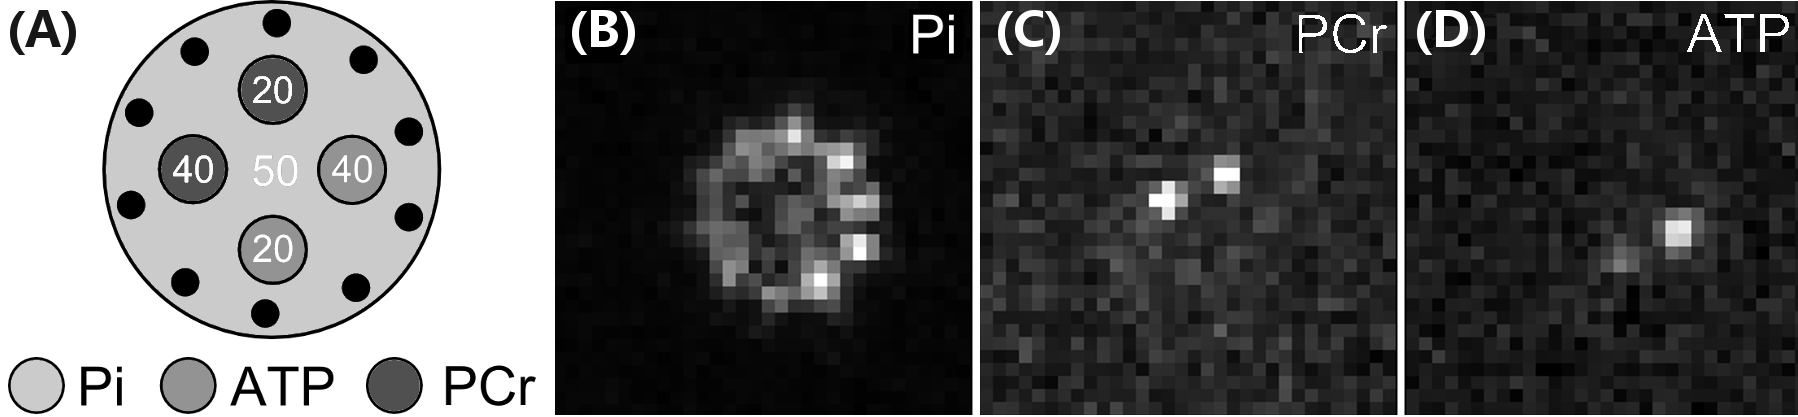
31P MR data were acquired on a 7T Magnetom scanner (Siemens Healthineers, Germany) using a dual-resonance 1H/31P phased array RF coil (RRI, USA). 3D 31P MRI data were first acquired on a multi-compartmental phantom (Fig.1) to validate our sequence (TE/TR=2.5/100ms, FA=20°, 2 averages, 3000 spokes and linear fraction of 35%). Two healthy volunteers (35y.o.♂ & 25y.o.♀) were scanned for in vivo validation (TE/TR=2.3/100ms, FAPCr/FAαATP=15°/23°, 1400 projections and linear fraction of 35%) after approval of the local ethics and scientific committees. For comparison, 2D CSI data were acquired as well (TE/TR=2.3/200ms, FA=20°, 8 averages, theoretical resolution 12.5x12.5x20mm3, TA: 19min).
Raw 31P MRI data were reconstructed using an homemade Python implementation of a Kaiser-Bessel Gridding algorithm[13] and post-processed using a Non Local Mean denoising Filter[14]. CSI data were preprocessed using CSI-APO[15] for zero- and first-order phase correction and a 20Hz Lorentzian temporal filtering prior to spectral decomposition using LCModel[16-18]. 31P MRI and CSI data were manually co-registered to anatomical T1w images (acquired at 3T) using an affine transformation. Signal intensity calibration was performed using the phantom replacement technique with an ellipsoidal phantom (PBS at 10mmol/L). To account for the differential T1/T2 weighting between in vitro and in vivo acquisitions, the SSPF signal equation[21] was considered with relaxation times for ATP, PCr and Pi from literature data[19,20]: $$S \propto \rho B_1^- \frac{1-e^{{-TR}/{T_1}}}{1-(e^{{-TR}/{T_1}}+e^{{-TR}/{T_2}})cos(\alpha)+e^{{-TR}/{T_1}}e^{{-TR}/{T_2}}}sin(\alpha)e^{{-TE}/{T_2^*}} $$
Results and Discusstion
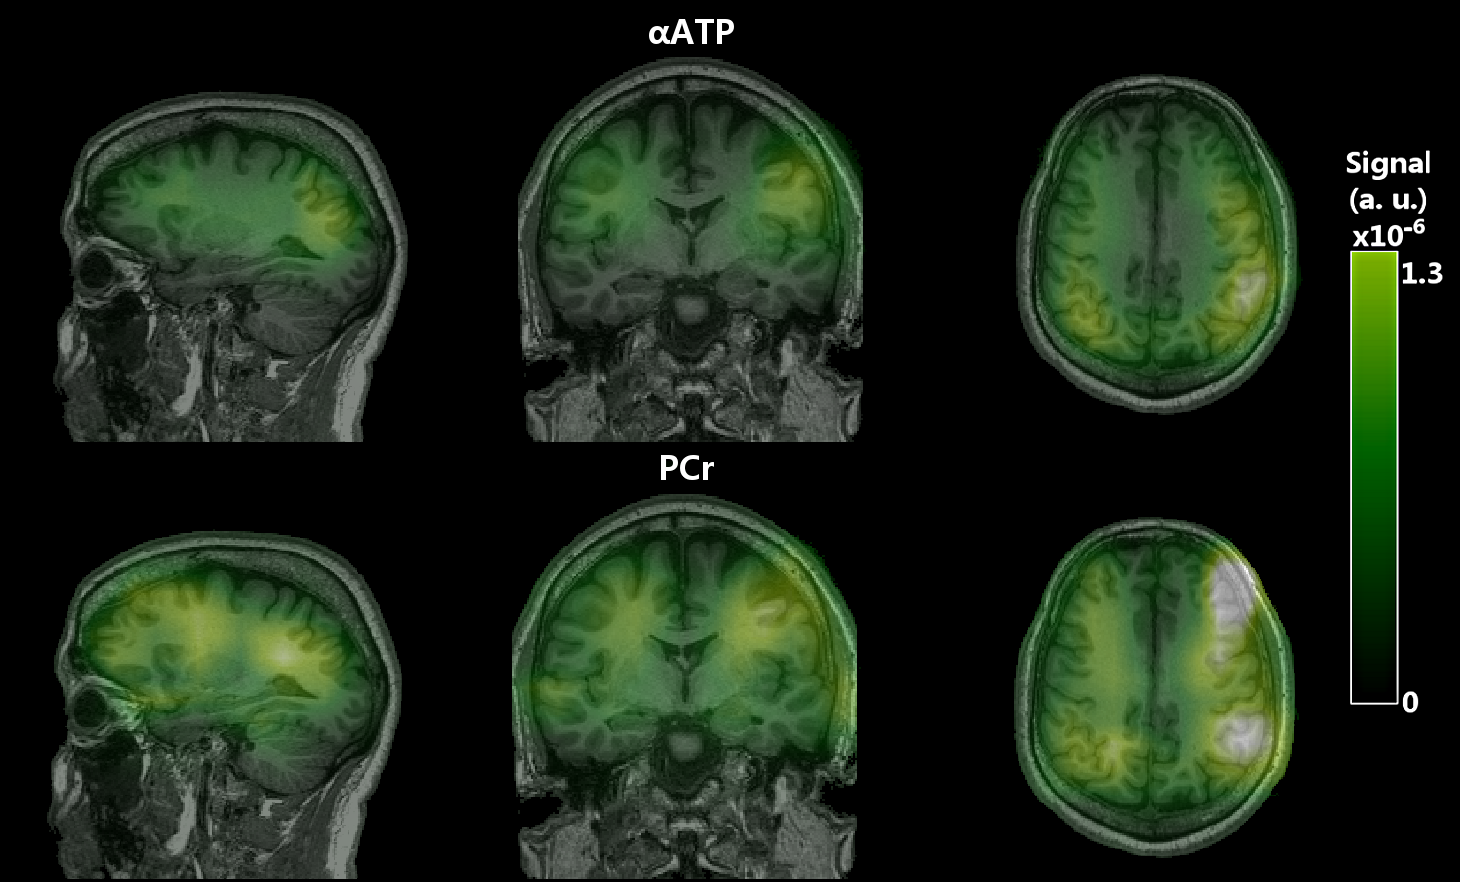
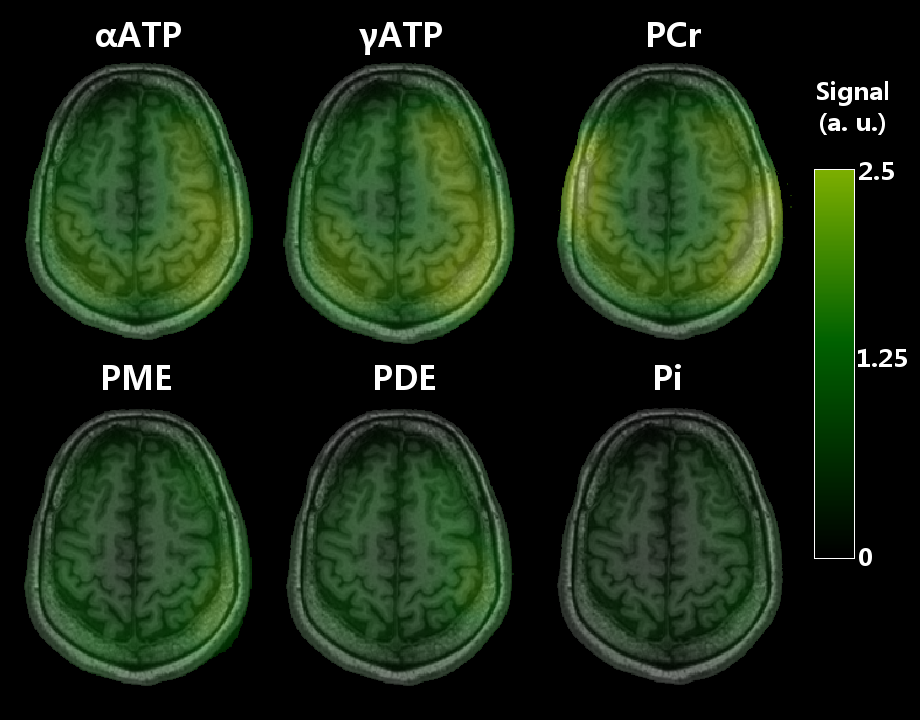
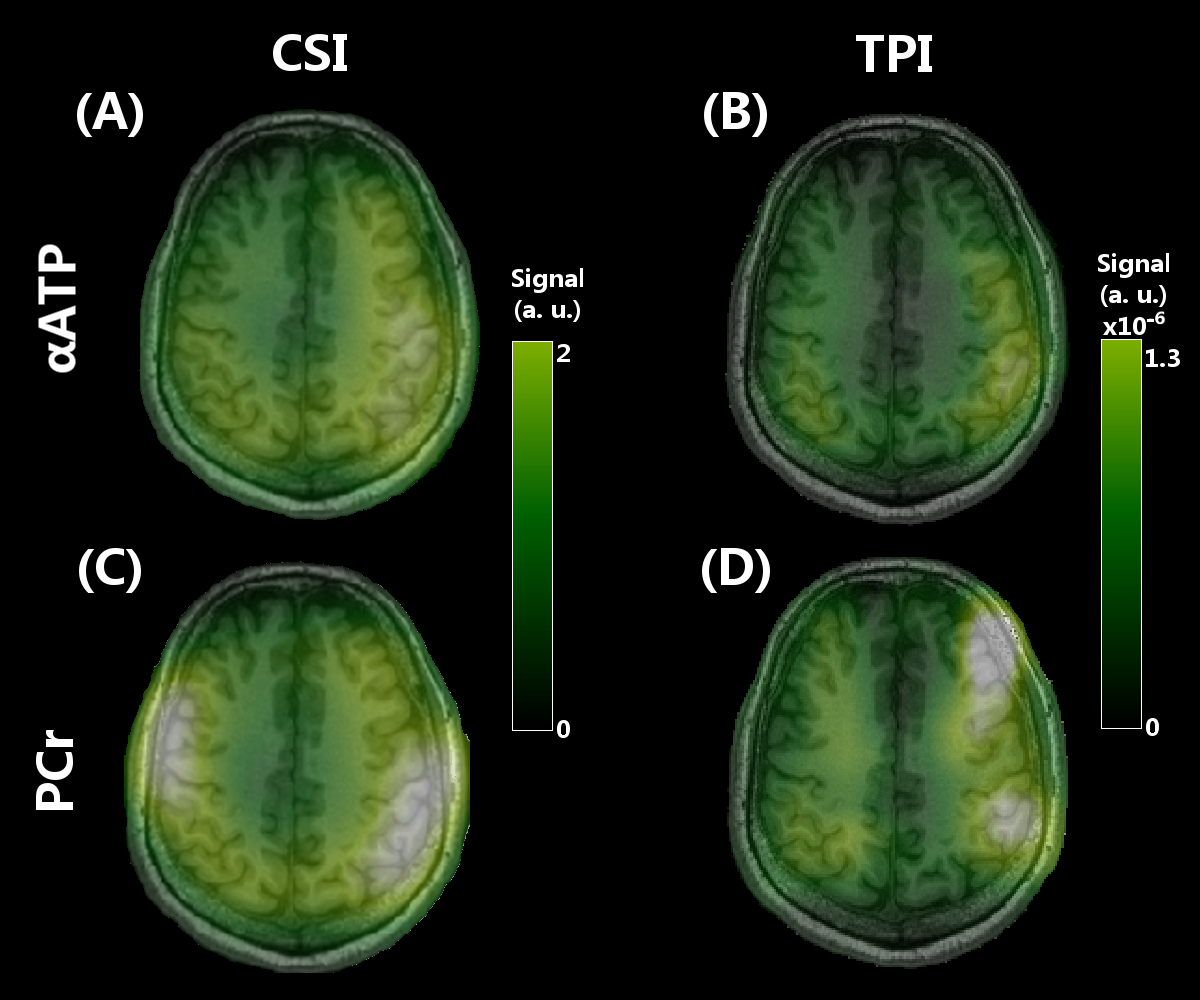
Figure 1 shows our in vitro PCr, αATP and Pi images, demonstrating the validity of our spectral selection. As shown by the PCr and αATP images (Figure 2), our SSFP sequence performed well in vivo also. Likewise, our 2D CSI data were successfully analyzed to yield PCr, Pi, ATP, PME and PDE images (Figure 3). While 31P image were similarly impacted by the heterogeneous coil profile, one can appreciate the whole-brain coverage achieved with the 31P SSFP TPI approach and the enhanced sensitivity. Figure 4 allows to compare the images obtained with CSI and TPI on the same volunteer. Due to the highly inhomogeneous transmission profile of our 31P coil, SNR measurements were only performed in two distinct ROIs (center and periphery of the brain) in both CSI and TPI images. PCr-CSI maps exhibited SNR values (in dB) of 3.9 and 3.3 while values for PCr-SSFP maps were 20.3 and 18.1 at the periphery and the center respectively. Using B1 profiles acquired in vitro to correct for the heterogeneous flip angle and sensitivity, concentrations were estimated in the two ROI leading to comparable concentrations (in mmol.L-1): CSI: [PCr]center =2.6, [PCr]periphery = 3.1; SSFP: [PCr]center =3.0, [PCr]periphery = 2.6. Reaching concentration was not possible yet as it requires advanced transmission profile corrections.Conclusion
As demonstrated by this modest proof-of-concept study, our SSFP TPI approach presents several advantages over state-of-the-art CSI acquisitions for the application of 31P MRI for clinical research in terms of spatial coverage, k-space sampling efficiency and overall sensitivity. Obviously, it comes at the expense of a loss of additional metabolic information. However, some of this metabolic information could be recovered by performing an interleaved acquisition of two to three resonances[4]. The significant gain in SNR could be used to further improve the spatial resolution or reduce the acquisition time making dynamic 31P MRI studies manageable in a clinical setting. Further work will be conducted to better account for the inhomogeneous transmission/reception profiles and complete our quantification pipeline.Acknowledgements
References
[1] Hooijmans M.T. et al., PLos ONE., 2017
[2] Chaumeil M.M. et al., PNAS, 2009
[3] Stoll V.M. et al., Radiology, 2016
[4] Norén B. et al. European Radiology, 2004
[5] Lei H. et al., MRM, 2003
[6] Van Der Kemp W.J.M. et al., NMR Biomed, 2013
[7] Korzowski A. et al., MRM, 2017
[8] Lu A. et al. MRM, 2013
[9] Parasoglou P. et al., Proc ISMRM 2016
[10] Rink K. et al., MRI, 2017
[11] Rink K. et al., MRI, 2016
[12] Boada F.E. et al., MRM, 1997
[13] Jackson J.I. et al., IEEE TMI, 1991
[14] Buades A. et al., Comp Vision Pat Recog, 2005
[15] Le Fur Y. et al., MAGMA, 2010
[16] Provencher Y. et al., MRM, 1993
[17] Lopez Kolkovsky A. et al., MRM, 2016
[18] Deelchand H. et al., NMR Biomed, 2015
[19] Lei H. et al., MRM, 2001
[20] Lu M. et al., NMR Biomed, 2014
[21] Bernstein M. et al., Handbook of MRI pulse sequences, 2004
Figures