3878
Simulation of 13C labeling Effects of Glutamate and Glutamine in 1H MR Spectra with different Pulse Sequences at 9.4 T1High-Field Magnetic Resonance, Max-Planck-Institute of Biological Cybernetics, Tübingen, Germany, 2Graduate School of Neural and Behavioural Sciences, Tuebingen, Germany, 3Institute of Physics, Ernst-Moritz-Arndt University Greifswald, Greifswald, Germany
Synopsis
Glutamate related metabolism can be measured considering the 13C labeling effects from an administered 13C labeled substrate in pure 1H MRS spectra without a 13C channel. In this work, simulated 1H MRS spectra with FID, semi-Laser, and two PRESS sequences have been compared to optimize spectral resolution for glutamate and glutamine measurements at 9.4 T. Furthermore, spectral changes according to a two-compartment model were analyzed. As a result, this work indicates the fastest possible acquisition can be obtained with an FID sequence, while the best resolution possible can be obtained with a PRESS sequence.
Purpose
Altered glutamatergic metabolism is relevant in many psychiatric disorders. Changed levels of glutamate (Glu), glutamine (Gln) or a mixture of both (Glx) were found in patients suffering from Major Depressive Disorder using 1H MRS1-3. However, 1H MRS does not allow for direct assessment of metabolic turnover rates like Glu-Gln or TCA cycle rates to achieve better insights into the pathophysiology behind altered Glu concentrations. Metabolic rates are usually measured with direct or indirect 13C MRS during infusion of 13C labeled substrate, e.g. Glucose (Glc)4-6. Recently, first results show the feasibility to observe 13C label incorporation using conventional 1H MRS7,8 by observing additional peak splitting due to J-coupling of protons and 13C nuclei. These additional peaks complicate the spectra, but spectral resolution can be increased with the usage of ultra-high-fields (≥ 7T). In this work, the 13C labeling effect on the spectral appearance of 1H spectra is analyzed using simulations that consider realistic line width and spectral pattern in the human brain at 9.4 T and a two-compartment model of 13C label incorporation. Different 1H MRS sequences are compared with regard to resolving the additional spectral peaks.Methods
Basis sets consisting of 21 metabolites were simulated using the density matrix simulation program VeSPA9 with experimentally measured chemical shifts and J-coupling constants10-13 with the following sequences: FID sequence14, Spin-Echo with TE=6.5 ms to match in vivo data with MC semi-Laser sequence as done by Giapityakis15, an echo-time optimized PRESS sequence with (TE1/TE2 = 69/37ms)16 and a PRESS sequence with (TE1, TE2 = 37/63 ms)17 which was optimized for metabolite resolution enhancement (e.g. Glu, Gln) at 7T. Initial concentrations were adjusted to get a typical 9.4 T human brain spectrum with a Gaussian spectral width of 20 Hz, 8192 spectral data points and a spectral sweep width of 8000 Hz.
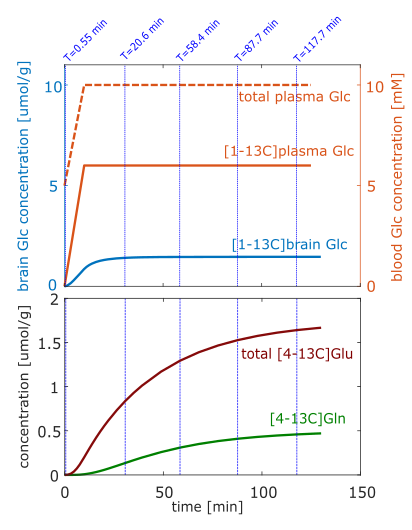
A two-compartment model with metabolic rates taken from Mason et al.4 is used to calculate, with CWave18,19, the time courses of [4-13C]Glu, [4-13C]Gln and brain [1-13C]Glc concentrations. Different rates and metabolic pathways for the neuronal and the astrocytic compartment are taken into account. Plasma [1-13C]Glc is the source of 13C for the modeling; its time-course is displayed in Fig 2. The plasma Glc then enters the brain, which is calculated by the Michaelis-Menten kinetics. In the subsequent glycolysis, one Glc molecule is metabolized to two pyruvate molecules, one of them labelled with 13C. In the first TCA turn the 13C atom can be incorporated in Glu and then in Gln molecules. Subsequent TCA cycles were not considered. In the following, the term Glu denotes the sum of neuronal and astrocytic Glu.
Results
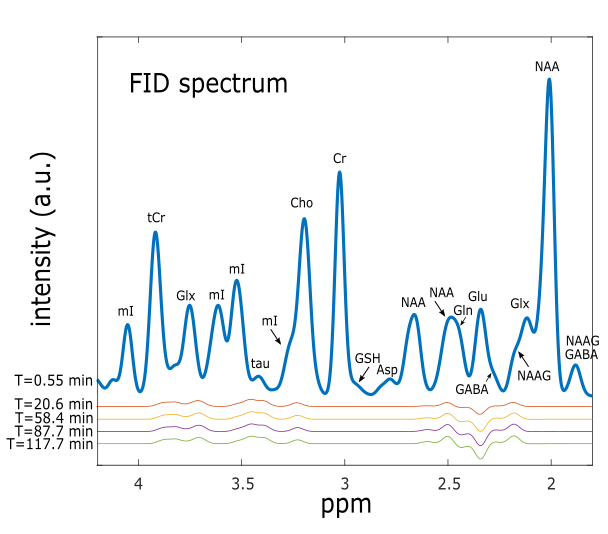
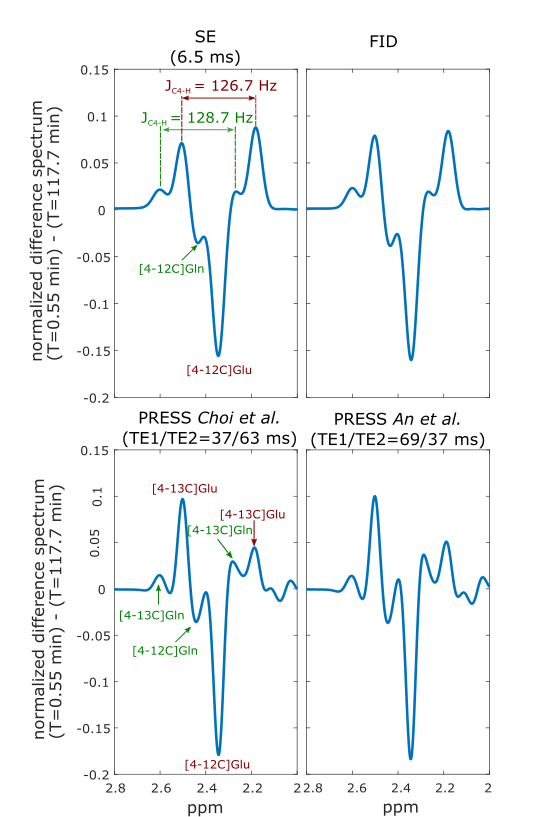
Time-courses of simulated concentration and percent enrichment of brain [1-13C]Glc, [4-13C]Glu and [4-13C]Gln are shown in Fig. 2 and are used to scale the basis sets for the different sequences at different time-points. The spectrum for the FID sequence at the beginning of the [1-13C]Glc administration and time-course difference spectra for four different times are displayed in Fig. 1. Peak changes between 3-4 ppm arose from the increase of Glc concentration as well as the increase of Glc labeling. The displayed difference spectra (T = 117.7 min) for all sequences in Fig. 3 allow the closer analysis of the peak changes around 2.5 ppm. It can be seen that the [4-12C]Glu peak at 2.345 ppm is decreased with time while the [4-13C]Glu peaks at 2.503 ppm and 2.187 ppm increased. The same holds true for the decreased [4-12C]Gln peak at 2.443 ppm, while [4-13C]Gln peaks at 2.604 ppm and 2.282 ppm increase with time.
The comparisons of the different sequences show that the [4-12C]Glu and [4-12C]Gln peak can easily be resolved in all data and the peak height of [4-12C]Glu is about 15% reduced after about 2h. In the FID and the SE results the [4-13C]Glu peaks changes exhibit stronger characteristics than the [4-13C]Gln peaks, while both PRESS results provided slightly better resolved [4-13C]Gln peaks.
Conclusion and Outlook
With these simulation results, it can be shown
that at 9.4T peaks considering line width realistic in the human brain [4-12C]Glu
and [4-12C]Gln can be easily resolved and the peak splitting due to the
additional 13C label incorporation can be quantified with all used pulse
sequences. Even a simple FID sequence provides sufficient resolution to
quantify [4-13C]Glu and [4-13C]Gln peaks from which Glu-Gln cycle rates could
be calculated. Furthermore, the FID MRSI sequence will potentially enable
mapping of metabolic turnover rates.Acknowledgements
Funding by the European Union (ERC Starting Grant, SYNAPLAST MR, Grant Number: 679927) is gratefully acknowledged.References
1. Luykx JJ, Laban KG, van den Heuvel, et al. Review: Region and state specific glutamate downregulation in major depressive disorder: A meta-analysis of 1H-MRS findings. Neurosci Biobehav R. 2012;36(1):198-205
2. Mitchell N, Baker G. An update on the role of glutamate in the pathophysiology of depression. Acta Psychiat Scand. 2010;122(3):192-210
3. Yüksel C, Öngür D. Magnetic resonance spectroscopy studies of glutamate-related abnormalities in mood disorders. Biol Psychiat. 2010;68(9):785-794
4. Mason GF, Petersen K, de Graaf R. A comparison of 13 C NMR measurements of the rates of glutamine synthesis and the tricarboxylic acid cycle during oral and intravenous administration of. Brain Res Protoc. 2003;10:181-190
5. Rothman D, Novotny H, Shulman G, et al. 1H-[13C] NMR measurements of [4-13C] glutamate turnover in human brain. Proc Nati Acad Sci USA. 1992;89:9603-9606
6. Morris P, Bachelard H. Reflections on the application of 13C-MRS to research on brain metabolism. NMR Biomed; 2003(6-7):303-312
7. Boumezbeur F, Besret J, Valette J, et al. NMR measurement of brain oxidative metabolism in monkeys using 13C-labeled glucose without a 13C radiofrequency channel. Magn Reson Med. 2004;52(1):33-40
8. An L, Li S, Ferraris Araneta M, et al. In Vivo Detection of 13 C Labeling of Glutamate and Glutamine Using Proton MRS at 7T. Proc Intl Soc Mag Reson Med. 2015;23:207
9. Soher BJ, Semanchuk P, Young K, Todd D. Vespa-Simulation Website https://scion.duhs.duke.edu/vespa/simulation (08/11/2017)
10. Govindaraju V, Karl Y, Maudsley A. Proton NMR chemical shifts and coupling constants for brain metabolites. NMR Biomed. 2000;13(3):129-153
11. Govindaraju V, Karl Y, Maudsley A. Corrigendum: Proton NMR chemical shifts and coupling constants for brain metabolites.
12. Govindaraju V, Young K, Maudsley AA, NMR Biomed . 2000; 13: 129-153. NMR Biomed 2015;28(7):923-924 Near J, Evans CJ, Puts NA, et al. J-difference editing of gamma-aminobutyric acid (GABA): simulated and experimental multiplet patterns. Magn Reson Med. 2013;70:1183-1191
13. de Graaf RA. In Vivo NMR Spectroscopy, 2nd Edition. 2017, John Wiley & Sons
14. Nassirpour S, Chang P, Henning A. High and ultra-high resolution metabolite mapping of the human brain using 1H FID MRSI at 9.4T. Neuroimage; 2016
15. Giapitzakis I, Henning A. Basis set optimization for quantification of semi-LASER at 9.4T under consideration of CP effect and relaxation. Proc Intl Soc Mag Reson Med. 2017;25:2992
16. An L, Li S, Murdoch J, et al. Detection of glutamate, glutamine, and glutathione by radiofrequency suppression and echo time optimization at 7 Tesla. MRM. 2015;73(2):451-458
17. Choi C, Dimitrov I, Douglas D, et al. Improvement of resolution for brain coupled metabolites by optimized 1H MRS at 7T. NMR Biomed. 2010;23(9):1044-1052
18. Mason GF, Yale University CWave Software, Yale University
19. Mason GF. CWave: Software for the Design and Analysis of 13C Labeling Studies Performed In Vivo. Proc Intl Soc Mag Reson Med. 2000;8:1870
Figures