3876
Multi-pulse Sodium Magnetic Resonance Imaging for Multi-compartment Quantification in Brain at 7T1Center for Biomedical Imaging, Department of Radiology, New York University School of Medicine, New York City, NY, United States, 2Institute of Radiology, Friedrich-Alexander-University Erlangen-Nuremberg, Erlangen, Germany
Synopsis
We propose a new approach to investigate intra- and extracellular sodium in vivo. In this preliminary study we could differentiate brain compartments and provide an estimate of intracellular and extracellular sodium concentrations as well as intracellular, extracellular and cerebrospinal fluid volume fractions.
Introduction
The sodium cations (23Na+) play a major role in many fundamental physiological functions in human tissues1. The level of intra- and extracellular sodium concentrations (IC≈10-20 mM and EC≈140 mM, respectively)1,2 is tightly regulated in healthy mammalian tissue. Alterations in the distribution of sodium across the cell membrane may therefore be indicative of pathological conditions, either due to disease or during cell damage induced by therapy.
Sodium MRI is challenging, as the resulting images generally suffer from low signal-to-noise ratio. The signal is approximately 20000 times lower than the 1H signal in vivo, which makes ultra-high magnetic fields and lower resolutions necessary to increase SNR. Most of sodium MRI studies investigate the total sodium signal which therefore lack specificity about the origin of sodium signal variations and their link to valuable metabolic information3.
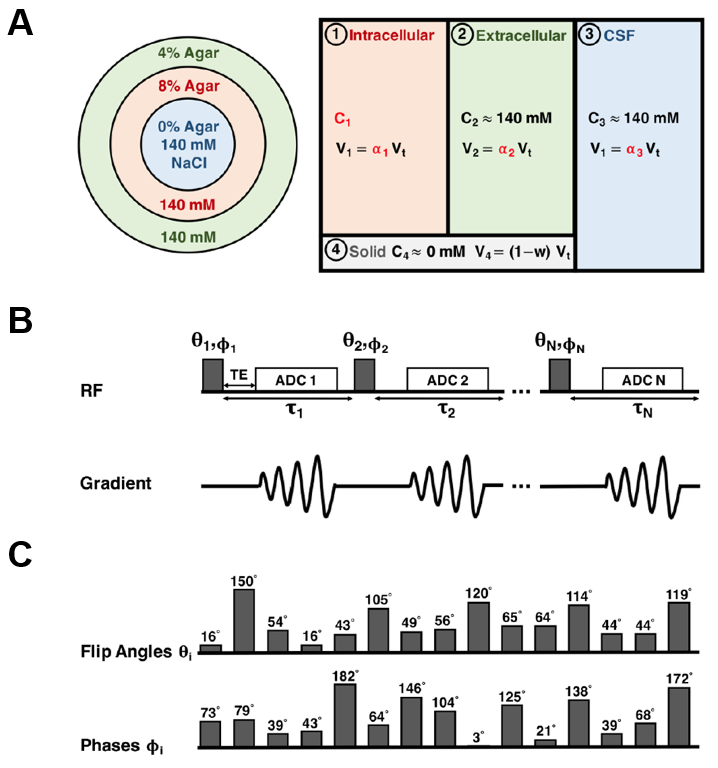
The compartments in the brain differ in their relaxation times and are assumed to correspond to the IC, EC, and the cerebrospinal fluid (CSF) compartments (compartments #: 1, 2 and 3). Inspired by MR fingerprinting4, with a multi-pulse sequence acquisition (e.g. 15 pulses), and a quantification method based on sodium spin 3/2 dynamics simulation, we could theoretically separate the sodium signal from these different compartments in human brain tissue in vivo. The separation with correction on water fraction maps5 could allow a quantitative estimation of IC sodium concentration (C1) as well as the volume fractions α1, α2 and α3 of the brain compartments.
In this pilot study, we present a proof-of-concept of the multi-pulse quantification method on a three-compartment phantom with known sodium concentration and volume fractions and its application to brain in vivo using a four-compartment brain tissue model at ultra-high field of 7T.
Methods
MRI experiments were performed on a 7T whole-body MR system (Siemens, Germany) using a custom-built dual-tuned 1H/23Na radiofrequency coil (diameter=27.9cm).
For simulation of the physiological compartments in the brain, a three-compartment phantom was fabricated with different agar gel concentrations (Fig.1). The method was tested in vivo on one human subject (male, 30years).
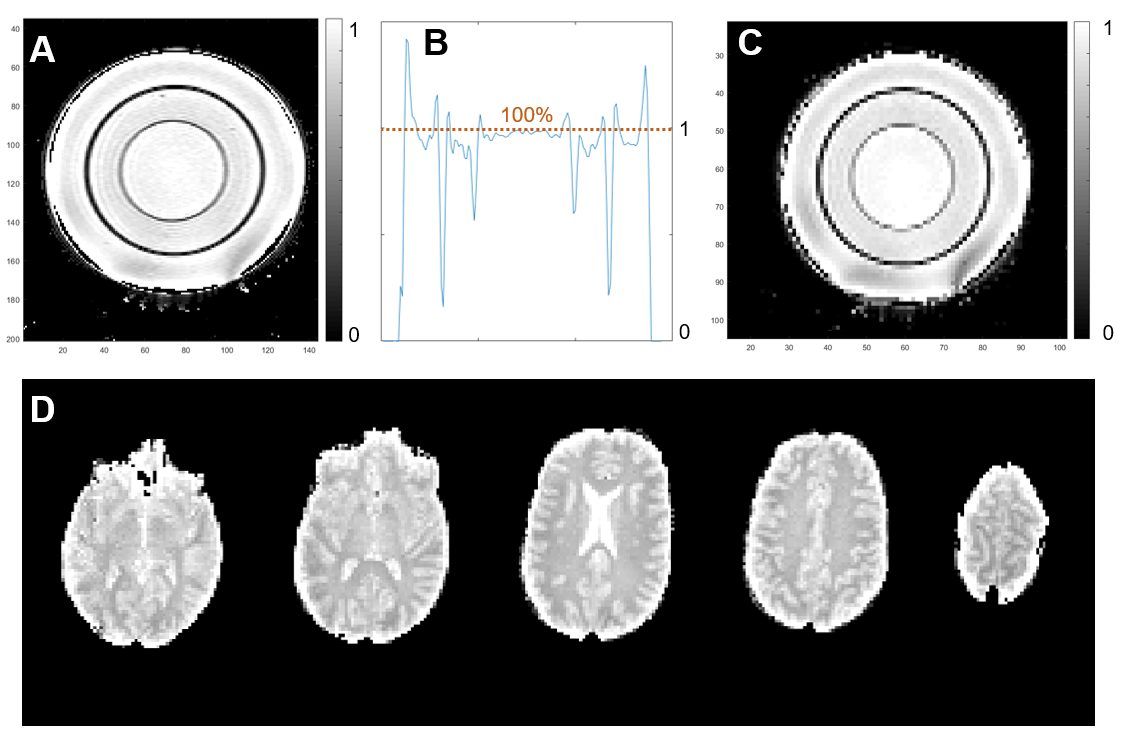
1H MRI: As a basis for brain masks as well as for anatomical comparison, MPRAGE sequence was performed (TR=2300ms, TE=2.86ms, resolution=1.25 mm isotropic, 1 average) with acquisition time (TA) of 5min. M0 maps of water content were calculated from 4 flip angles (1,4,8,10°) using spoiled gradient echo sequence (TR=8.6ms, TE=3.1ms, resolution=1.25mm isotropic, iPAT=2). Total TA was <6:30min.
23Na MRI: All sodium acquisitions were performed using a 15-pulse 3D non-Cartesian UTE FLORET sequence (Multi-FLORET)6,7 (Fig.1B). The i-pulses varied in flip angles (θi) and phases (φi,) with constat delay τi=5ms (Fig.1C) and duratio=1ms. Resolution was 5 mm isotropic, ADC duration was 4060ms with #interleaves/hub=818 (3 Hubs at 45°). Multi-FLORET in phantom: TR=620ms, TE=0.4ms, number of averages=2, TA=12:30 min/average. Multi-FLORET in brain: TR=470 ms, TE=0.4 ms, number of averages=1, TA=10:30 min/average.
Simulations: Multi-compartment signal was calculated with 16 irreducible spherical tensor operators in Matlab (MathWorks, USA). Parameters considered in the simulations include both sequence-specific parameters (θi, φi, τi, TE, TR), as well as compartment specific parameters in ranges: T1 [20-68]ms, T*2l [14-60]ms and T*2s [1-13]ms. As a measure of the apparent sodium concentrations we used magnetization in terms of: Mi=Ci x αi.
Results
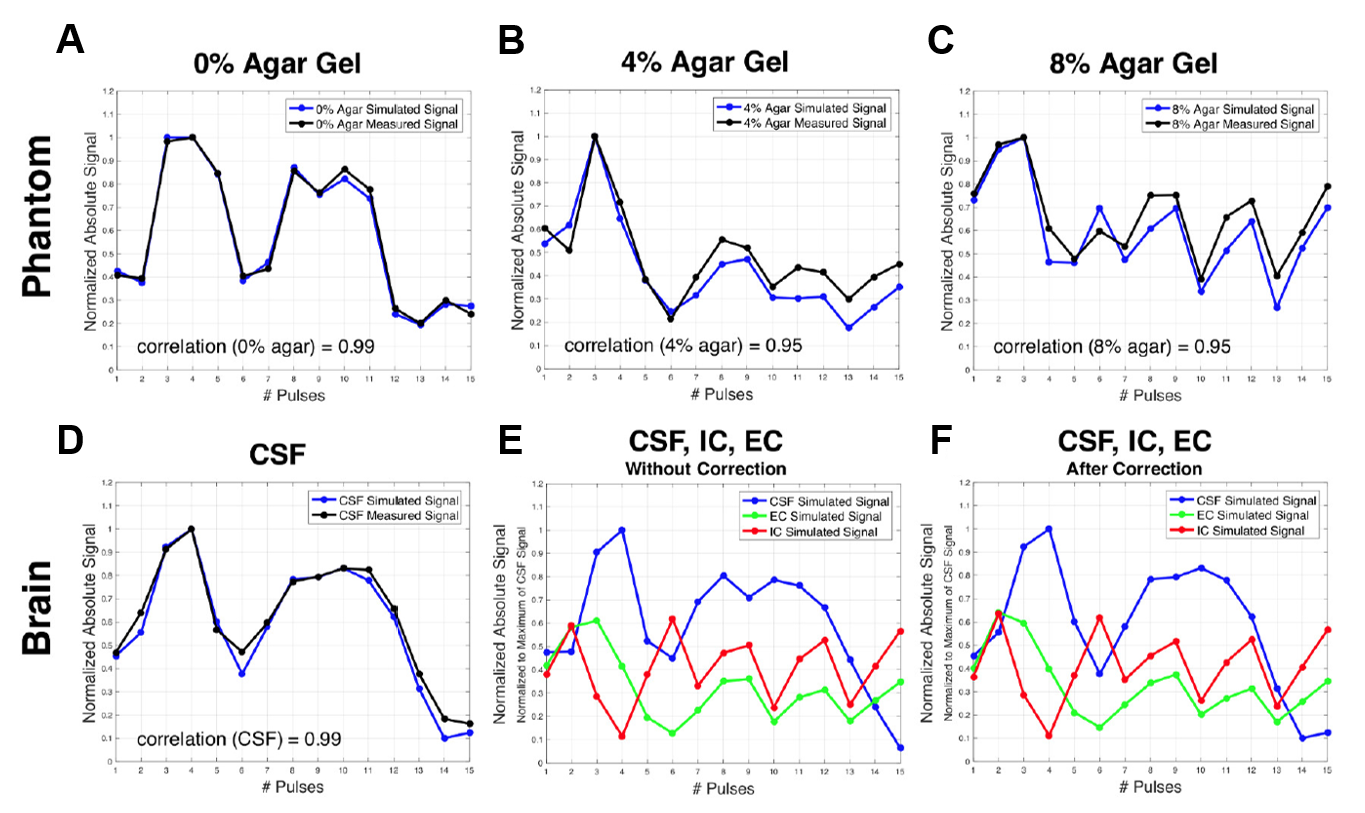
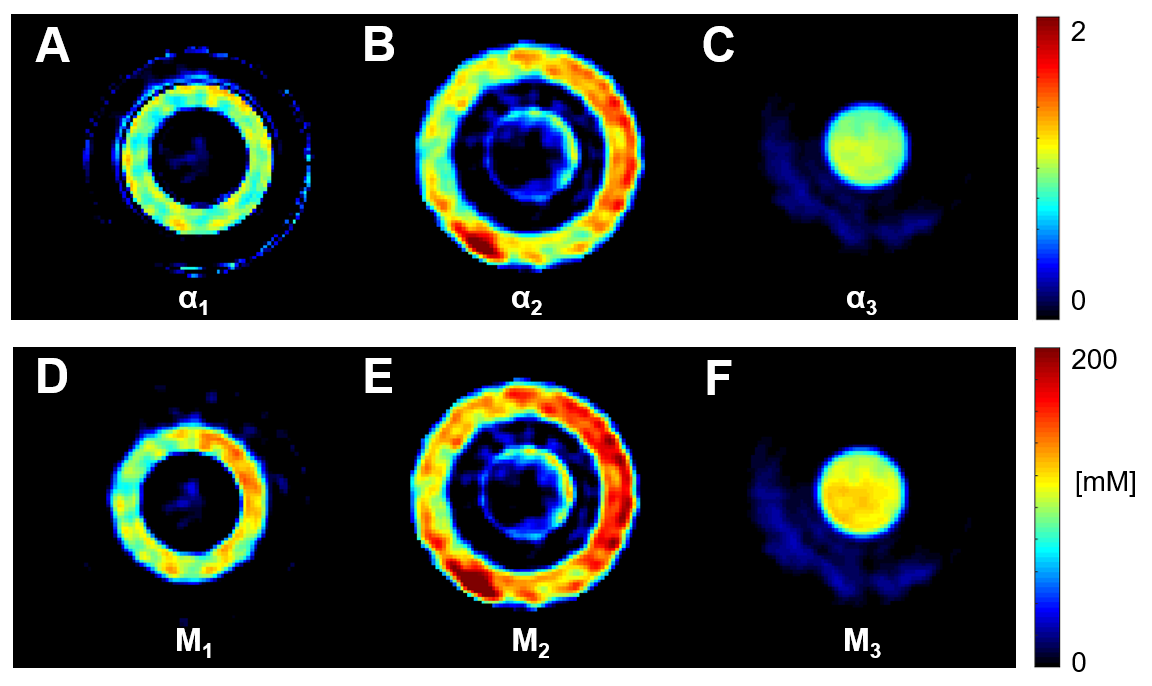
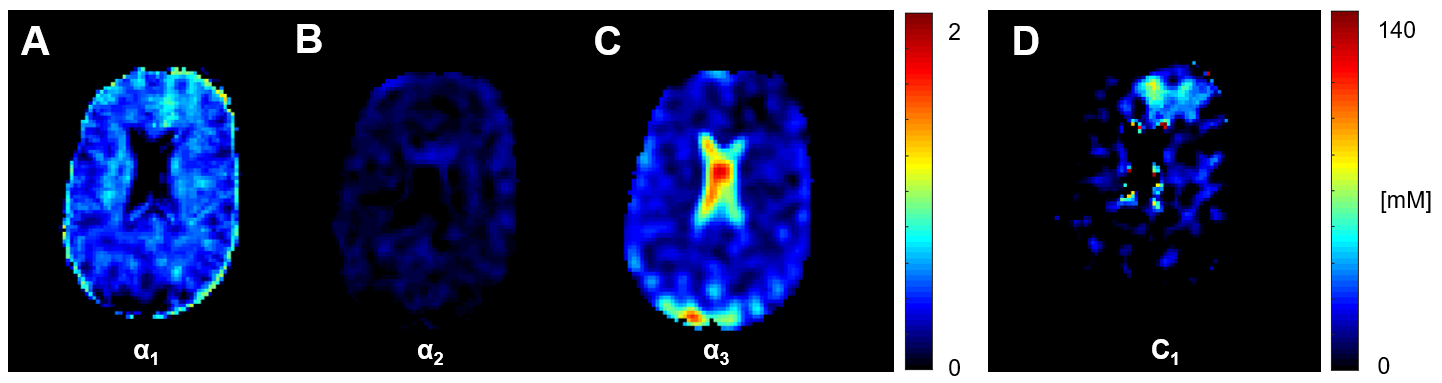
Measurements of water fraction maps were in agreement with expected phantom water content (Fig.2A) and the method was then applied on the brain in vivo (Fig.2D). Representative evolution of the sodium signal after each of the 15 pulses of the acquisition in the phantom and in brain is depicted in Fig.3. Multi-compartment phantom filtering and quantification results from the phantom measurements are in Fig.4. The volume fractions from in vivo measurements were as follows: α1=0.58±0.09, α2=0.08±0.04 and α3=0.82±0.16. Estimated C1 was 10.87±9.74. Quantified maps of α1, α2, α3 and C1 from one volunteer are shown in Fig.5.Discussion
The quantified phantom images of the magnetizations M1, M2, and M3 showed a good distinction between the phantom compartments, demonstrating the method’s applicability as a filtering technique for compartments with different relaxation times. According to theory, a distribution of α1~0.6, α2~0.2, and intracellular sodium concentration C1~0-20mM in gray and white matter brain tissue parts was expected. Our results show similar numbers in healthy brain.Conclusions
The quantitative multi-compartment multi-pulse sodium MRI method presented in this preliminary study can be seen as a new approach to investigate intra- and extracellular sodium in vivo. We could differentiate brain compartments and provide an estimate of IC and EC sodium concentrations as well as IC, EC and CSF volume fractions.Acknowledgements
The study was supported by the National Institutes of Health (NIH) grants: 1R01NS097494, 1R21CA213169 and 1P41EB017183.References
1. G. Madelin
and R. R. Regatte. Biomedical applications of sodium MRI in vivo. J Magn Reson
Imaging, 38:511–529, 2013.
2. R.
Ouwerkerk. Sodium MRI. Methods Mol Biol, 711:175–201, 2011.
3. P. M.
Winter and N. Bansal. TmDOTP5 as a Na-23 shift reagent for the subcutaneously
implanted 9L gliosarcoma in rats. Magn Reson Med, 45(3):436–442, 2001.
4. D. Ma, V. Gulani, N. Seiberlich, K. Liu, J. L.
Sunshine, J. L. Duerk, and M. A. Griswold. Magnetic resonance fingerprinting. Nature,
495(7440):187–192, 2013.
5. M. Sabati, AA.
Maudsley. Fast and high-resolution quantitative mapping of tissue water content
with full brain coverage for clinically-driven studies. Magn Reson Imaging.
2013 Dec;31(10):1752-9
6. G. Madelin,
R. Kline, R. Walvick, and R. R. Regatte. A method for estimating intracellular
sodium concentration and extracellular volume fraction in brain in vivo using
sodium magnetic resonance imaging. Sci Rep, 4:4763, 2014.
7. J.G. Pipe,
N.R. Zwart, E.A. Aboussouan, R.K. Robison, A. Devaraj, and K.O. Johnson. A new
design and rationale for 3D orthogonally oversampled k-space trajectories. Magn
Reson Med, 66(5):1303–1311, 2011.
Figures