3873
Influence of motion and partial volume effects on measured tissue sodium concentration in cardiac $$$^{23}$$$Na MRI1Medical Physics in Radiology, German Cancer Research Center (DKFZ), Heidelberg, Germany, 2Institute of Radiology, University Hospital Erlangen, Friedrich-Alexander-Universität Erlangen-Nürnberg (FAU), Erlangen, Germany
Synopsis
Sodium (23Na) ions are involved in many biological processes. The tissue sodium concentration can be determined with 23Na MRI; however, fast relaxation times, breathing and heart motion as well as the high sodium concentration of blood render quantitative determination of the myocardial sodium concentration challenging. We present a method to analyze the tissue sodium concentration within the myocardium by utilizing a partial volume correction as well as correction of motion effects. The presented workflow can reduce the bias by up to 49%.
Introduction
The sodium (23Na) ion distribution plays a fundamental role in biological processes in general1 and in myocardial function in particular2. In acute and chronic myocardial infarction, the myocardial sodium concentration is increased3,4,5. However, low spatial resolution, extremely fast transverse relaxation times, respiratory and cardiac motion and the approximately three times higher concentration of sodium within blood (79mM6) compared to muscle tissue (28.4mM7) render quantitative 23Na MRI challenging. We present a method to improve the quantitative accuracy of tissue sodium concentration (TSC) measurements by correcting for partial volume effects8,9 as well as for cardiac and respiratory motion4,10.Methods
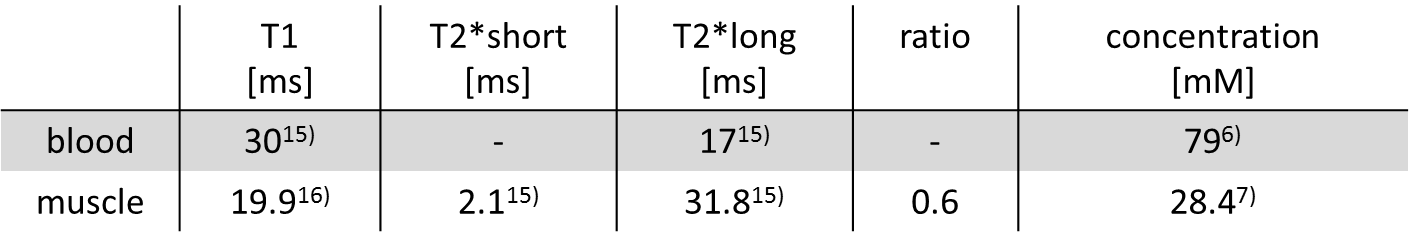
Simulation: The 23Na cardiac model uses manually-generated blood and muscle binary masks based on 0.6x0.6x1.4mm3 1H MRI images. For each mask, k-space data were regridded by a non-uniform Fast Fourier Transform (nuFFT)11 to a radial acquisition trajectory. After scaling the data to the approximate sodium concentration of myocardium and blood (c.f. Table 1) and considering T1 weighting and transverse signal decay with corresponding relaxation times from literature (c.f. Table 1), the separate k-spaces were summed and Gaussian noise was added12.
Measurement: In vivo data (healthy volunteer, female, 26y/o) was acquired on a 7T whole-body system (MAGNETOM 7T, Siemens Healthineers, Erlangen, Germany) with an oval-shaped birdcage13 using a density-adapted 3D radial sampling scheme and a golden angle projection distribution14 with the following parameters: TR = 20ms, TE = 0.95ms, flip angle 61°, nominal spatial resolution (6mm)3 and readout duration 5ms. Cardiac activity was recorded simultaneously with an acoustic gating device (easyACT, MRI Tools GmbH, Berlin, Germany).
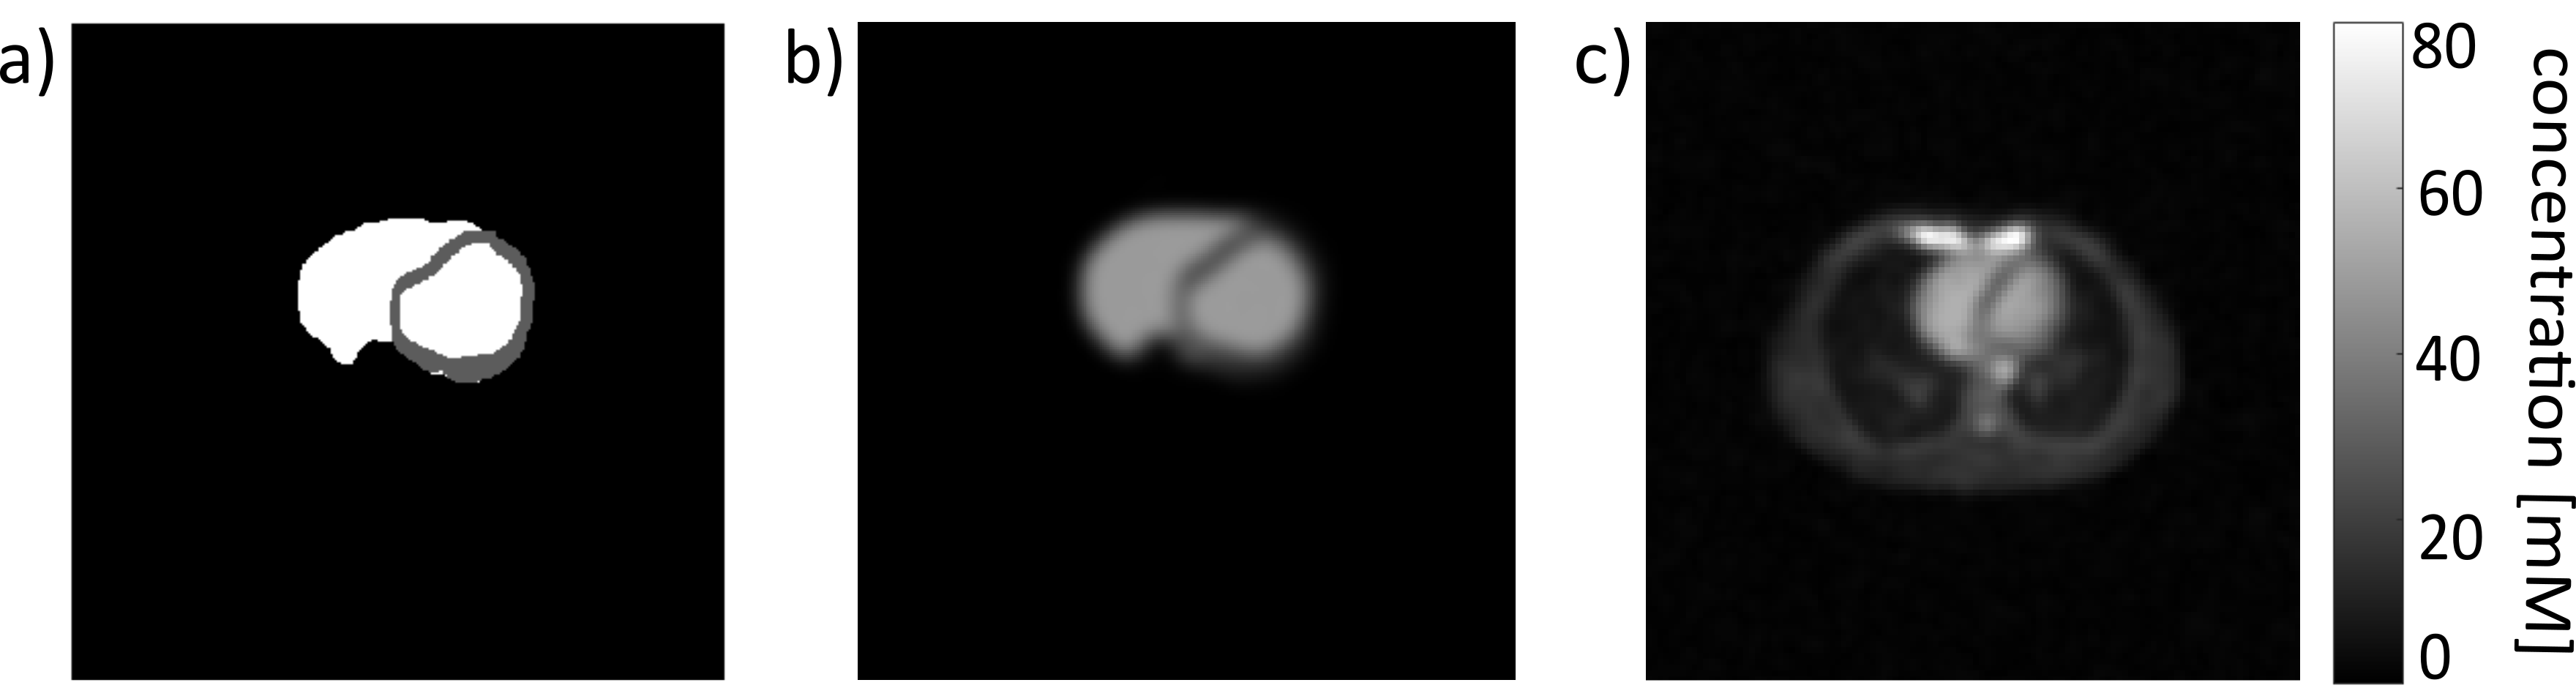
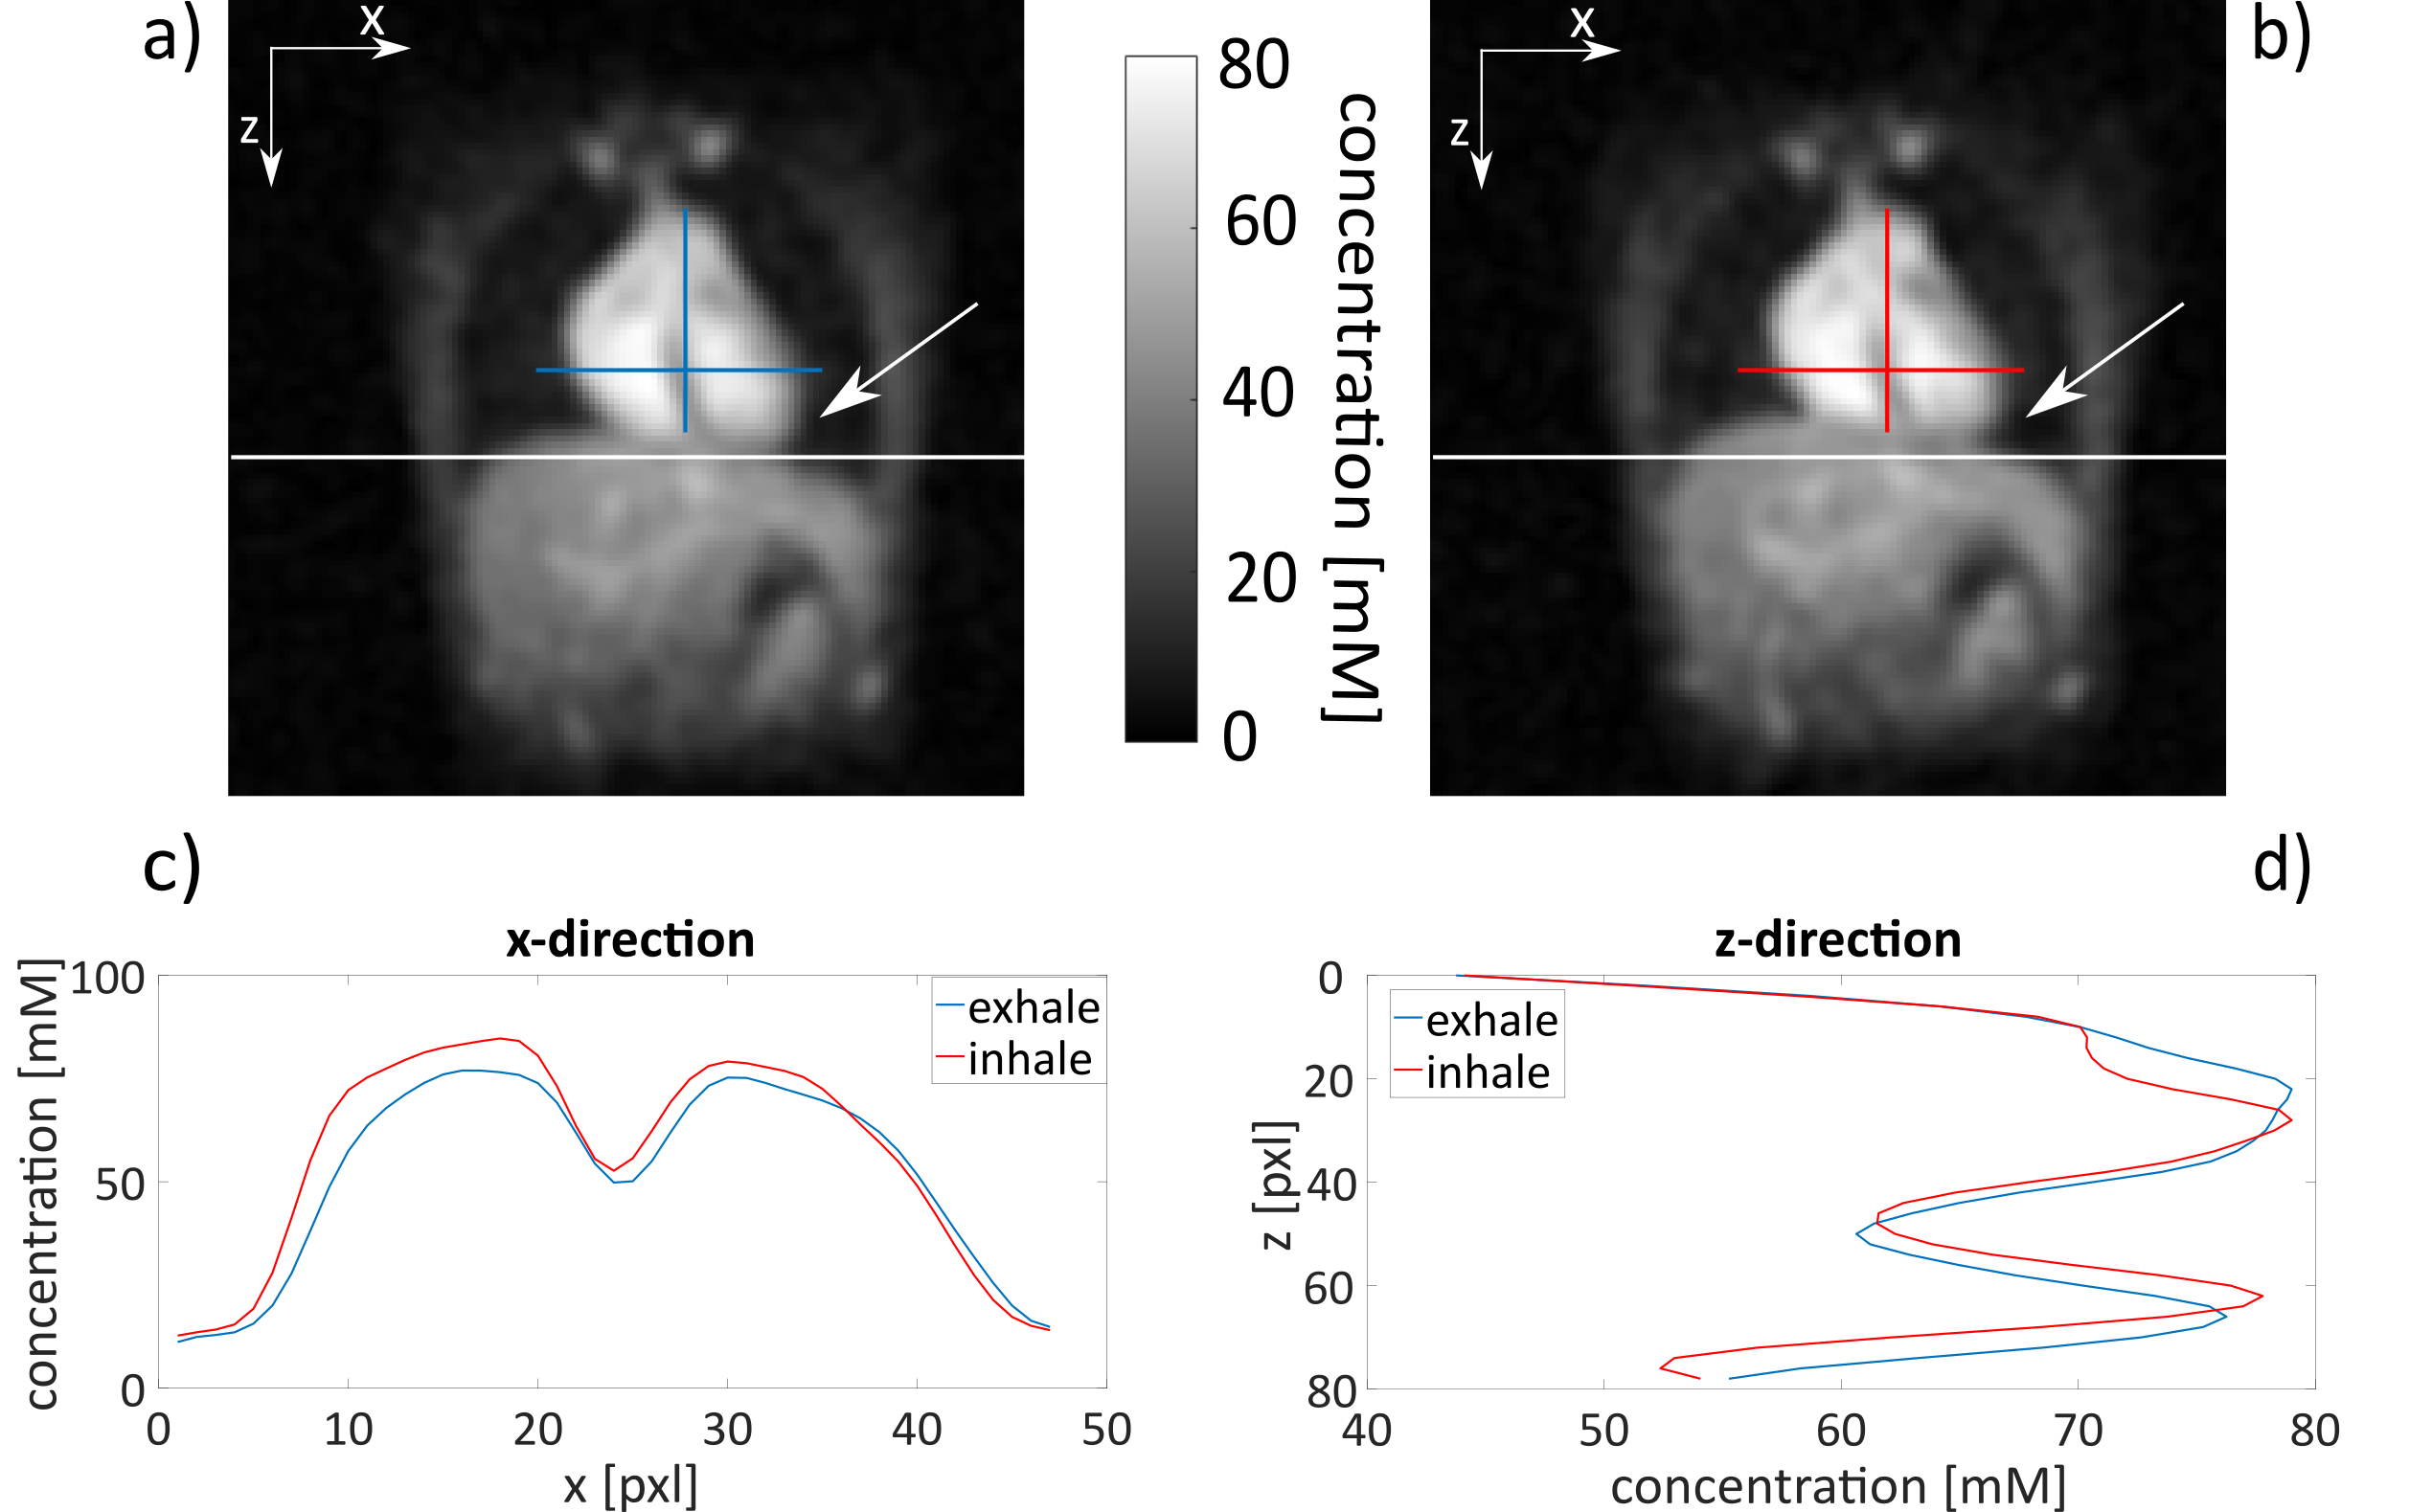
Each data set was reconstructed with a nuFFT using zero-filling with a filling factor of two. A Hamming filter was applied to reduce Gibbs ringing artifacts and to improve SNR (c.f. Figure 1). Reconstructed images were normalized to the mean blood value (79mM6). The original masks from 1H MRI were registered to simulated and measured 23Na images (Matlab R2016b, MathWorks, Natrick, United States) where tissue sodium concentration within these masks was determined. As the 1H MRI measurements were acquired during diastole in the exhaled state, projections of the 23Na measurement were reordered to reconstruct the image in the diastole (∆t = 0.4s) by a retrospective cardiac gating method4. At first all respiratory states were reconstructed for this cardiac phase. In a second step, the influence of respiratory motion was reduced by a self-gated 23Na MRI with separate reconstruction of two respiratory states10 (c.f. Figure 2).
To reduce the bias caused by the high blood signal, a mask-based partial volume correction (PVC) containing a geometric transfer method was applied8,9.
Results
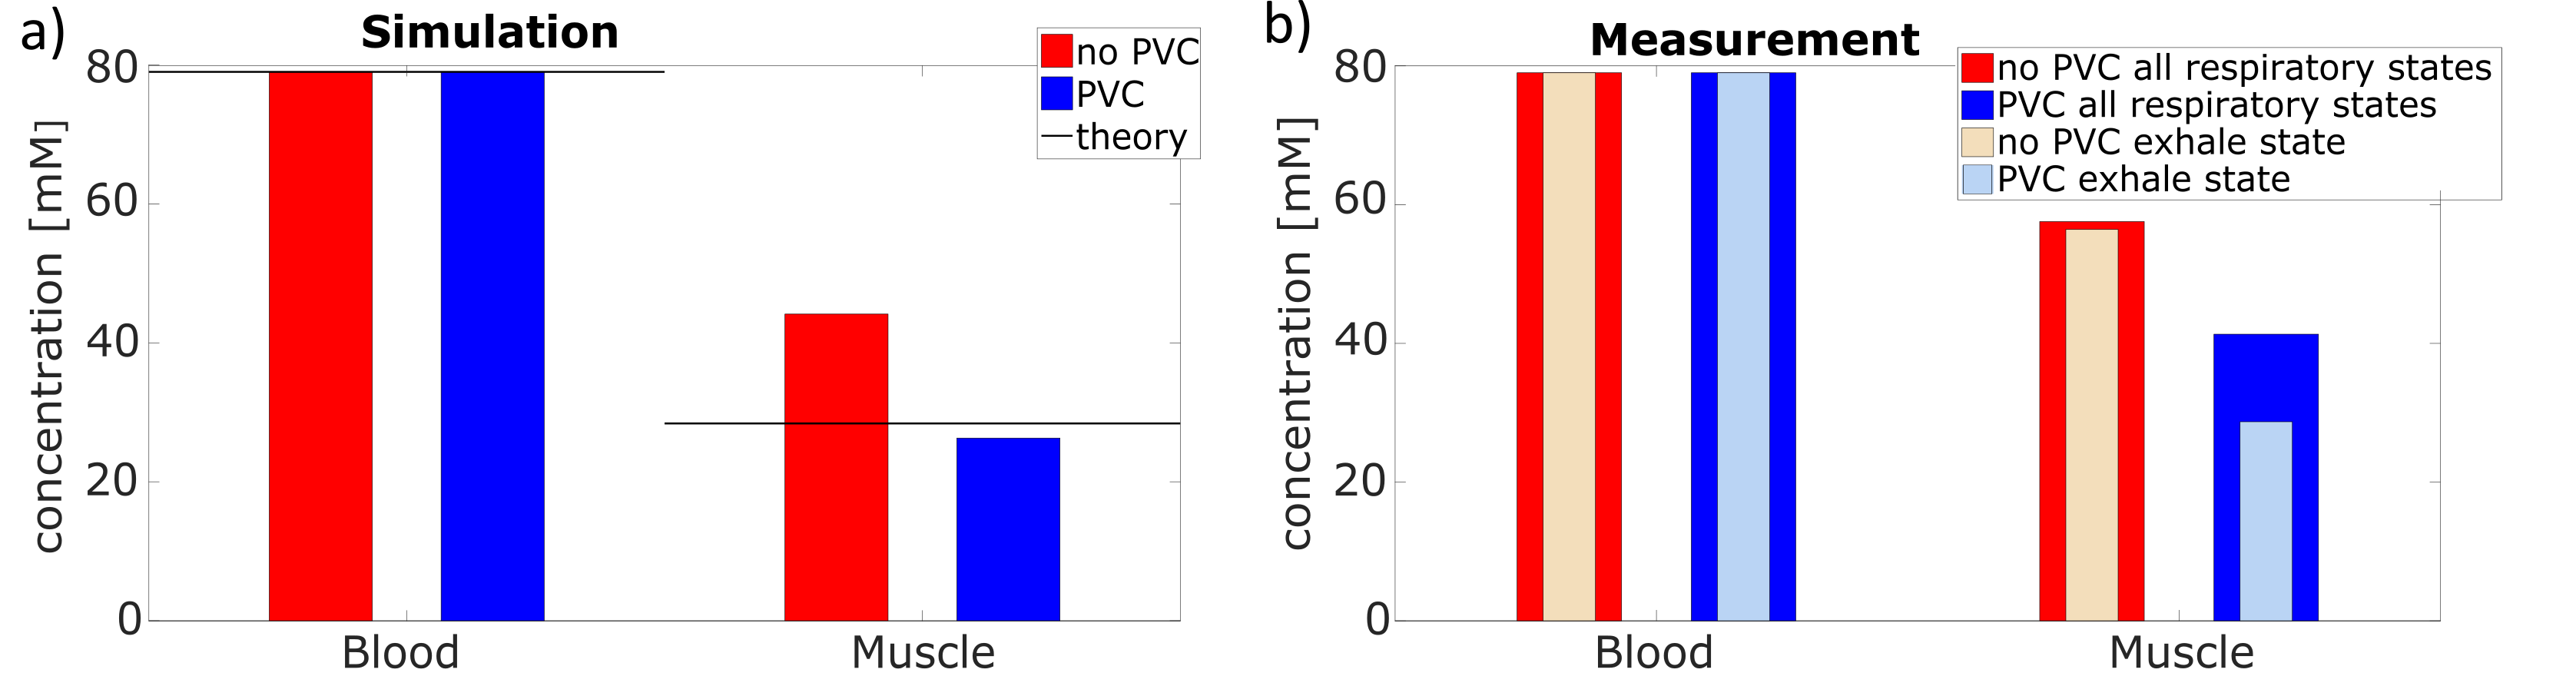
Simulation: Motion blurring and partial volume effects result in an overestimation of the measured concentration in muscle tissue. Partial volume correction reduces this bias (c.f. Figure 3). The sodium concentration within the myocardium decreases by 40.9%, so that theoretical values are achieved within 7.4% (without PVC 55.4%).
Measurement: In vivo data behave similar compared to simulation (c.f. Figure 3). The PVC reduces the measured myocardial sodium concentration. Correction of partial volume effects and retrospective cardiac gating without correction for breathing motion leads to a decrease of the measured myocardial sodium concentration by 28.2%. The separation into two respiratory states and the use of the corresponding mask yield further reductions of the measured myocardial sodium concentration (total reduction of 49.1%, c.f. Figure 3b).
Discussion and Conclusion
The presented method for the determination of the myocardial sodium concentration has been verified with a simulation tool for 23Na MRI cardiac data. Partial volume correction and the correction of cardiac and breathing motion reduce the overestimation of the measured myocardial sodium concentration that is caused by signal contamination from blood.
The results of the in vivo measurements also indicate that partial volume correction and retrospective cardiac and respiratory gating decrease the bias in the measured myocardial sodium concentration that is caused by the neighboring blood compartment. In future, simultaneously acquired 1H images could improve the image registration process and further decrease the contamination of blood signal. In addition, the correction of additional image artifacts due to B0 and B1 inhomogeneity might further improve the quantitative accuracy of cardiac 23Na MRI.
This work demonstrates that both, an appropriate correction of partial volume effects and a correction of motion effects, which include cardiac as well as respiratory motion, are essential for quantitative cardiac 23Na MRI.
Acknowledgements
This work was supported by iMed – the Helmholtz Initiative on Personalized Medicine.References
- Madelin G and Regatte RR et al. Biomedical Applications of Sodium MRI in Vivo. J Magn Reson Imaging. 2013; 38(3): 511-529.
- Sandstede JJ et al. Time Course of 23Na Signal Intensity after Myocardial Infarction in Humans. Magn Reson Med 2004; 52: 545-51.
- Constantinides CD et al. Noninvasive Quantification of Total Sodium Concentrations in Acute Reperfused Myocardial Infarction Using 23Na MRI. Magn Reson Med. 2001; 46: 1144-1151.
- Resetar et al. Retrospectively-gated CINE 23Na imaging of the heart at 7.0 Tesla using density-adapted 3D projection reconstruction. Magn Reson Imaging 2015; 33(9): 1091-1097.
- Jerecic R et al. 23Na-MRI of the human heart using a 3D radial projection technique. Biomedical Engineering 2002; 47(s1a): 458-459.
- Ouwerkerk R et al. Measuring Human Cardiac Tissue Sodium Concentrations Using Surface Coils, Adiabatic Excitation, and Twisted Projection Imaging With Minimal T2 Losses. J Magn Reson Imaging. 2005; 21:546-555.
- Constantinides CD et al. Human Skeletal Muscle: Sodium MR Imaging and Quantification- Potential Applications in Exercise and Disease. Radiology. 2000; 216:559-568.
- Niesporek SC et al. Partial volume correction for in vivo 23Na-MRI data of the human brain. NeuroImage. 2015; 112:353-363.
- Rousset OG et al. Correction for partial volume effects in PET: principle and validation. J Nucl Med. 1998; 39(5): 904-911.
- Platt T et al. Self-gated 23Na-MRI of human lung with separate reconstruction of two respiratory states at 7T. ISMRM.2017; 0486.
- Fessler JA and Sutton BP et al. Fast, iterative image reconstruction for MRI in the presence of field inhomogeneities. IEEE transactions on on Signal Processing 2003; 51(2): 560-574.
- Lommen JM et al. Realistic simulation of 23Na brain data: Understanding the influence of acquisition parameters on the accuracy of 23Na concentration measurement. ISMRM. 2017; 5628.
- Platt T et al. Elliptically-shaped 1Tx4Rx Coil for 23Na Body MRI at 7T. ISMRM 2017; 2958.
- Chan, Rachel W et al. Temporal stability of adaptive 3D radial MRI using multidimensional golden means. J Magn Reson Med. 2009; 61(2): 354-363.
- Bottomly P Sodium MRI in human heart: a review. NMR in Biomedicine. 2016; 29(2):187-196.
- Konstandin S et al. Two-Dimensional Radial Sodium Heart MRI Using Variable-Rate Selective Excitation and Retrospective Elecrocardiogram Gating with Golden Angle Increments. Magn Reson Imaging. 2013; 70:791-799.
Figures