3869
Effect of B0 and B1 Field Inhomogeneity Correction on Region-of-Interest Analysis on 3T Sodium 23Na-MRI1Department of Medicine and Radiology, University of Melbourne, Royal Melbourne Hospital, Parkville, Australia, 2Department of Medical Radiation and Nuclear Medicine, Karolinska University Hospital, Stockholm, Sweden
Synopsis
Evaluation of the effect of B0 and B1 correction on region-of-interest (ROI) analysis in forty-one 3T brain 23Na-MRI scans shows average change from B0, B1 and B0B1 correction of 1.0% (p=0.05), -3.7% (p<0.001) and -4.7% (p<0.001) respectively. Effect is more for B1 than B0 correction, and depending on the anticipated effect size of the neurologic disease of interest, B0 +/- B1 correction may not be required, potentially reducing scan time by 66% and thus encourage quantitative 23Na-MRI research in a clinical environment.
INTRODUCTION
Quantitative sodium 23Na-MRI has potential applications in Alzheimer’s disease, Huntington’s disease, multiple sclerosis, brain tumour, and stroke1-5, but accurate quantitation conventionally includes B0 and B1 field inhomogeneity correction, which can triple acquisition time6. This increased scan time, particularly when added to the scan time of clinical proton 1H-MRI, can be difficult for patients with these diseases to tolerate, and when performed on high throughput clinical MR scanners, is another factor prohibiting translation of quantitative 23Na-MRI towards wider clinical application.
We aim to evaluate the magnitude of B0 and B1 correction on sodium signal intensities (SI) in different brain regions (ROI) from a 3T clinical scanner using a commercially available dual-tuned 1H/23Na birdcage head coil.
METHODS
23Na-MRI scans were obtained (n=41,M=14,F=27, age=75.8±5.8 years) on a 3T Trio scanner (Siemens, Erlangen, Germany) using a 1H/23Na quadrature transmit/receive head coil tuned at 123.2 and 32.6 MHz (Model V-XQ-HQ-303, Rapid Biomedical, Rimpar, Germany). Proton T1-MPRAGE scans were acquired with TR=1900ms, TE=2.13ms, FA=9 degrees, NEX=1, TA=5:40 minutes at 1mm isotropic resolution. After shimming on 23Na FID, 23Na-MRI was performed using the flexible twisted projection imaging (FlexTPI) sequence6 with TR=160ms,TE=0.3ms,FA=90 degrees, readout time 12ms, NEX=2,TA=8 minutes at nominal 5mm isotropic resolution. For B0 correction using the frequency-segmented conjugate phase reconstruction method7, the above FlexTPI sequence was repeated, but with TE=2.6ms. For B1 correction using the double flip angle method8, the FlexTPI sequence was again performed with TE=0.3ms but FA=45 degrees.
Data processing: (i) Custom built automated software pipeline9 (Matlab, Natick, MA, USA) was used to generate B0, B1 maps and sodium images of the whole brain, without correction (uncorrected), with B0 correction only (B0 corrected), and with B0 and B1 correction (B0B1 corrected) (ii) 1H-MPRAGE images were segmented using FSL v5.0 and co-registered with sodium images to improve the skull-strip. (iii) Uncorrected, B0 corrected and B0B1 corrected sodium images of each subject were registered into MNI space using the JHU-T2w-MNI template. (iii) Harvard-Oxford cortical and subcortical atlases10-13 were used for ROI parcellation to extract average SI and its standard deviation(SD).
The uncorrected, B0 corrected and B0B1 corrected 23Na-SI of each region were compared. SI change for B0, B1 and combined B0B1 correction effect were assessed by (B0-uncorrected)/uncorrected, (B0B1-B0)/B0 and (B0B1-uncorrected)/uncorrected) respectively.
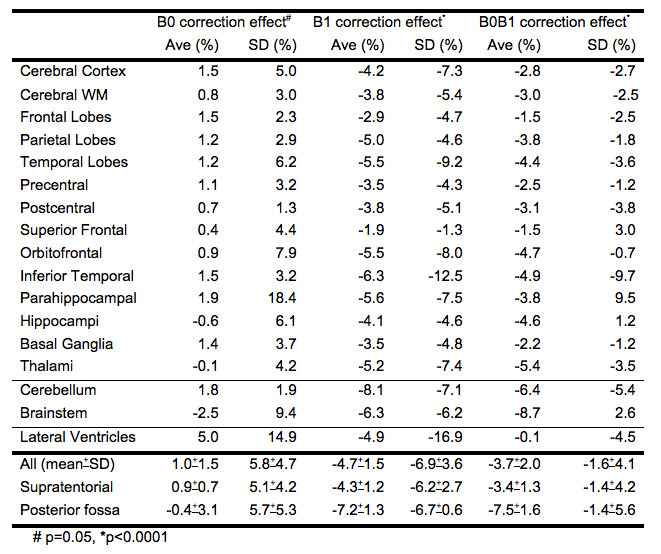
Table1 lists the ROIs analyzed. Descriptive statistics performed on Excel. 2 tailed paired t-test performed with significance defined as p<0.05.
RESULTS
Table1 shows the SI changes of various regions. Average change from B0, B1 and B0B1 correction 1.0%(p=0.05), -3.7% (p<0.001) and -4.7% (p<0.001) respectively.
B0 correction: Most affects lateral ventricles (5%). Structures near bone interfaces including hippocampi, parahippocampal, fronto-orbital and inferior temporal gyri are minimally changed (0.4-1.9%). Structures furthest from isocentre are also minimally changed (1.8-2.6%). SD for all ROIs increased with B0 correction (1.3-18%), most at the parahippocampal gyri.
B1 correction: Most affects cerebellum (-8.2%) and brainstem (-6.3%), and least in structures near the vertex (-1.9% superior frontal gyrus). SD for all ROIs decreased.
B0B1 correction: Most affects cerebellum(-6.4%) and brainstem(-8.7%), and least in structures near the vertex (-1.5% superior frontal gyrus). SD for most ROIs decreased.
DISCUSSION
Overall, SI change from the corrections are not large (<5%), B1>B0 correction.
SI change from B0 correction is <2% for almost all ROIs, except for lateral ventricles and brainstem. As a typical B0 map shows a -70Hz maximum frequency shift, at nominal 5mm voxel size at 3T and a pixel bandwidth of 2000Hz, the findings are consistent. The lateral ventricles may be most affected because of long boundaries with CSF. The effect on the brainstem is also expected, with B0 inhomogeneity increasing away from isocentre. The magnitude of effect suggests B0 correction may not be needed for quantitative ROI analysis of supratentorial brain structures.
SI change from B1 correction is <10% for all ROIs; all supratentorial ROIs except for parahippocampal gyri are <6%. The slightly larger changes in the brainstem and cerebellum are not unexpected, being near the edge of the coil. Depending on the effect size anticipated and the ROI for the disease of interest (ie. SI increase 37% caudate in Huntington’s disease2, 32% and 23% in normal appearing white and grey matter respectively in MS3, and 8% hippocampi in mild cognitive impairment1), B1 correction may also not be needed.
CONCLUSION
B0 correction may not be necessary for quantitative ROI analysis on 3T 23Na-MRI, and B1 correction may also not be necessary depending on the ROI of interest and the anticipated effect size of the pathology of interest.
An up to 66% reduction in scan time would help encourage translation of 23Na-MRI research to clinical patients in clinical environments.
Acknowledgements
No acknowledgement found.References
1. Mellon EA, Pilkinton DT, Clark CM, Elliott MA, Witschey WR 2nd, Borthakur A, et al. Sodium MR imaging detection of mild Alzheimer disease: preliminary study --3T. AJNR Am J Neuroradiol. 2009;30: 978–984.
2. Reetz K, Romanzetti S, Dogan I, Saß C, Werner CJ. Increased brain tissue sodium concentration in Huntington’s Disease—A sodium imaging study at 4T. Neuroimage. 2012; 63: 517-524.
3. Inglese M, Madelin G, Oesingmann N, Babb JS, Wu W, Stoeckel B, et al. Brain tissue sodium concentration in multiple sclerosis: a sodium imaging study at 3 tesla. Brain. 2010;133: 847–857.
4. Biller A, Badde S, Nagel A, Neumann J-O, Wick W, Hertenstein A, et al. Improved Brain Tumor Classification by Sodium MR Imaging: Prediction of IDH Mutation Status and Tumor Progression. AJNR Am J Neuroradiol. 2016;37: 66–73.
5. Thulborn KR, Gindin TS, Davis D, Erb P. Comprehensive MR imaging protocol for stroke management: tissue sodium concentration as a measure of tissue viability in nonhuman primate studies and in clinical studies. Radiology. 1999;213: 156–166.
6. Lu A, Atkinson IC, Claiborne TC, Damen FC, Thulborn KR. Quantitative sodium imaging with a flexible twisted projection pulse sequence. Magn Reson Med. 2010;63: 1583–1593.
7. Noll DC, Pauly JM, Meyer CH, Nishimura DG, Macovski A. Deblurring for non-2D Fourier transform magnetic resonance imaging. Magn Reson Med. 1992;25: 319–333.
8. Insko EK, Bolinger L. Mapping of the Radiofrequency Field. J Magn Reson A. 1993;103: 82–85.
9. Thulborn K, Lui E, Guntin J, Jamil S, Sun Z, Claiborne TC, et al. Quantitative sodium MRI of the human brain at 9.4 T provides assessment of tissue sodium concentration and cell volume fraction during normal aging. NMR Biomed. 2016;29: 137–143.
10. Makris N, Goldstein JM, Kennedy D, Hodge SM, Caviness VS, Faraone SV, Tsuang MT, Seidman LJ. Decreased volume of left and total anterior insular lobule in schizophrenia. Schizophr Res. 2006 Apr;83(2-3):155-71
11. Frazier JA, Chiu S, Breeze JL, Makris N, Lange N, Kennedy DN, Herbert MR, Bent EK, Koneru VK, Dieterich ME, Hodge SM, Rauch SL, Grant PE, Cohen BM, Seidman LJ, Caviness VS, Biederman J. Structural brain magnetic resonance imaging of limbic and thalamic volumes in pediatric bipolar disorder. Am J Psychiatry. 2005 Jul;162(7):1256-65
12. Desikan RS, Ségonne F, Fischl B, Quinn BT, Dickerson BC, Blacker D, Buckner RL, Dale AM, Maguire RP, Hyman BT, Albert MS, Killiany RJ. An automated labeling system for subdividing the human cerebral cortex on MRI scans into gyral based regions of interest. Neuroimage. 2006 Jul 1;31(3):968-80.
13. Goldstein JM, Seidman LJ, Makris N, Ahern T, O'Brien LM, Caviness VS Jr, Kennedy DN, Faraone SV, Tsuang MT. Hypothalamic abnormalities in schizophrenia: sex effects and genetic vulnerability. Biol Psychiatry. 2007 Apr 15;61(8):935-45
Figures