3866
Simultaneously Acquired Single- and Triple-Quantum Spectroscopic Imaging with Density-Adapted Projection Reconstruction and Time Proportional Phase Increment1Computer Assisted Clinical Medicine, Heidelberg University, Mannheim, Germany
Synopsis
Multi-quantum filtered spectroscopic imaging methods utilize the spin-3/2 characteristic of 23Na nuclei to generate multi-quantum coherences reflecting on the binding of 23Na+ to macromolecules. In this work, a spectroscopic density-adapted radial imaging modality was developed to simultaneously acquire single-quantum and triple-quantum signal under identical condition using time proportional phase increments. In vivo rat head images with 1 mm resolution were acquired in under an hour. This method may be applied to monitor the single-quantum and triple-quantum signal development in diseases such as stroke and cancer and lead to a deeper understanding of metabolic processes in healthy and diseased tissue.
Purpose
Multi-quantum filtered spectroscopic imaging methods are in the focus of interest for 23Na NMR [1,2]. Such methods utilize the spin-3/2 characteristic of 23Na nuclei to produce multi-quantum coherences reflecting on the binding of 23Na+ to macromolecules dependent on molecular environments and metabolic processes.
Conventional triple-quantum filtered sequences are restrained by low triple-quantum (TQ) signal due to filtration of the single-quantum (SQ) coherence. A method to concurrently acquire SQ and TQ signal and without SQ filtration uses time proportional phase increments (TPPI) [3,4].
The aim of this work was to establish a spectroscopic imaging method with which disease development could be tracked in future work based on the TQ/SQ progression with reasonable time and spatial resolution, leading to a deeper understanding of metabolic processes in healthy and diseased tissue.
For this purpose, the DA-PR-TPPI sequence was developed by combining TPPI pulse train and in density-adapted projection reconstruction (DA-PR) imaging [5]. This sequence allows for straightforward switching between standard imaging (DA-PR) and spectroscopic imaging (DA-PR-TPPI) operation mode and was optimized to acquire spectroscopic imaging data in rat head.
Materials and Methods
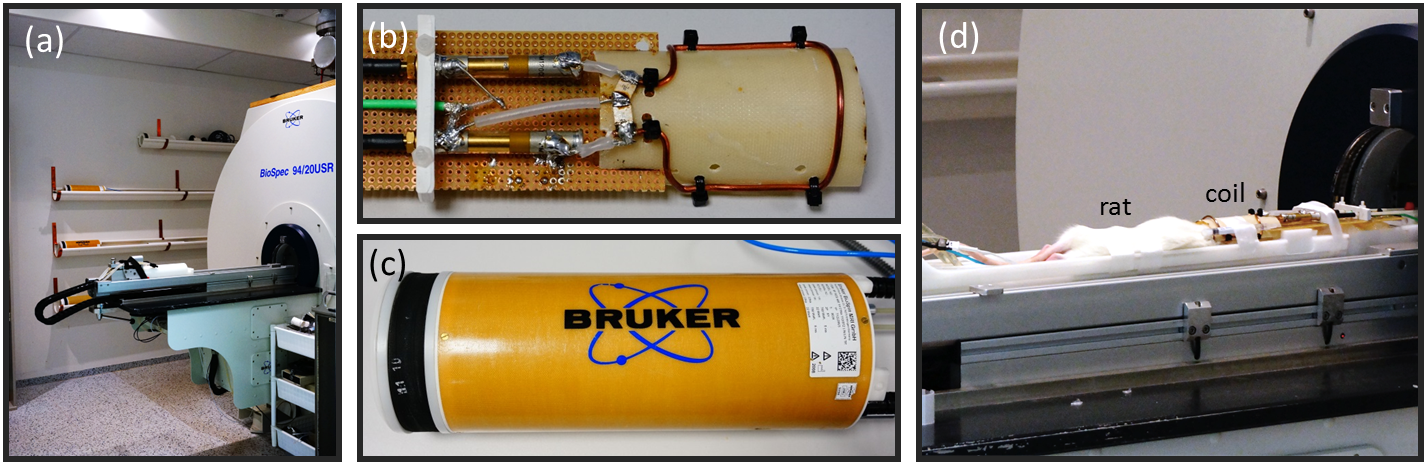
Experiments were performed on a 9.4 T preclinical MR system (BioSpec, Bruker, Germany) using a Bruker 1H/23Na volume coil for phantom experiments and a custom-made 23Na saddle surface coil for animal experiments (Fig.1). Three 50 ml vials with 134.75 mM NaCl solution and 2/4/6% agarose were used. For in vivo experiments a healthy Sprague Dawley rat was scanned.
Pseudo 2D readout:
Pseudo 2D gradient readout (infinitely thick slice) was chosen over 3D readout to achieve high spatial resolution while greatly reducing tscan. Furthermore, pseudo 2D was preferred over normal 2D readout, since a slice selection gradient simultaneous to pulse application leads to longer TE and possibly coherence loss.
DA-2DPR(-TPPI) experiments:
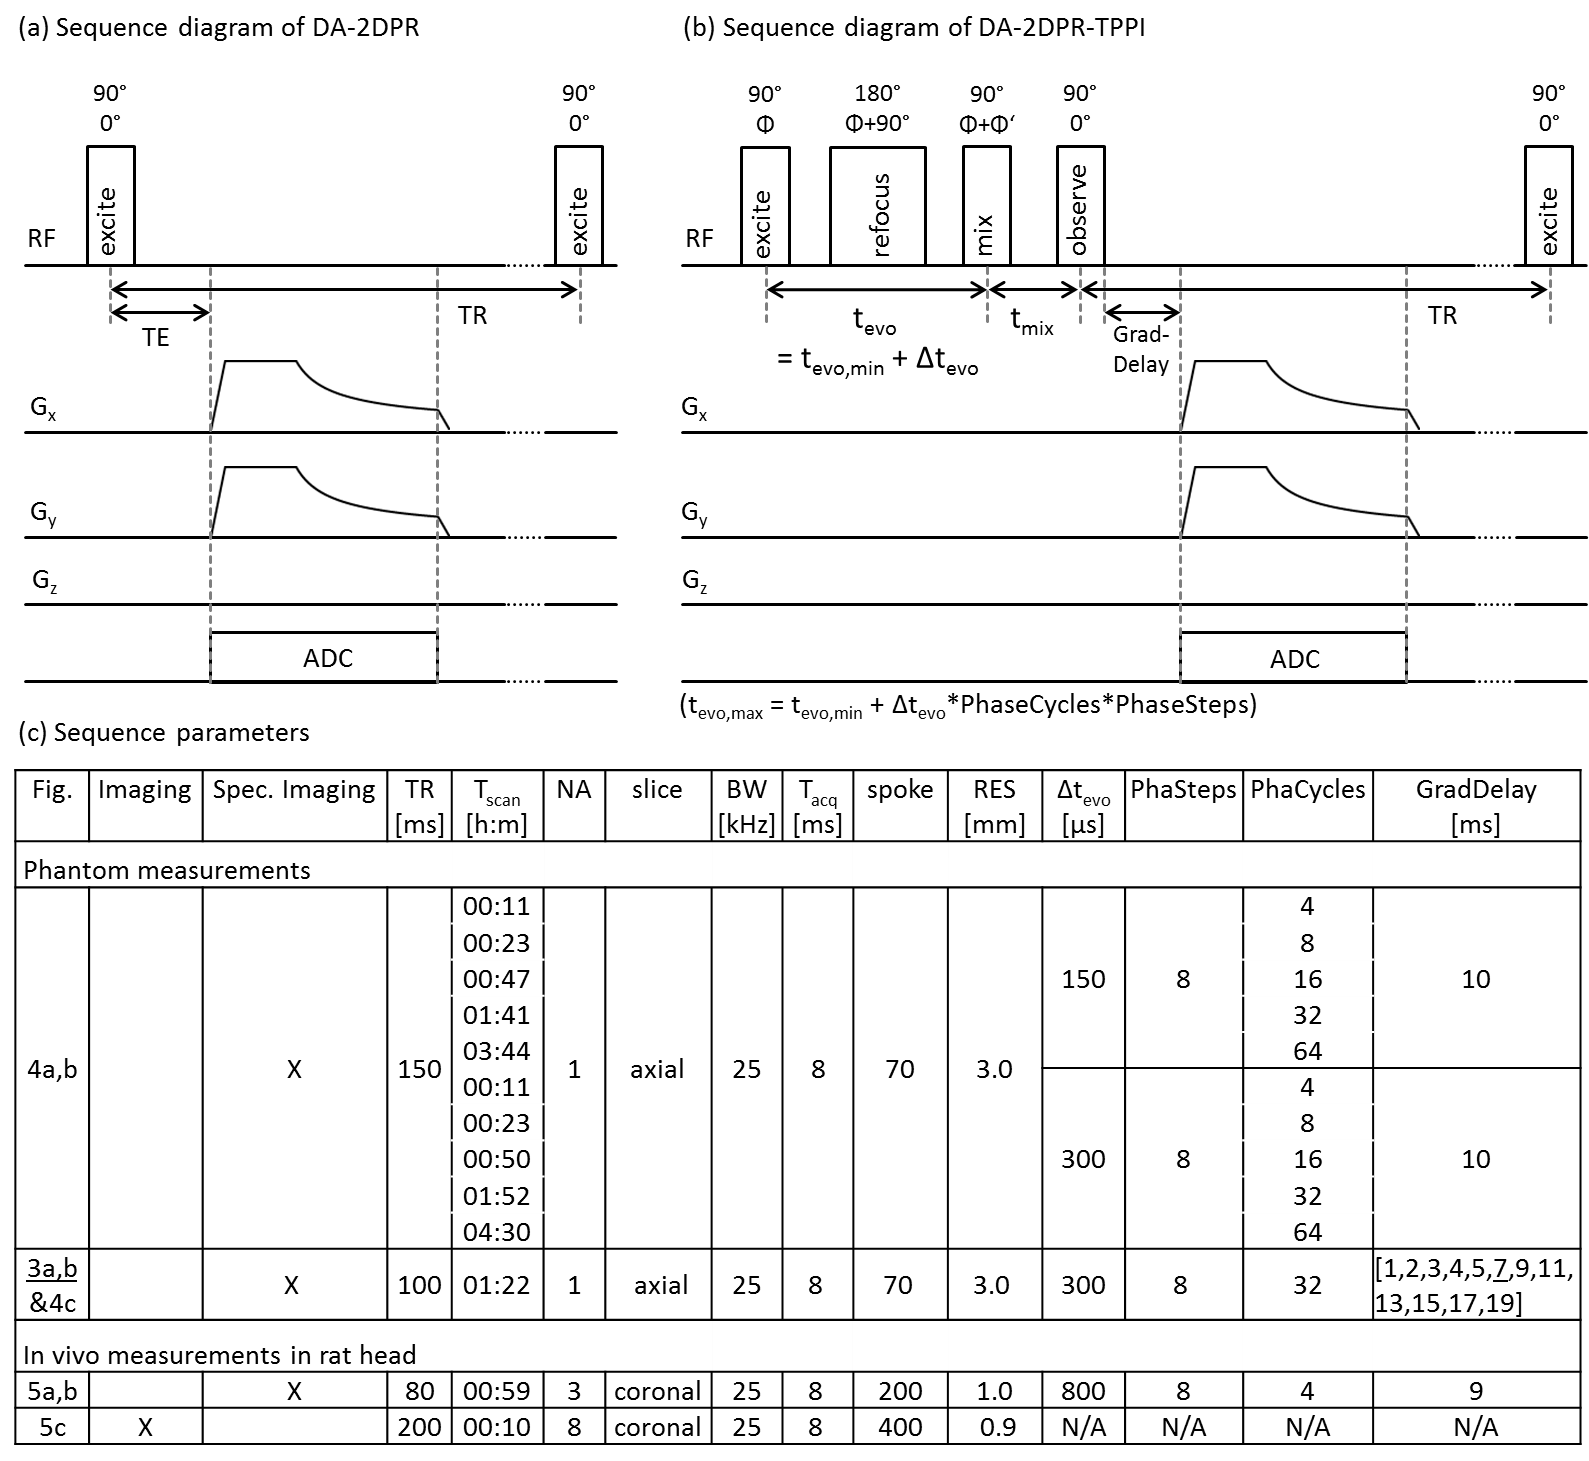
DA-2DPR and DA-2DPR-TPPI pulse schemes as well as sequence parameters are depicted in Fig.2. SQ and TQ images were obtained by performing Fourier Transform along the SQ and TQ frequency of the spectrum, respectively.
- To overcome low signal, tscan has to be spent on either averaging t-FID in t-domain or finer sampling of tevo-FID in tevo-domain. The latter is realized by shorter Δtevo and more PhaseCycles. Combinations of Δtevo and PhaseCycles were tested in phantoms.
- An optimal GradDelay to achieve overall high triple-quantum signal (TQS) while maintaining high TQS contrast among phantoms was determined.
- Based on findings from 1.&2., DA-2DPR-TPPI SQ and TQ 23Na spectroscopic images of rat head were acquired additional to a DA-2DPR 23Na image and 1H reference images.
Results and Discussion
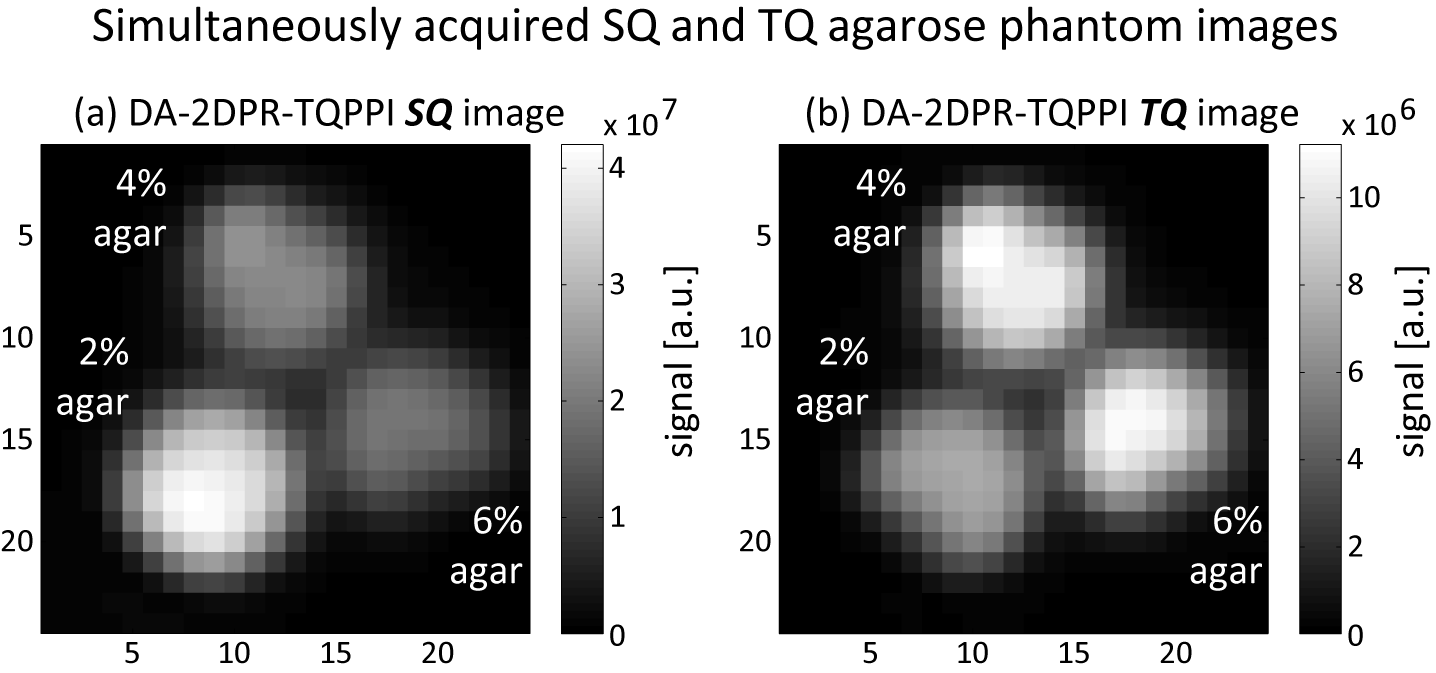
Exemplary DA-2DPR-TPPI SQ and TQ phantom images (Fig.3) confirm that single-quantum signal (SQS) decreases and that TQS increases with increasing agarose concentration.
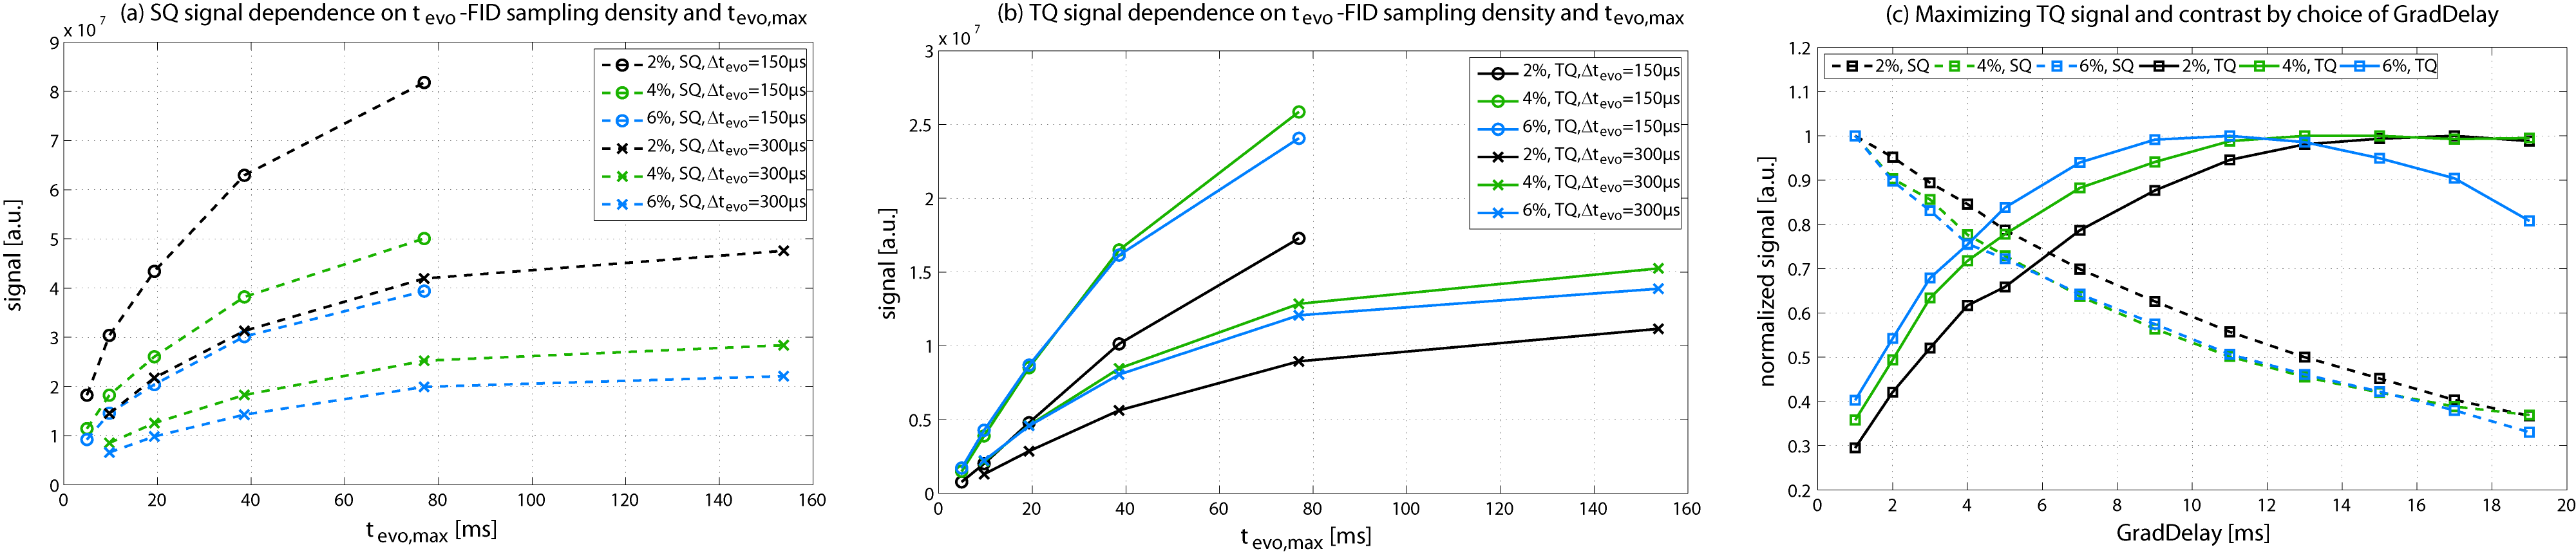
SQS (Fig.4a) and TQS (Fig.4b) in phantoms using different Δtevo and PhaseCycles combinations reveal that for the same tevo,max=tevo,min+Δtevo*PhaseCycles*PhaseSteps, a 2-fold increase in sampling fineness (Δtevo/2, PhaseCycles*2 and tscan*2) results in a 2-fold SQS and TQS increase. It implies that signal increase is proportional to tscan. If the noise level of t-FID is low, finer sampling of tevo-FID is favored over averaging of t-FID with a signal efficiency of (tscan)1/2. Furthermore, incomplete sampling of tevo-FID (small tevo,max) leads to signal loss.
For increasing GradDelay (Fig.4c), SQS decreases, and TQS reaches a maximum at a value depending on the agarose concentration. Evaluation yielded an optimal GradDelay of 8-10 ms for tacq = 8 ms.
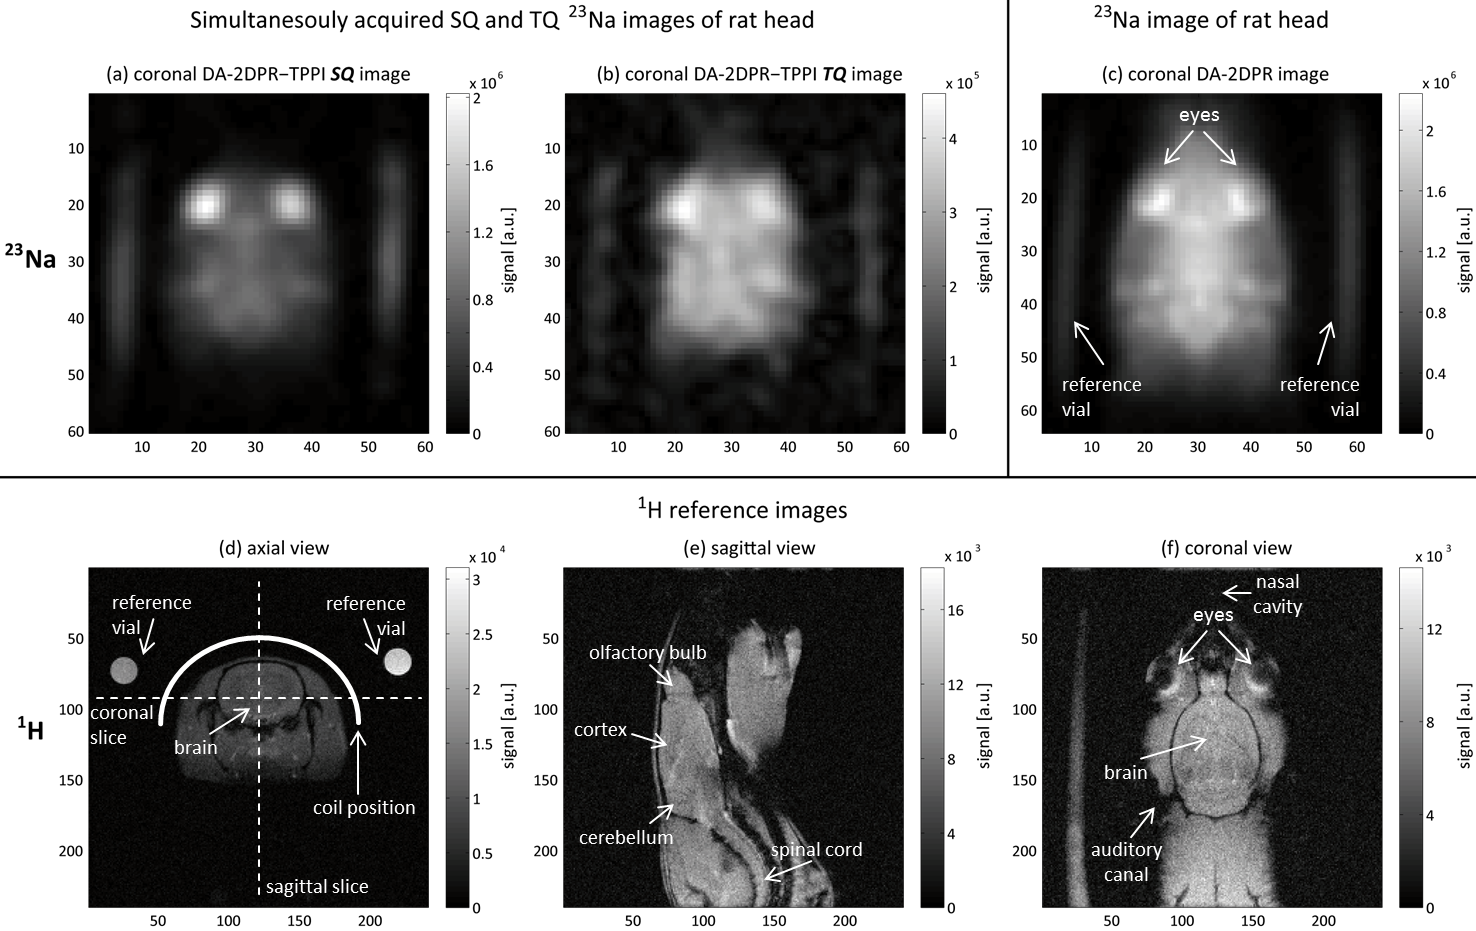
The DA-2DPR-TPPI (Fig.5a,b) SQ image of rat head indicates high signal level in the eyes due to the high amount of free 23Na+; the eyes in the TQ and the DA-2DPR image (Fig.5c) have much less pronounced signal intensity compared with surrounding tissue. In the past, a normal image was sometimes used as a pseudo SQ image. Our results reveal that the true SQ image diviates substantially from the normal image. 1H images (Fig.5d-f) indicate that although jaw tissue signal might be mixed with brain signal in the coronal view, the B1 profile of the saddle coil is much less homogeneous in the region below the brain, thus resulting in difficult SQ/TQ-TPPI coherence formation underneath the brain. The pseudo 2D coronal outline of the brain can thus be approximately attributed to brain tissues only.
Conclusion
A simultaneously acquired SQ and TQ spectroscopic imaging modality with TPPI was successfully applied to phantom and in vivo rat head. In rat head, spatial resolution of 1 mm was achieved within a scan time of under an hour. This reasonable time and spatial resolution might enable future monitoring of SQ/TQ development in diseases such as stroke and cancer and thus lead to a deeper understanding of metabolic processes in healthy and diseased tissue.Acknowledgements
Generous support in animal handling was received from Felix Hörner of Zentralinstitut für Seelische Gesundheit, Mannheim, Germany.References
[1] Tsang et al. Triple-Quantum-Filtered Sodium Imaging of the Human Brain at 4.7 T. MRM. 2012;67:1633-1643
[2] Mirkes et al. Triple-Quantum-Filtered Sodium Imaging at 9.4 Tesla. MRM. 2016;75:1278-1289
[3] Schepkin et al. Comparison of potassium and sodium binding in vivo and in agarose samples using TQTPPI pulse sequence. J Magn Reson. 2017;277:162-168
[4] Neubauer et al. Tracking protein function with sodium multi quantum spectroscopy in a 3D-tissue culture based on microcavity arrays. Sci Rep. 2017;7:3943
[5] Nagel et al. Sodium MRI Using a Density-Adapted 3D Radial Acquisition Technique. MRM. 2009;62(6):1565-1573
Figures