3865
Investigating Bound Sodium Signals using a Novel Chemical Shift Imaging Triple Quantum Technique1Chemical & Biomedical Engineering, Florida State University, Tallahassee, FL, United States, 2Center for Interdisciplinary MR, National High Magnetic Field Laboratory, Tallahassee, FL, United States, 3Physics, Florida State University, Tallahassee, FL, United States, 4Huntington Medical Research Institutes, Pasadena, CA, United States
Synopsis
23Na-based MRI techniques can be used to separate sodium signal originating from the extracellular and intracellular compartments. Triple Quantum (TQ) schemes can select the coherence pathway that evolves in slow moving/restricted regimes, such as in the intracellular compartment. In this study, a novel TQ technique based on a modified chemical shift imaging sequence (CSI-TQ), which yields higher signal-to-noise ratios, is introduced for studies at 21.1 T. The CSI-TQ is compared to a more conventional gradient recalled echo variant (GRE-TQ) with respect to SNR and efficiency.
Introduction
The homeostasis and maintenance of intracellular and extracellular sodium concentrations of 5-15 mM and ~140 mM, respectively, are critical to neural function. Diseases can dynamically alters this gradient, and non-invasive techniques that can assess intracellular sodium concentrations selectively may be important for assessing cellular viability and pathological progression. Quantum filtering techniques separate bound and bulk signals based on quantum coherence selection that targets restrictions in the bound fraction, as opposed to the generally more mobile species dominant in single quantum transition.
In this study at 21.1 T, a novel implementation of Triple Quantum (TQ) selection is introduced based on a modified FID-based chemical shift imaging sequence (CSI-TQ), allowing for quantification of the sodium signal with high signal-to-noise ratios, improved point spread function and minimal TE-related signal losses. The SNR and efficiency the CSI-TQ is compared to a more conventional gradient recalled echo TQ technique (GRE-TQ). TQ techniques are plagued by low sensitivity particularly as the TQ signal is reported to be <10% of the SQ signal, the ultra-high field of 21.1 T was utilized to enhance sensitivity and enable higher spatial and temporal resolution.
Materials and Methods
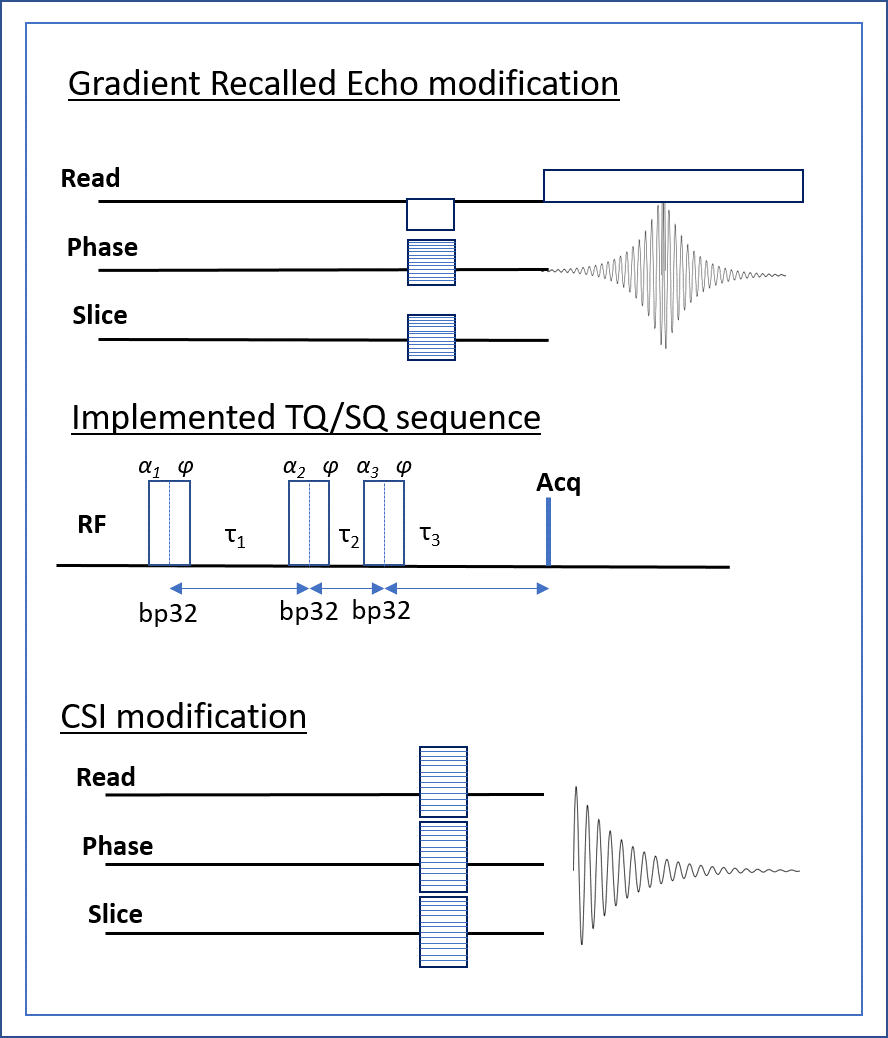
Using the 21.1-T ultra-wide bore magnet at the US National High Magnetic Field Laboratory and a linear 1H/23Na birdcage coil, 3D 23Na images were acquired using the GRE-TQ or CSI-TQ sequences (Figure 1). Following pulse calibration (α=90° corresponded to a 0.185-ms hard pulse at ~100 W), B0 and B1 mapping were performed using two single quantum (SQ) images with either a TE difference (ΔTE=2 ms) or a Double Angle Method (α1=60°, α2=120°).
Phantom and Animal Specimens: The samples consisted of five 10-mm NMR tubes with different biological concentrations of saline ranging from 10-137 mM NaCl in 5% agar and one tube consisting of aqueous saline (137-mM NaCl). Three naïve Sprague-Dawley male rats were used for in vivo analysis. TQ Acquisitions: This study made use of the three-pulse coherence transfer technique (Figure 1a), which incorporated a modified 12 phase cycle scheme for TQ selection and B0 correction [2,3]. Block pulses were used for the three excitation pulses, with flip angles α1,2,3 set to 90° while τ1 was optimized to maximum signal by experimentally incrementing values from 0.5-35 ms over 1 ms intervals for both techniques. For CSI-TQ, the experimental parameters were: τ1=4 ms, τ2=10 ms, τ3=4 ms, acquisition time of 30 ms, an isotropic resolution of (2 mm)3, 2 averages per phase cycle and TR = 105 ms, yielding a total acquisition time for the CSI-TQ scans of 92 min. For the GRE-TQ, the experimental parameters were: τ1=7.5 ms, τ2=10 ms, τ3=7.5 ms, FOV=6.4x6.4x3.2 cm, BW = 130 Hz/pixel, isotropic resolution of (2 mm)3, 2 averages per phase cycle and TR = 105 ms, yielding a total acquisition time for the GRE-TQ scans of 20 min. A SQ dataset was also acquired for both techniques, but with a standard DC offset and quadrature correction phase cycling scheme. The sequence parameters were the same both in the phantom and in vivo.
Data Analysis: CSI-TQ data was acquired as FIDs, whereas GRE-TQ was acquired as a full echo. Both were zero-padded and reconstructed to (1 mm)3 complex matrices; no other filtering or noise thresholding were performed. Intracellular/bound sodium concentration (ISC) maps were generated [1]. Techniques were compared by the efficiency factor, ε, $$ε=SNR/√(Acquisition time)$$
Results
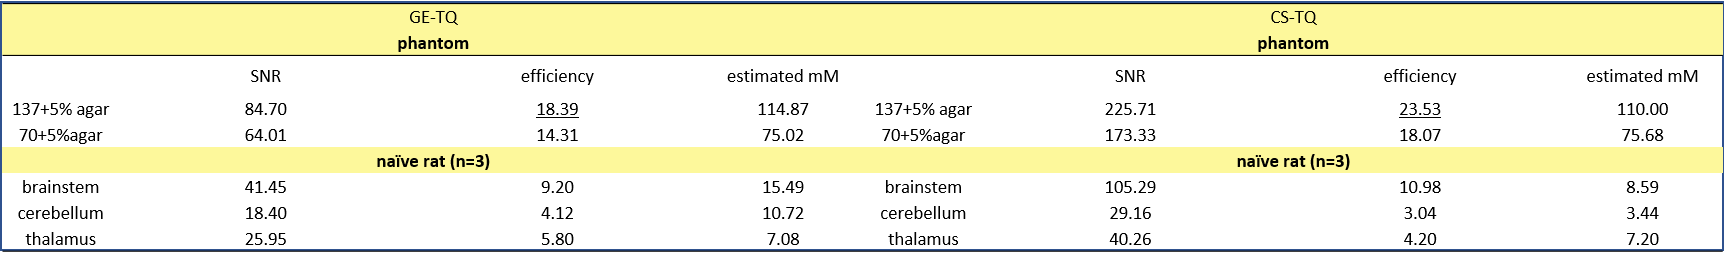
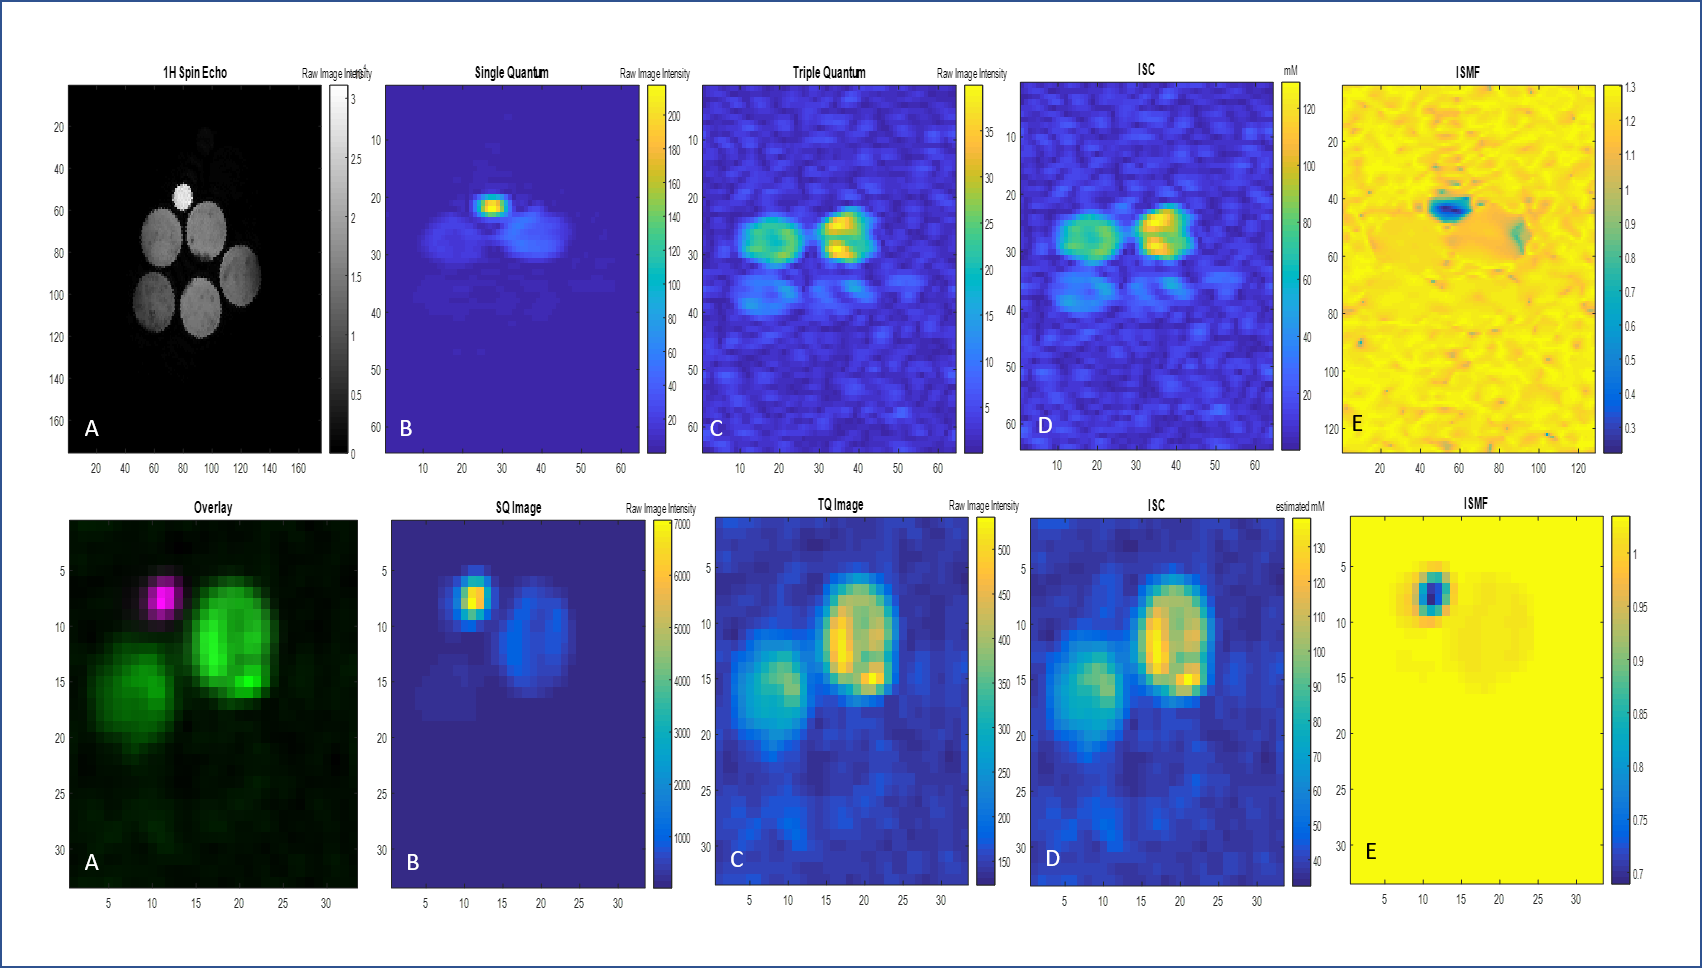
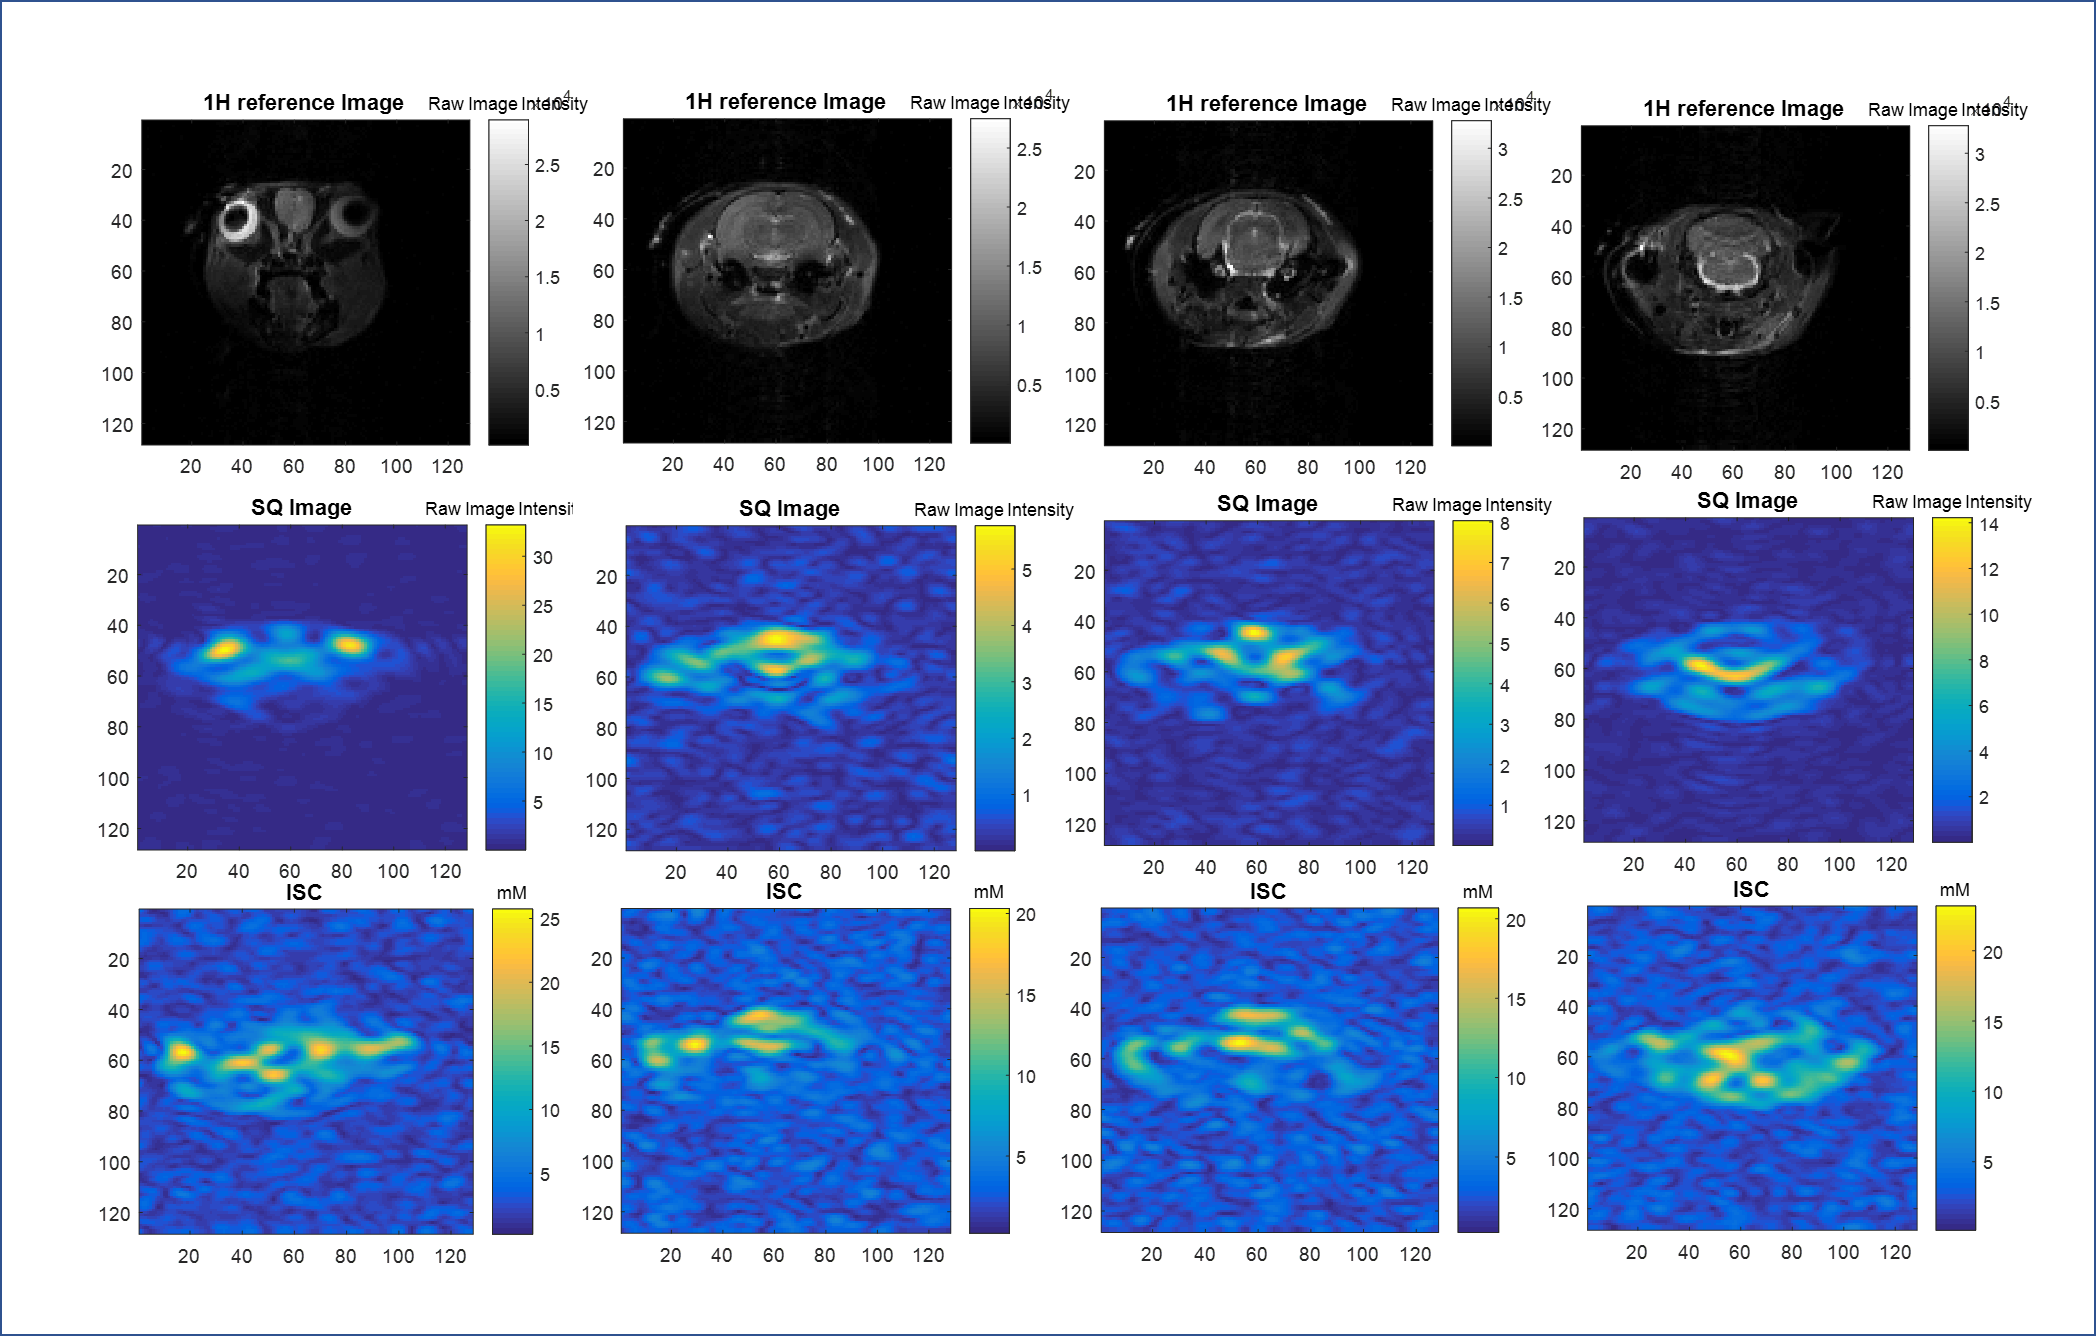
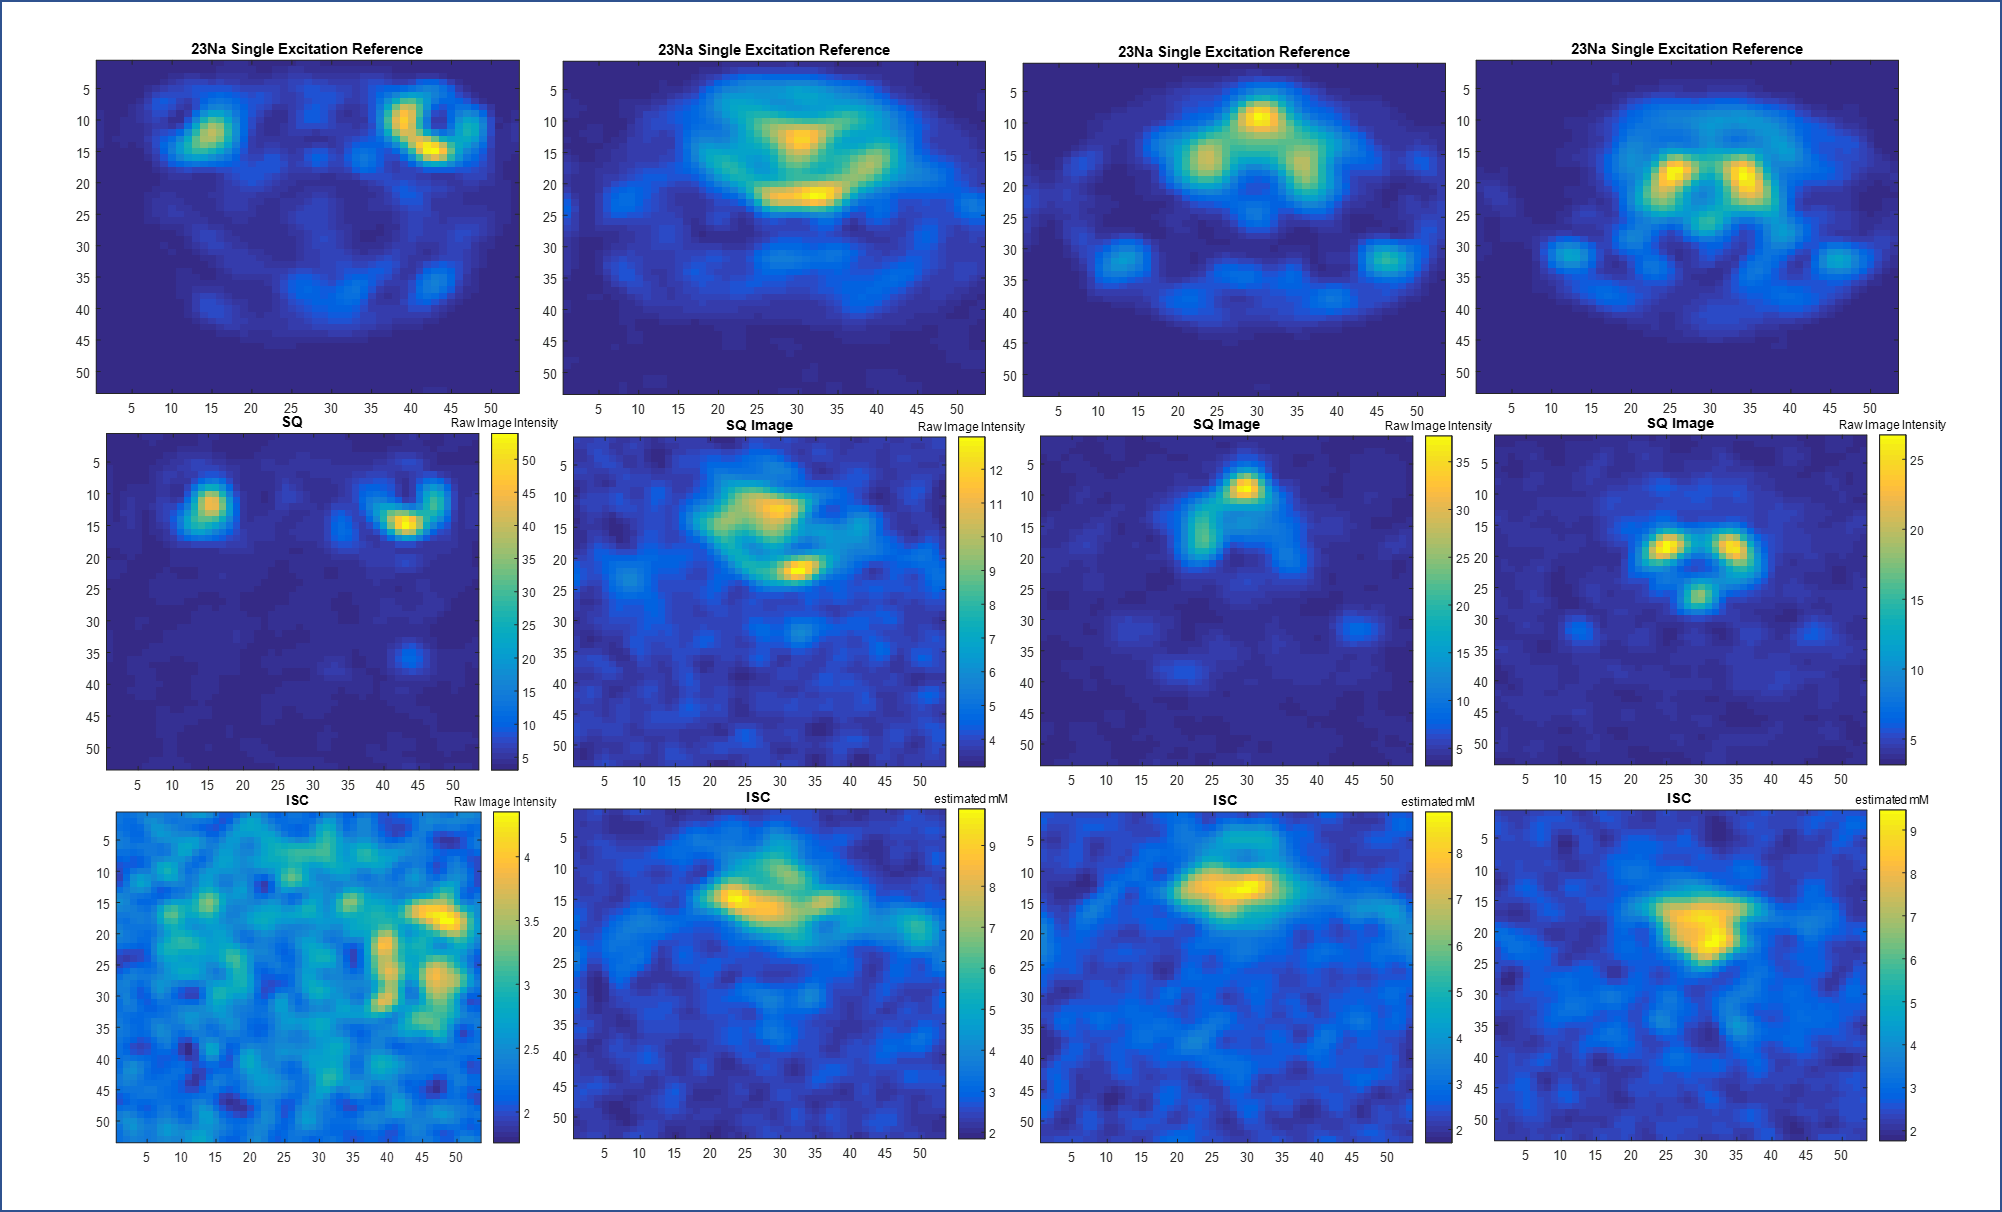
Phantom measurements (Figure 2 and 3) demonstrate the performance of both sequences. The calibrations provide a close but conservative approximation for the concentrations in the phantoms (Table 1). For the TQ acquisitions in the phantom, SNR for the GRE-TQ for 5% agar and 137 mM phantom was 84.7 with ε=18.9, whereas CSI-TQ yielded a SNR of 225.7 with efficiency factor of 23.5 (Table 1). TQ sequences have previously reported creeping signal, particularly in vivo in the ventricles [4], but an overt signal breakthrough is not reported in this study. Figures 4 and 5 are representative of different slices in a naive in vivo rodent brain.Discussion and Conclusions
The results indicate that the CSI-TQ technique is more efficient and the SNR gain is x3 compared to the GRE-TQ application. With the same spatial resolution, the GRE-TQ has a higher temporal resolution, but reports significant SNR decreases compared to the CSI-TQ technique. The greater advantage of the CSI-TQ appears to be a reduction in TE-related signal losses, which provides high sensitivity for lower bound sodium concentrations. Though promising, more work is required to speed up the CSI-TQ acquisition for clinical and preclinical usability.Acknowledgements
This work was supported by the NIH (R01-NS072497 and RO1-NS102395) and User Collaborations Grant Program (to SCG) from the National High Magnetic Field Laboratory, which is funded by the NSF (DMR-1157490) and the State of Florida. All animal experiments were approved by FSU and HMRI animal care and use committees.References
[1] Fleysher L, Oesingmann N, Brown R, Sodickson DK, Wiggins GC, Inglese M. Noninvasive quantification of intracellular sodium in human brain using ultrahigh-field MRI. NMR Biomed 2013;26:9-19.
[2] Fleysher L, Oesingmann N, Inglese M. B-0 inhomogeneity-insensitive triple-quantum-filtered sodium imaging using a 12-step phase-cycling scheme. NMR Biomed 2010;23:1191-1198.
[3] Tanase C, Boada F. Triple-quantum-filtered imaging of sodium in presence of B-0 inhomogeneities. J Magn Reson 2005;174:270-278.
[4] Tsang A, Stobbe RW, Beaulieu C. Triple-quantum-filtered sodium imaging of the human brain at 4.7 T. Magn Reson Med 2012;67:1633-1643.
Figures