3864
Assessment of Bound Sodium using Triple Quantum Selection vs. Inversion Recovery at 21.1 T1Chemical & Biomedical Engineering, Florida State University, Tallahassee, FL, United States, 2Center for Interdisciplinary MR, National High Magnetic Field Laboratory, Tallahassee, FL, United States, 3Physics, Florida State University, Tallahassee, FL, United States, 4Huntington Medical Research Institutes, Pasadena, CA, United States
Synopsis
This study evaluates Triple Quantum (TQ) and Inversion Recovery (IR) techniques at 21.1 T with regards to bound sodium quantification. Using both gel phantoms imitating physiological concentrations/bound fractions as well as in vivo animal pathological models, the efficiency, SNR and selectivity of 23Na TQ and IR techniques were compared with the ultimate goal of localizing specific sodium changes within intra- and extracellular compartments related to disease progression.
Introduction
Triple Quantum (TQ) and Inversion Recovery (IR) techniques have been used to separate sodium (23Na) MR signals between bound and bulk contributions based on differential relaxation and tissue properties [1-5]. Potentially, TQ and IR methods offer non-invasive techniques to detect intracellular sodium changes dynamically. In pathologies, the classification and quantification of intracellular versus extracellular sodium distributions may directly probe cellular function related to ionic homeostasis and Na+-K+-ATPase transport.
Performed at 21.1 T, this study aims to compare the 23Na TQ and IR techniques with regard to SNR, efficiency and specificity in both phantoms and in vivo preclinical models, which include ischemia and hydrocephalous, with a goal of identifying which approach provides the best discrimination of the bound sodium or intracellular concentration.
Materials and Methods
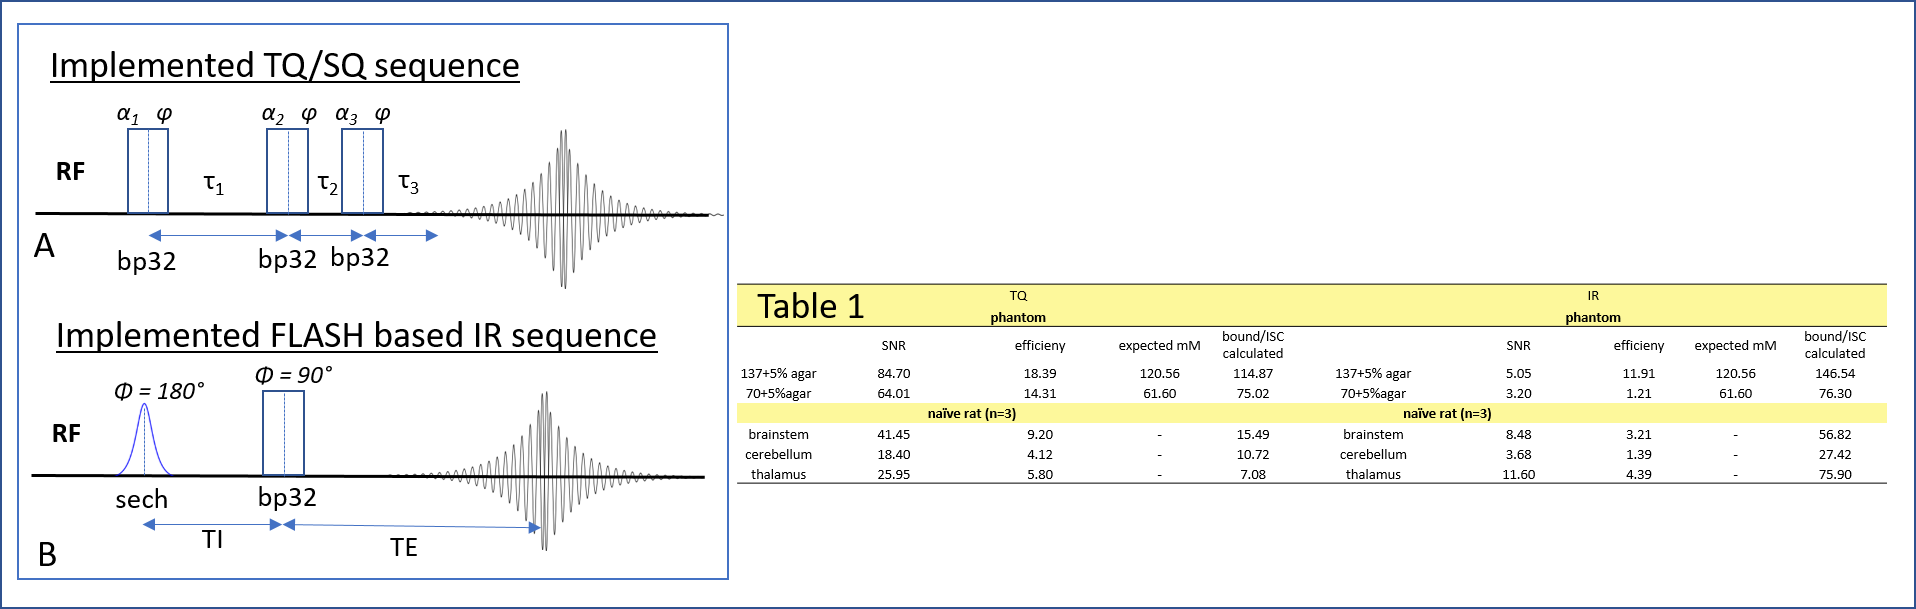
Using the 21.1-T ultra-wide bore magnet at the US National High Magnetic Field Laboratory and a linear 1H/23Na birdcage coil, 23Na images were acquired using a modified gradient recalled echo (GRE) sequence that included either TQ or IR preparation, schematically presented in Figure 1. Following pulse calibration (α=90° corresponded to a 0.185-ms hard pulse at ~100 W), B0 and B1 mapping were performed using two single quantum (SQ) images with either a TE difference (ΔTE=2 ms) or a Double Angle Method (α1=60°, α2=120°), respectively.
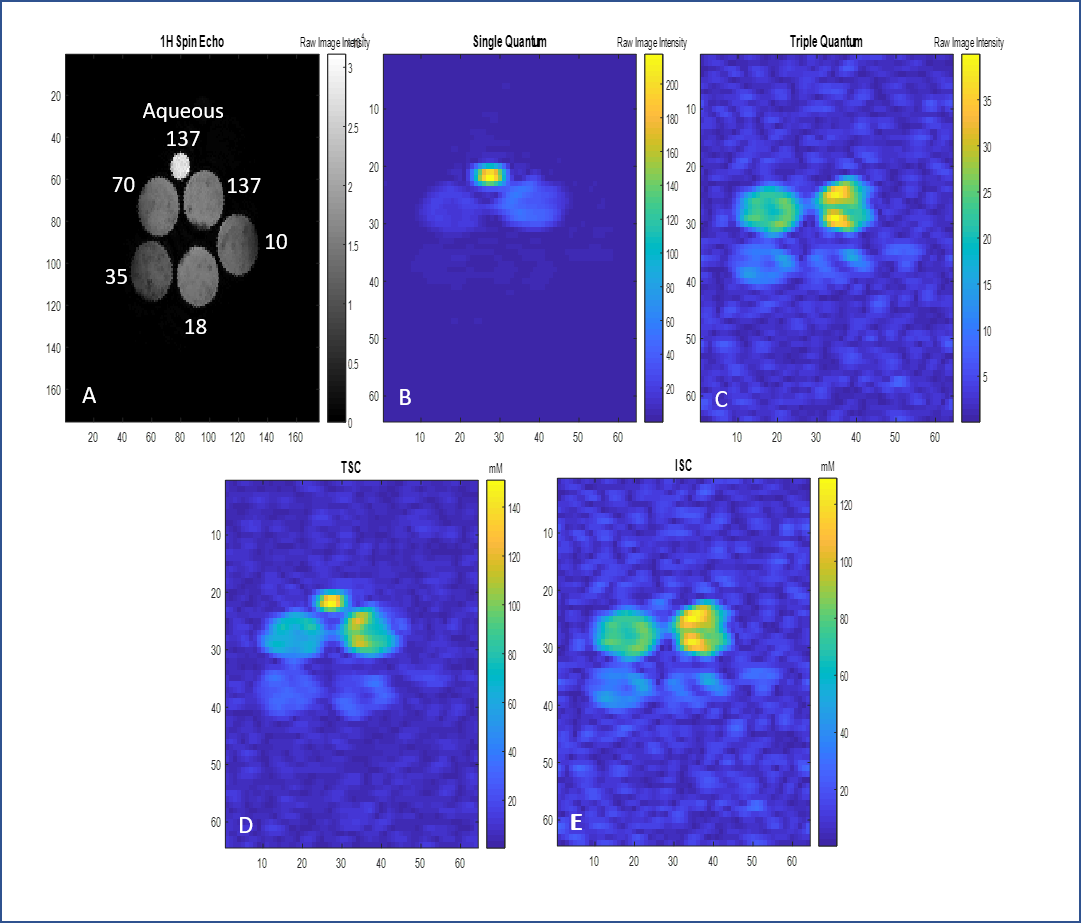
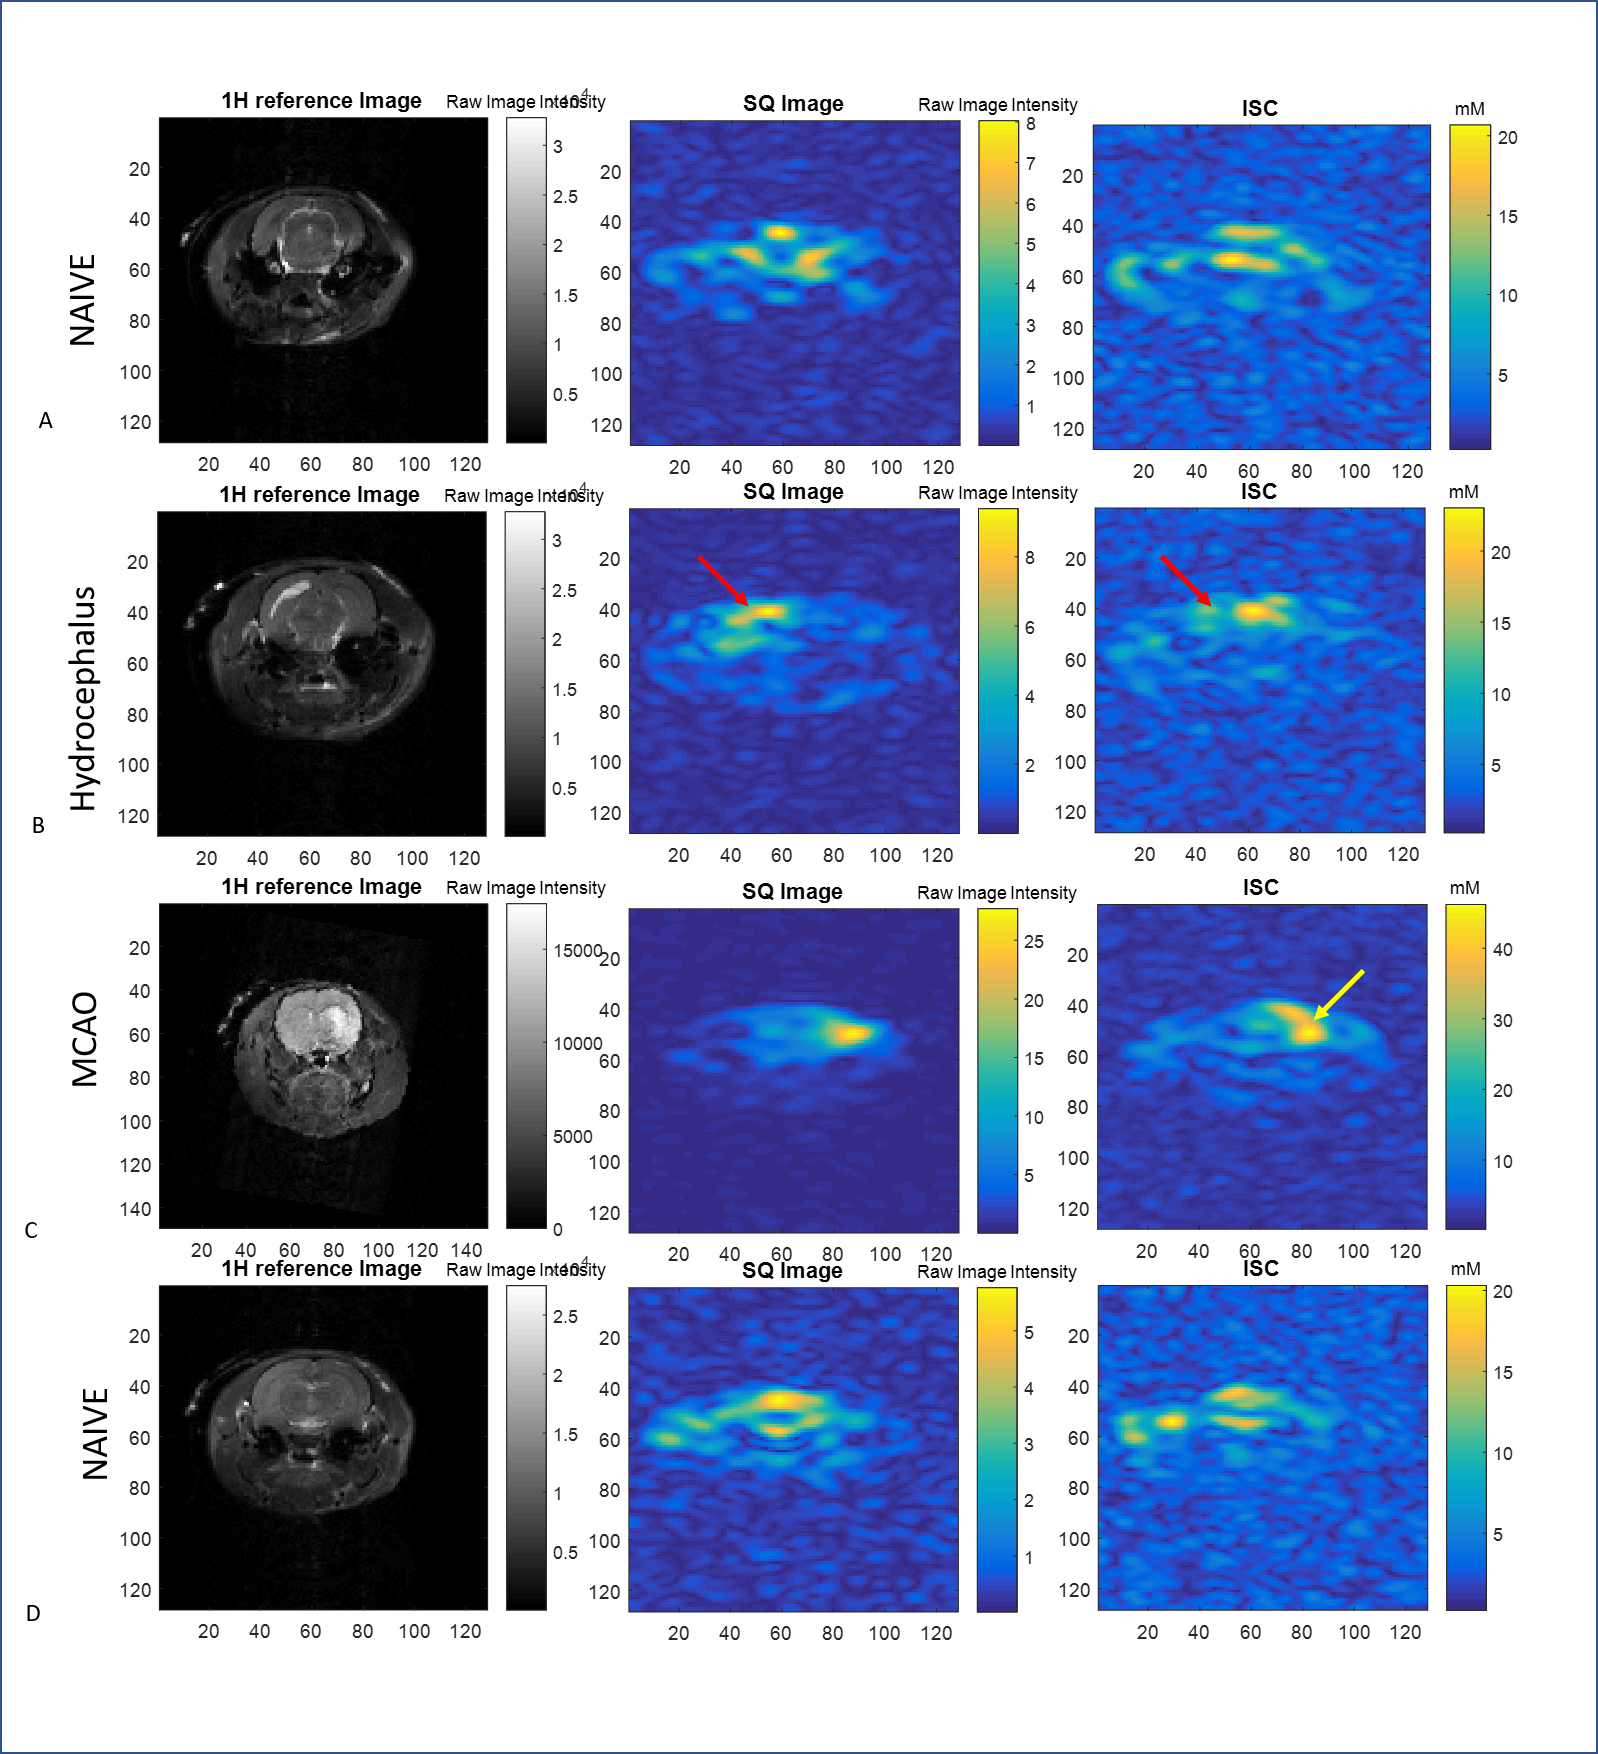
Phantom and Animal specimens: Five 10-mm NMR tubes with concentrations of sodium ranging from 10-137 mM in 5% agar and one tube consisting of aqueous saline (137 mM) provided biologically relevant bound and bulk 23Na signals. Five Sprague-Dawley male rats were imaged to provide conditions of naïve controls, ischemic stroke via transient middle cerebral artery occlusion, or hydrocephalus.
TQ Acquisitions: This study used a three-pulse coherence transfer technique (Figure 1a) that employed a modified 12-phase cycling scheme for TQ selection and B0 correction [2,5]. For the three excitation pulses, flip angles α1,2,3 were set to 90° with τ1=7.5 ms, τ2=10ms and τ3=7.3ms to maximize signal [6]. For a FOV of 6.4x6.4x3.2 cm, BW = 130 Hz/pixel and TR = 105ms, 3D TQ images were acquired with an isotropic resolution of 2x2x2mm over a total of 20 min. A single quantum (SQ) data-set also was acquired with the same parameters but a standard DC offset and quadrature correction phase cycling scheme.
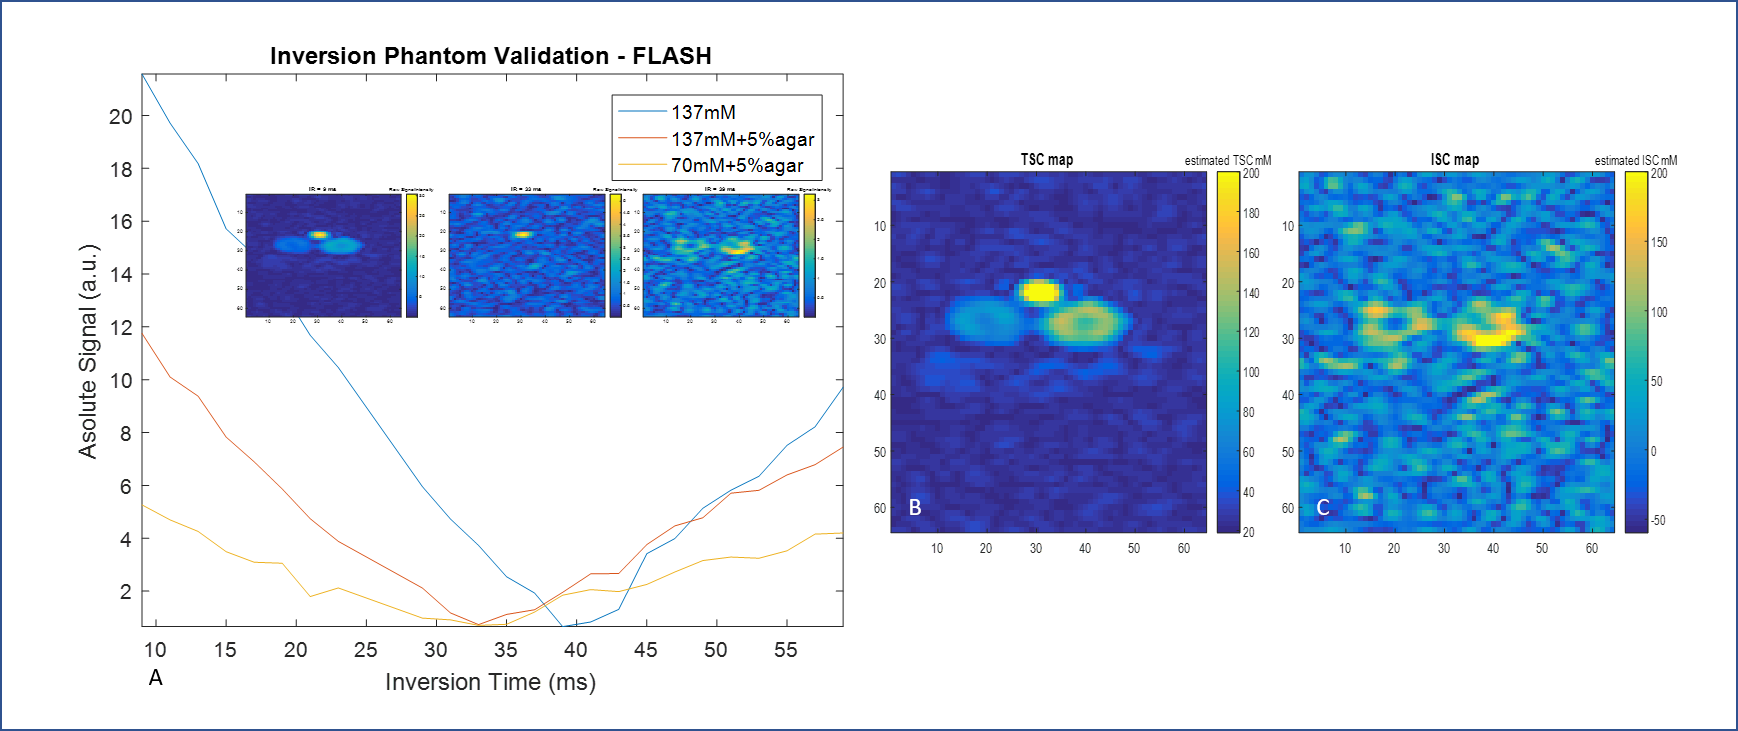
IR Acquisitions: Using a 5-ms hyperbolic secant for inversion, IR scans consisted of TI=39ms, TE=0.7ms, TR=180ms and α=90° excitation to null extracellular sodium. With 6 averages acquired over 7 min, FOV and resolution were otherwise the same as TQ scans. Two sets of data were acquired with IR pulse ON to generate bound sodium maps and with IR pulse turned OFF to generate total sodium maps.
Data Analysis: Intracellular/bound sodium concentration (ISC) maps [1] based on TQ sequences were generated (Figure 2). Linear regression models were derived for the IR scans for both the inversion ON and OFF sequences by calibration of signal to the gel phantom [3]. .Techniques were compared in Table 1 by the efficiency factor, $$ε=SNR/√(TimeAcquisition)$$
Results and Discussion
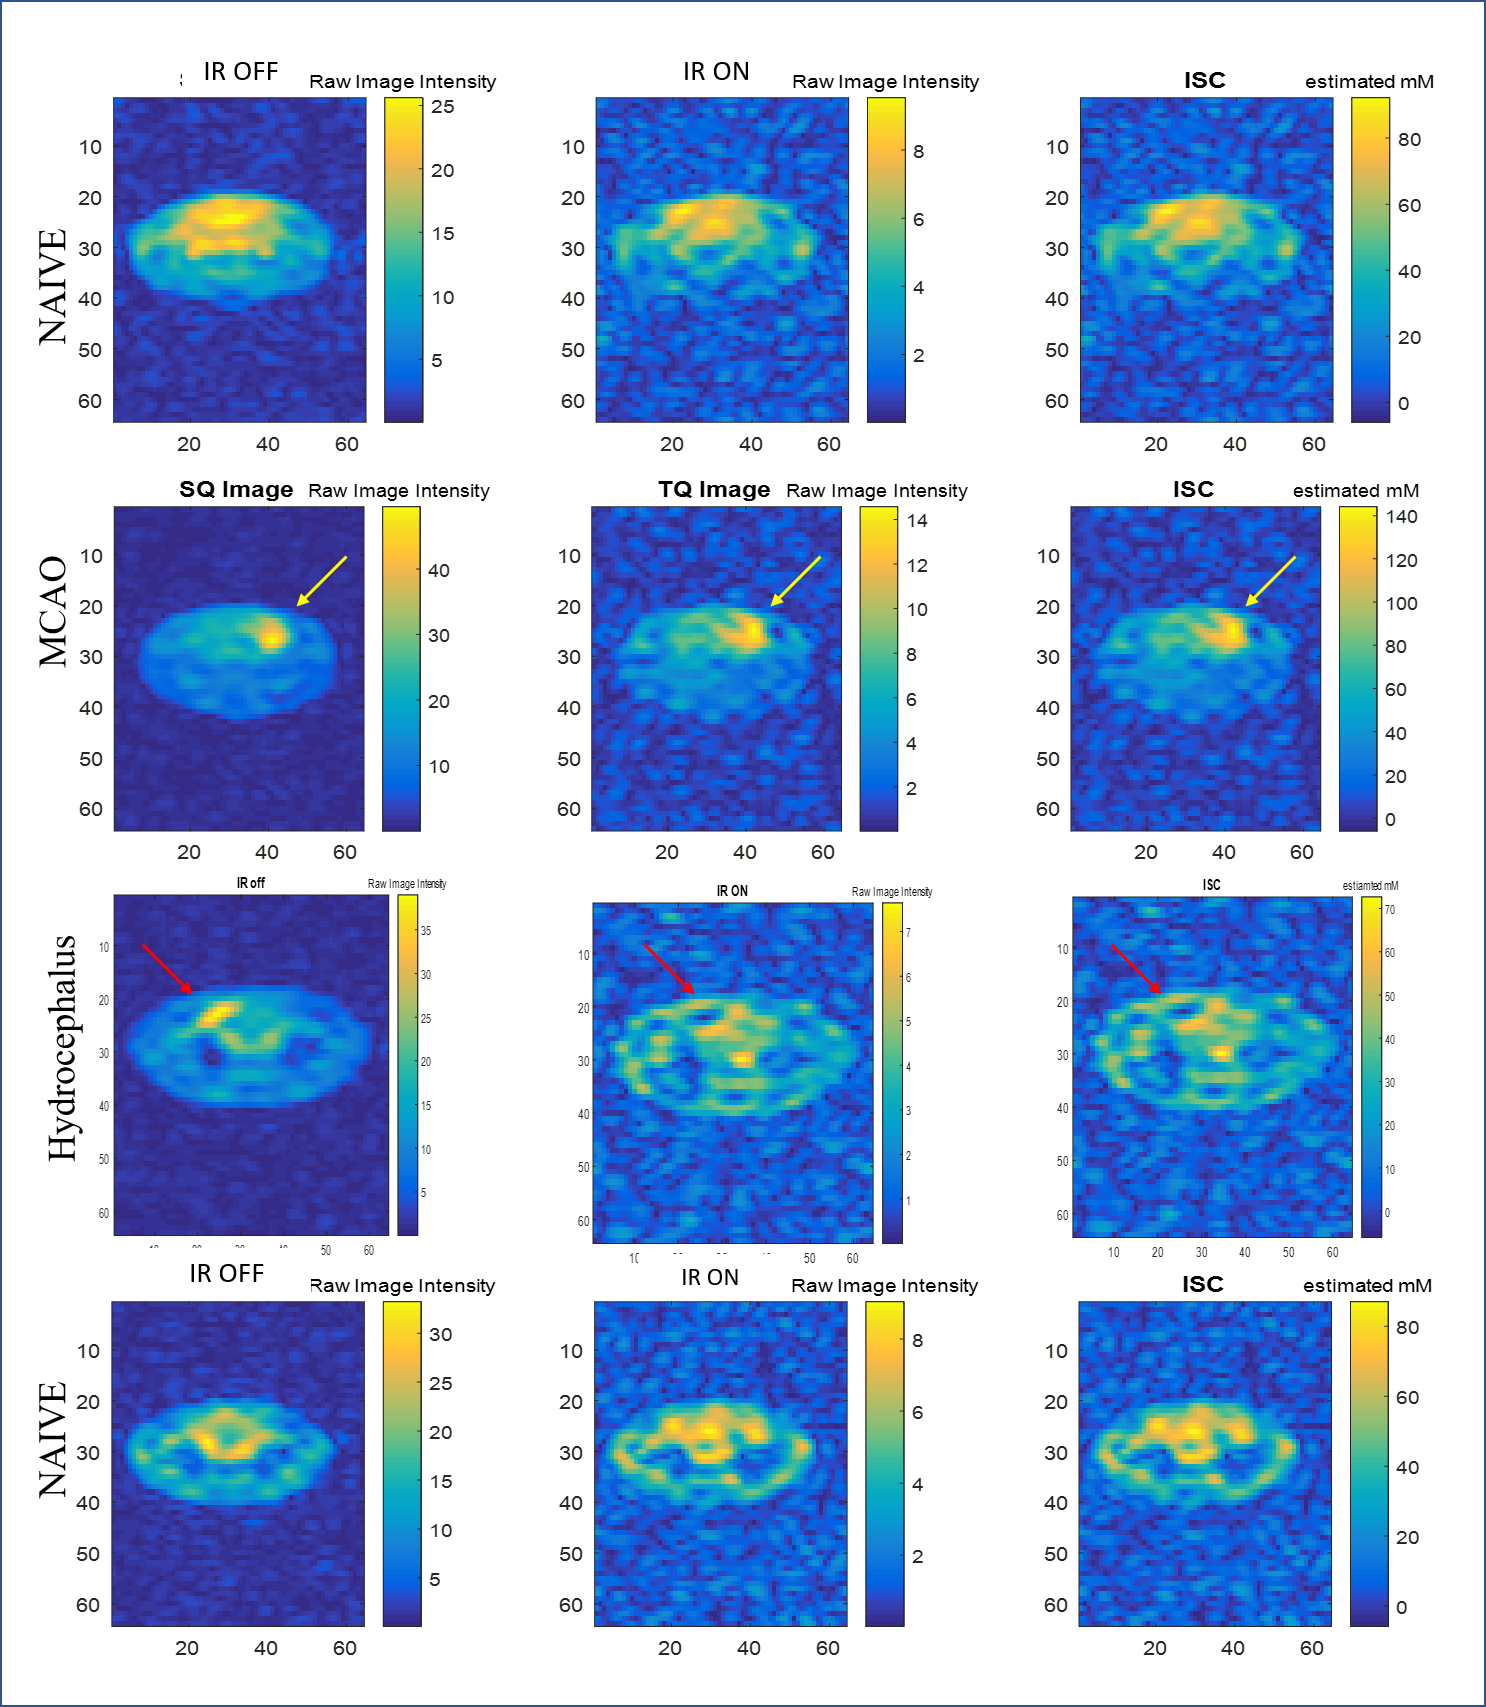
Figures 2 and 3 show the representative TQ and IR based maps in the phantom, respectively. Figures 4 and 5 are representative of TQ and IR based sodium distributions within the in vivo rodent brain corresponding to naïve, ischemic and hydrocephalic rats. Calibrations provide a close approximation to the phantom concentrations. Both TQ and IR acquisitions overestimate the bound sodium, but assuming an 88% bound fraction of sodium for 5% agar and 137-mM saline based on molar fraction calculations, the TQ error is <5% while the IR error is 22%. This relationship holds for the lower bound sodium concentrations as well as for the naïve in vivo values, for which TQ measurements correspond well to the intracellular sodium range from literature. Phantom concentrations and naïve in vivo values demonstrate better SNR and efficiencies for the TQ approach compared to the IR acquisitions, particularly at lower expected concentrations. Pathological ISC maps also are more representative of anticipated increases in intracellular sodium for the TQ approach (Figure 4 vs. Figure 5).Conclusions
IR and TQ approaches give different information regarding the sodium environment, and a true comparison between the efficiency and validity of the techniques is inherently imperfect. At the same spatial resolution, the TQ technique, despite sacrifices in temporal resolution compared to IR acquisitions, provides higher SNR and efficiencies, particularly at lower bound sodium concentrations. Most critically, the TQ quantification of bound sodium and in vivo intracellular sodium concentrations are much more accurate than the IR approach in terms of percent error and absolute quantification.Acknowledgements
This work was supported by the NIH (R01-NS072497 and RO1-NS102395) and User Collaborations Grant Program (to SCG) from the National High Magnetic Field Laboratory, which is funded by the NSF (DMR-1157490) and the State of Florida. All animal experiment were approved by FSU and HMRI animal care and use committeesReferences
[1] Fleysher L, Oesingmann N, Brown R, Sodickson DK, Wiggins GC, Inglese M. Noninvasive quantification of intracellular sodium in human brain using ultrahigh-field MRI. NMR Biomed 2013;26:9-19.
[2] Fleysher L, Oesingmann N, Inglese M. B-0 inhomogeneity-insensitive triple-quantum-filtered sodium imaging using a 12-step phase-cycling scheme. NMR Biomed 2010;23:1191-1198.
[3] Madelin G, Kline R, Walvick R, Regatte RR. A method for estimating intracellular sodium concentration and extracellular volume fraction in brain in vivo using sodium magnetic resonance imaging. Sci Rep 2014;4:4763.
[4] Madelin G, Regatte RR. Biomedical applications of sodium MRI in vivo. J Magn Reson Imaging 2013;38:511-529.
[5] Tanase C, Boada F. Triple-quantum-filtered imaging of sodium in presence of B-0 inhomogeneities. J Magn Reson 2005;174:270-278.
[6] Tsang A, Stobbe RW, Beaulieu C. Triple-quantum-filtered sodium imaging of the human brain at 4.7 T. Magn Reson Med 2012;67:1633-1643.
Figures