3863
MRSI-based characterization of GBM using a novel map: Expected Distance to Tumor (EDT)1Institute for Diagnostic and Interventional Neuroradiology, University of Bern, Bern, Switzerland, 2Institute for Surgical Technology and Biomechanics, University of Bern, Bern, Switzerland, 3Institute of Radiooncology, University of Bern, Bern, Switzerland, 4Neurosurgery, University of Bern, Bern, Switzerland
Synopsis
MRSI can detect regions of brain tumor infiltration beyond the tumor borders visible in structural-MRI (sMRI). However, this is often achieved using only a small fraction of the information provided by MRSI, namely Cho/NAA maps only. Here, we present a new machine-learning-based approach that translates the multidimensional information provided by each spectrum into a single measure: the Expected Distance to solid Tumor volume visible in sMRI. The results show that peritumoral spectra carry information on the distance to
Introduction
Accurate tumor delineation is essential for managing brain tumor patients, namely for planning radiotherapy, guiding surgery and follow-up. Despite this, conventional brain tumor segmentation using sMRI underestimates the tumor extent1. To tackle this problem, the Cho/NAA maps resulting from MRSI recordings have been proposed to detect regions of tumor infiltration not visible in sMRI2–5. In this abstract, the relation between the spectroscopic information and the distance to solid tumor is explored to produce a novel map: Expected Distance to Tumor (EDT). This was done using a regression forest6,7 that was trained to predict the distance to solid tumor based on the metabolite ratios of individual spectra. The hypothesis behind this concept is that regions that share similar metabolic features as the ones found near solid tumor visible in sMRI are likely candidates of tumor infiltration and brain tumor progression, regardless of the real distance to the solid-tumor.Methods
23 pre-operative MRSI examinations (1.5T, Siemens, PRESS, CHESS, TE=135ms, TR=1500ms, 12x12 interpolated to 32x32, interpolated voxel size: 5x5x15mm) were collected from different GBM patients. All spectra from outside the PRESS-box and a single outer voxel column/row of the excited PRESS volumes were discarded. 7 extra MRSI recordings were acquired from 3 healthy volunteers using the same acquisition parameters. The protocol included T1-weighted, T1c-weighted, T2-weighted and FLAIR MRI.
MRSI data processing was performed using jMRUI’s SpectrIm plugin8 and included the following steps:
- Residual water removal using HLSVD9;
- Automatic Quality Control10,11;
- Frequency-Shift Correction;
- Auto-phasing;
- Quantification using QUEST12;
- Selection profile correction13.
The sMRI images were segmented automatically using BraTumIA14,15 into: white-matter (WM), gray-matter (GM), cerebral-spinal-fluid (CSF), edema, non-enhancing tumor (NE-Tumor), enhancing tumor (E-Tumor) and necrosis. Solid Tumor Volume (STV) was defined as the union of NE-Tumor, E-Tumor, and necrosis.14 MRS features were extracted from each spectrum: %NAA, %Cho, %Cr, %Glx, %Lac, %Lip, Cho/Cr, Cho/NAA, Glx/NAA, Glx/Cr, Lac/Cr, Lip/Cr, Lac/NAA and Lip/NAA (%”Metabolite”= ratio between metabolite area and sum of all metabolite areas; Lip = Lip1.3+Lip0.9; Glx = Glu+Gln).
The distance from each voxel to the STV was calculated as the Euclidean distance to the nearest voxel assigned to one of the classes of the STV. The different compartments of the STV were labeled with different artificial distances (0 for NE-Tumor, -1 for E-Tumor and -2 for Necrosis).
A regression forest7 was trained to predict the distance to STV based on the 14 features previously described. Training and testing were done after Fourier-interpolation (factor 4) of the metabolite maps and performed using 6-fold Cross-Validation. The trained regressors were used to evaluate which features carry the most information to estimate EDT values. Two different measures of feature importance were analyzed6,7: increase in Mean Squared Error (MSE) and residual sum of squares.
Results/Discussion
Figure 1 shows for 5 different cases: (a.) the sMRI-segmentation performed by BraTumIA, (b.) the EDT maps, and (c.) 5 of the most important metabolite maps according to the feature importance plots of Figure 2. Interestingly, the EDT maps reveal different types of tumor borders: borders where the EDT values change abruptly (see case #5, left part of the image), borders where the EDT values change smoothly (case #1 and #3), and borders where small EDT values are seen far from the solid-tumor (see case #3). Another interesting aspect is that %NAA and Glx/NAA seem to contain more information to predict the distance to tumor than Cho/NAA.
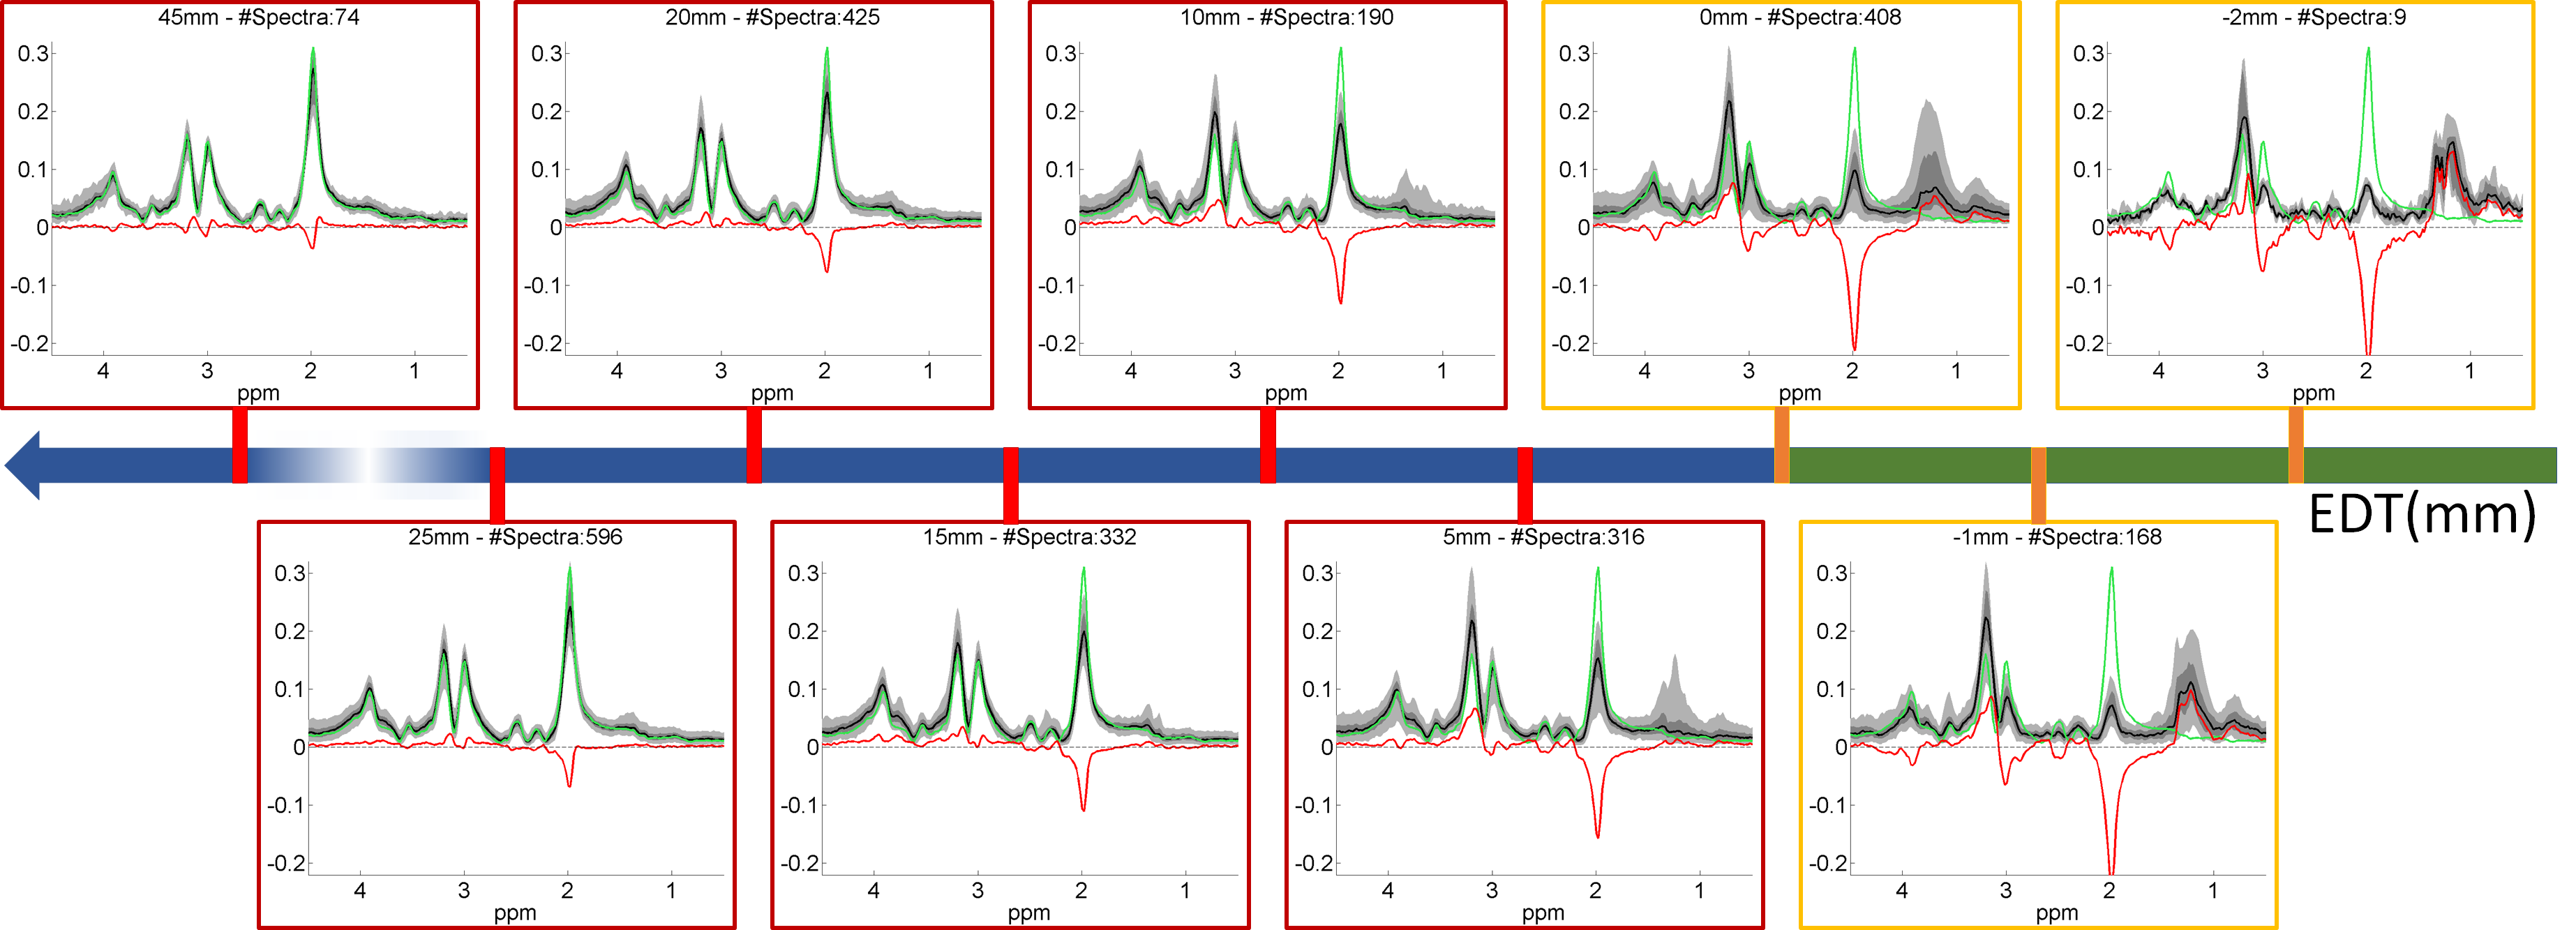
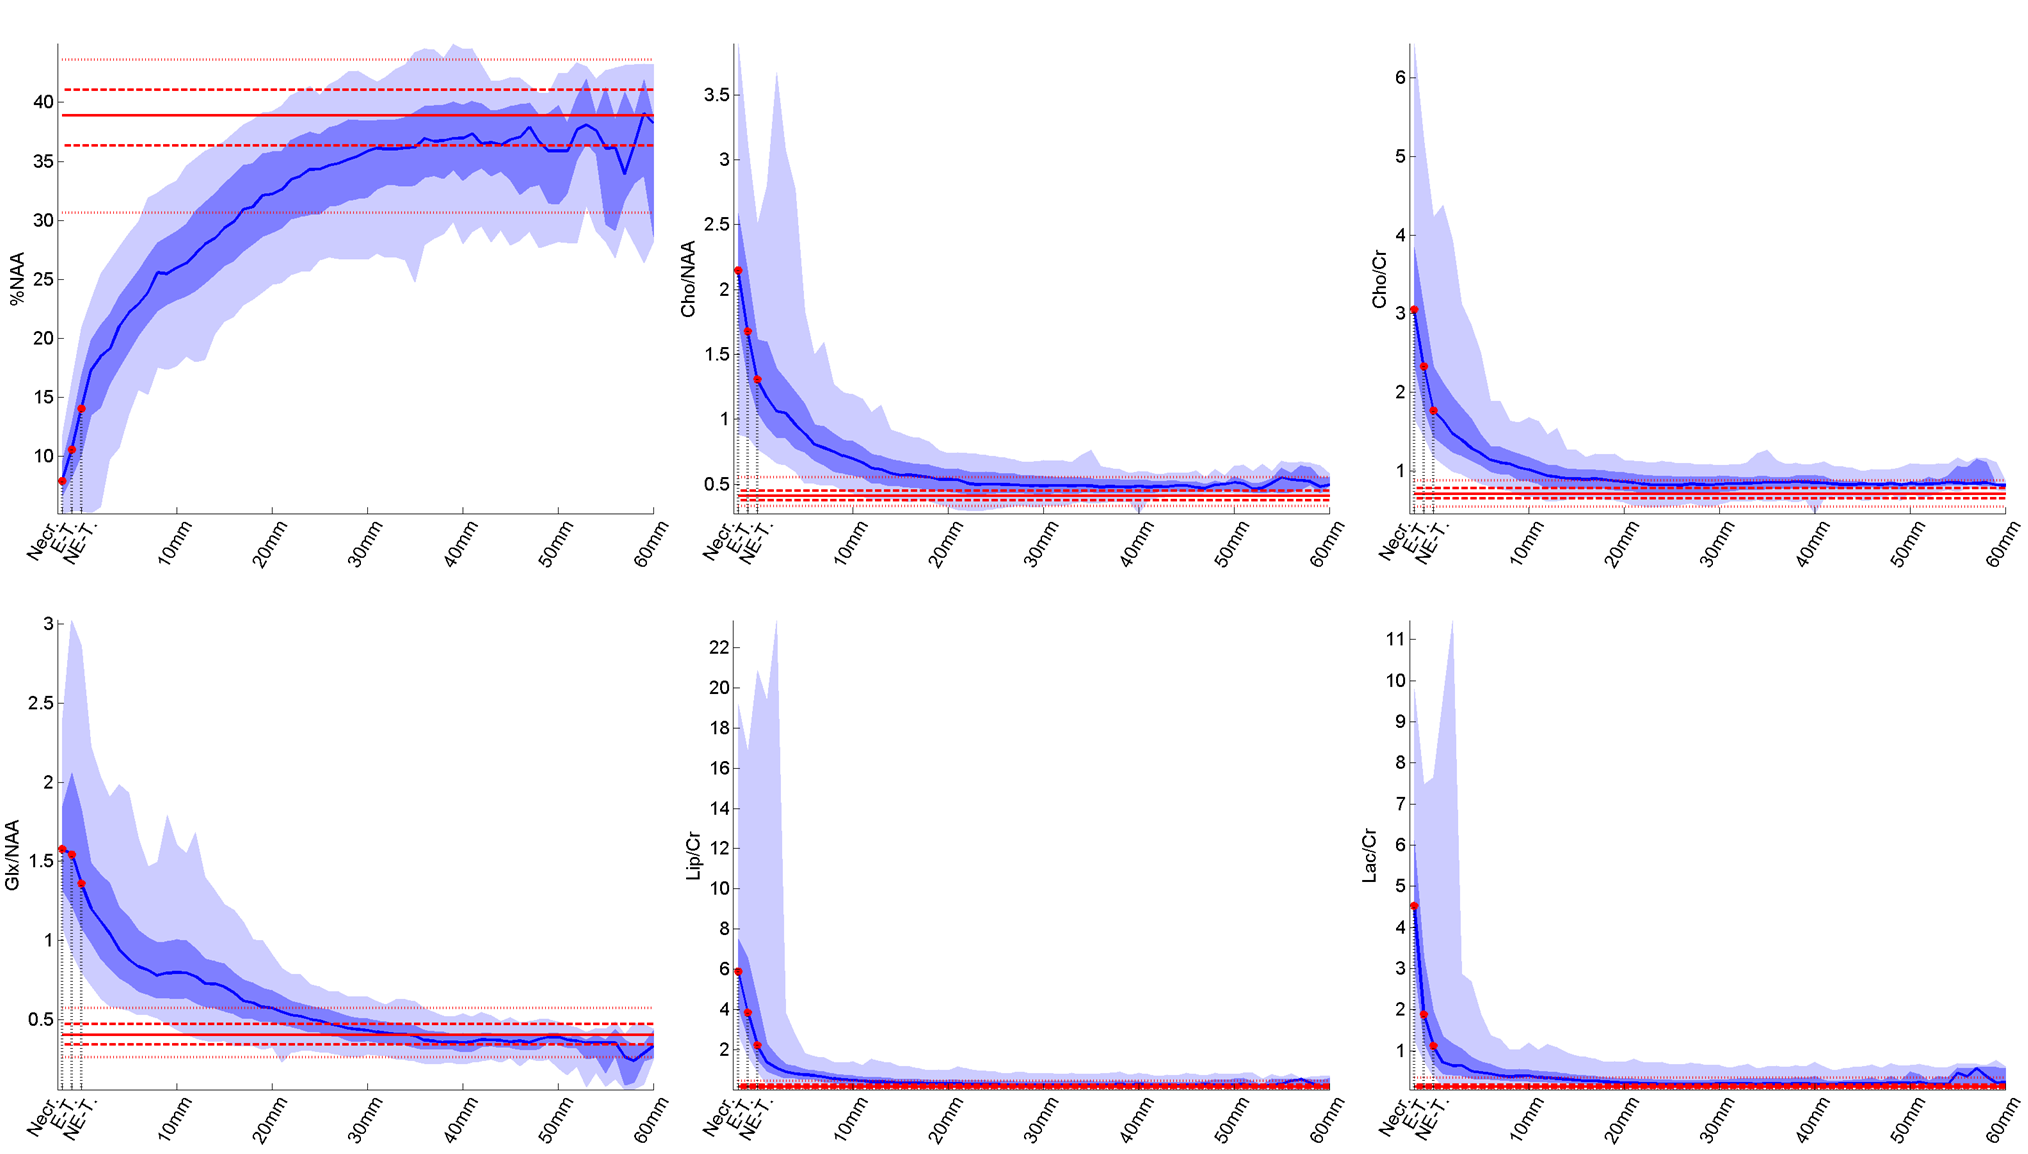
Figure 3 shows the spectra associated with different EDT values (black and gray shades), together with the median spectra acquired from healthy controls (green), and the difference between the two median spectra (red). Figure 4 shows the values of 6 of the most important features as a function of the EDT value. These results show that EDT values correspond, to a certain extent, to a stage in tumor progression: normal spectra show large EDT values and the expected distance decreases as the features of the spectrum show more malignant features. This means that EDT maps might be an interesting approach for performing dimensionality reduction in MRSI data of brain tumors, allowing for an easier clinical interpretation of MRSI data.
Conclusion
A novel MRSI-based map was presented that incorporates the spectral information from different metabolites into a single value that may potentially improve tumor delineation and facilitate interpretation of brain-tumor MRSI data. Further studies, combining MRS and histology, are required to validate the relationship between EDT values and tissues types/tumor cellularity. Moreover, the practical usage of EDT values in brain tumor treatment needs also to be evaluated.Acknowledgements
This work was funded by the EU Marie Curie FP7-PEOPLE-2012-ITN project TRANSACT (PITN-GA-2012-316679) and the Swiss National Science Foundation (project number 140958).References
- Yamahara, T. et al. Morphological and flow cytometric analysis of cell infiltration in glioblastoma: A comparison of autopsy brain and neuroimaging. Brain Tumor Pathol. 27, 81–87 (2010).
- Cordova, J. S. et al. Whole-brain spectroscopic MRI biomarkers identify infiltrating margins in glioblastoma patients. Neuro. Oncol. 18, 1180–1189 (2016).
- Guo, J. et al. The relationship between cho/naa and glioma metabolism: Implementation for margin delineation of cerebral gliomas. Acta Neurochir. (Wien). 154, 1361–1370 (2012).
- Stadlbauer, A. et al. Improved delineation of brain tumors: An automated method for segmentation based on pathologic changes of 1H-MRSI metabolites in gliomas. Neuroimage 23, 454–461 (2004).
- Ganslandt, O. et al. Proton magnetic resonance spectroscopic imaging integrated into image-guided surgery: Correlation to standard magnetic resonance imaging and tumor cell density. Neurosurgery 56, (2005).
- Liaw, a & Wiener, M. Classification and Regression by randomForest. R news 2, 18–22 (2002).
- Breiman, L. Random forests. Mach. Learn. 45, 5–32 (2001).
- jMRUI website. at <www.jmrui.eu>
- den Boogaart, A., Van Ormondt, D., Pijnappel, W. W. F., De Beer, R. & Ala-Korpela, M. Removal of the water resonance from 1H magnetic resonance spectra. Math. signal Process. 3, 175–195 (1994).
- Pedrosa de Barros, N., Mckinley, R., Knecht, U., Wiest, R. & Slotboom, J. Automatic quality control in clinical 1 H MRSI of brain cancer. NMR Biomed. (2016). doi:10.1002/nbm.3470
- de Barros, N. M. et al. Automatic quality assessment of short and long-TE brain tumour MRSI data using novel Spectral Features. in ISMRM 2016, Singapore (2016).
- Ratiney, H. et al. Time-domain semi-parametric estimation based on a metabolite basis set. NMR Biomed. 18, 1–13 (2005).
- Pedrosa de Barros, N. & Slotboom, J. Quality management in in vivo proton MRS. Anal. Biochem. 529, (2017).
- Meier, R. et al. Clinical Evaluation of a Fully-automatic Segmentation Method for Longitudinal Brain Tumor Volumetry. Sci. Rep. 6, 23376 (2016).
- Porz, N. et al. Multi-modal glioblastoma segmentation: Man versus machine. PLoS One 9, e96873 (2014).
Figures
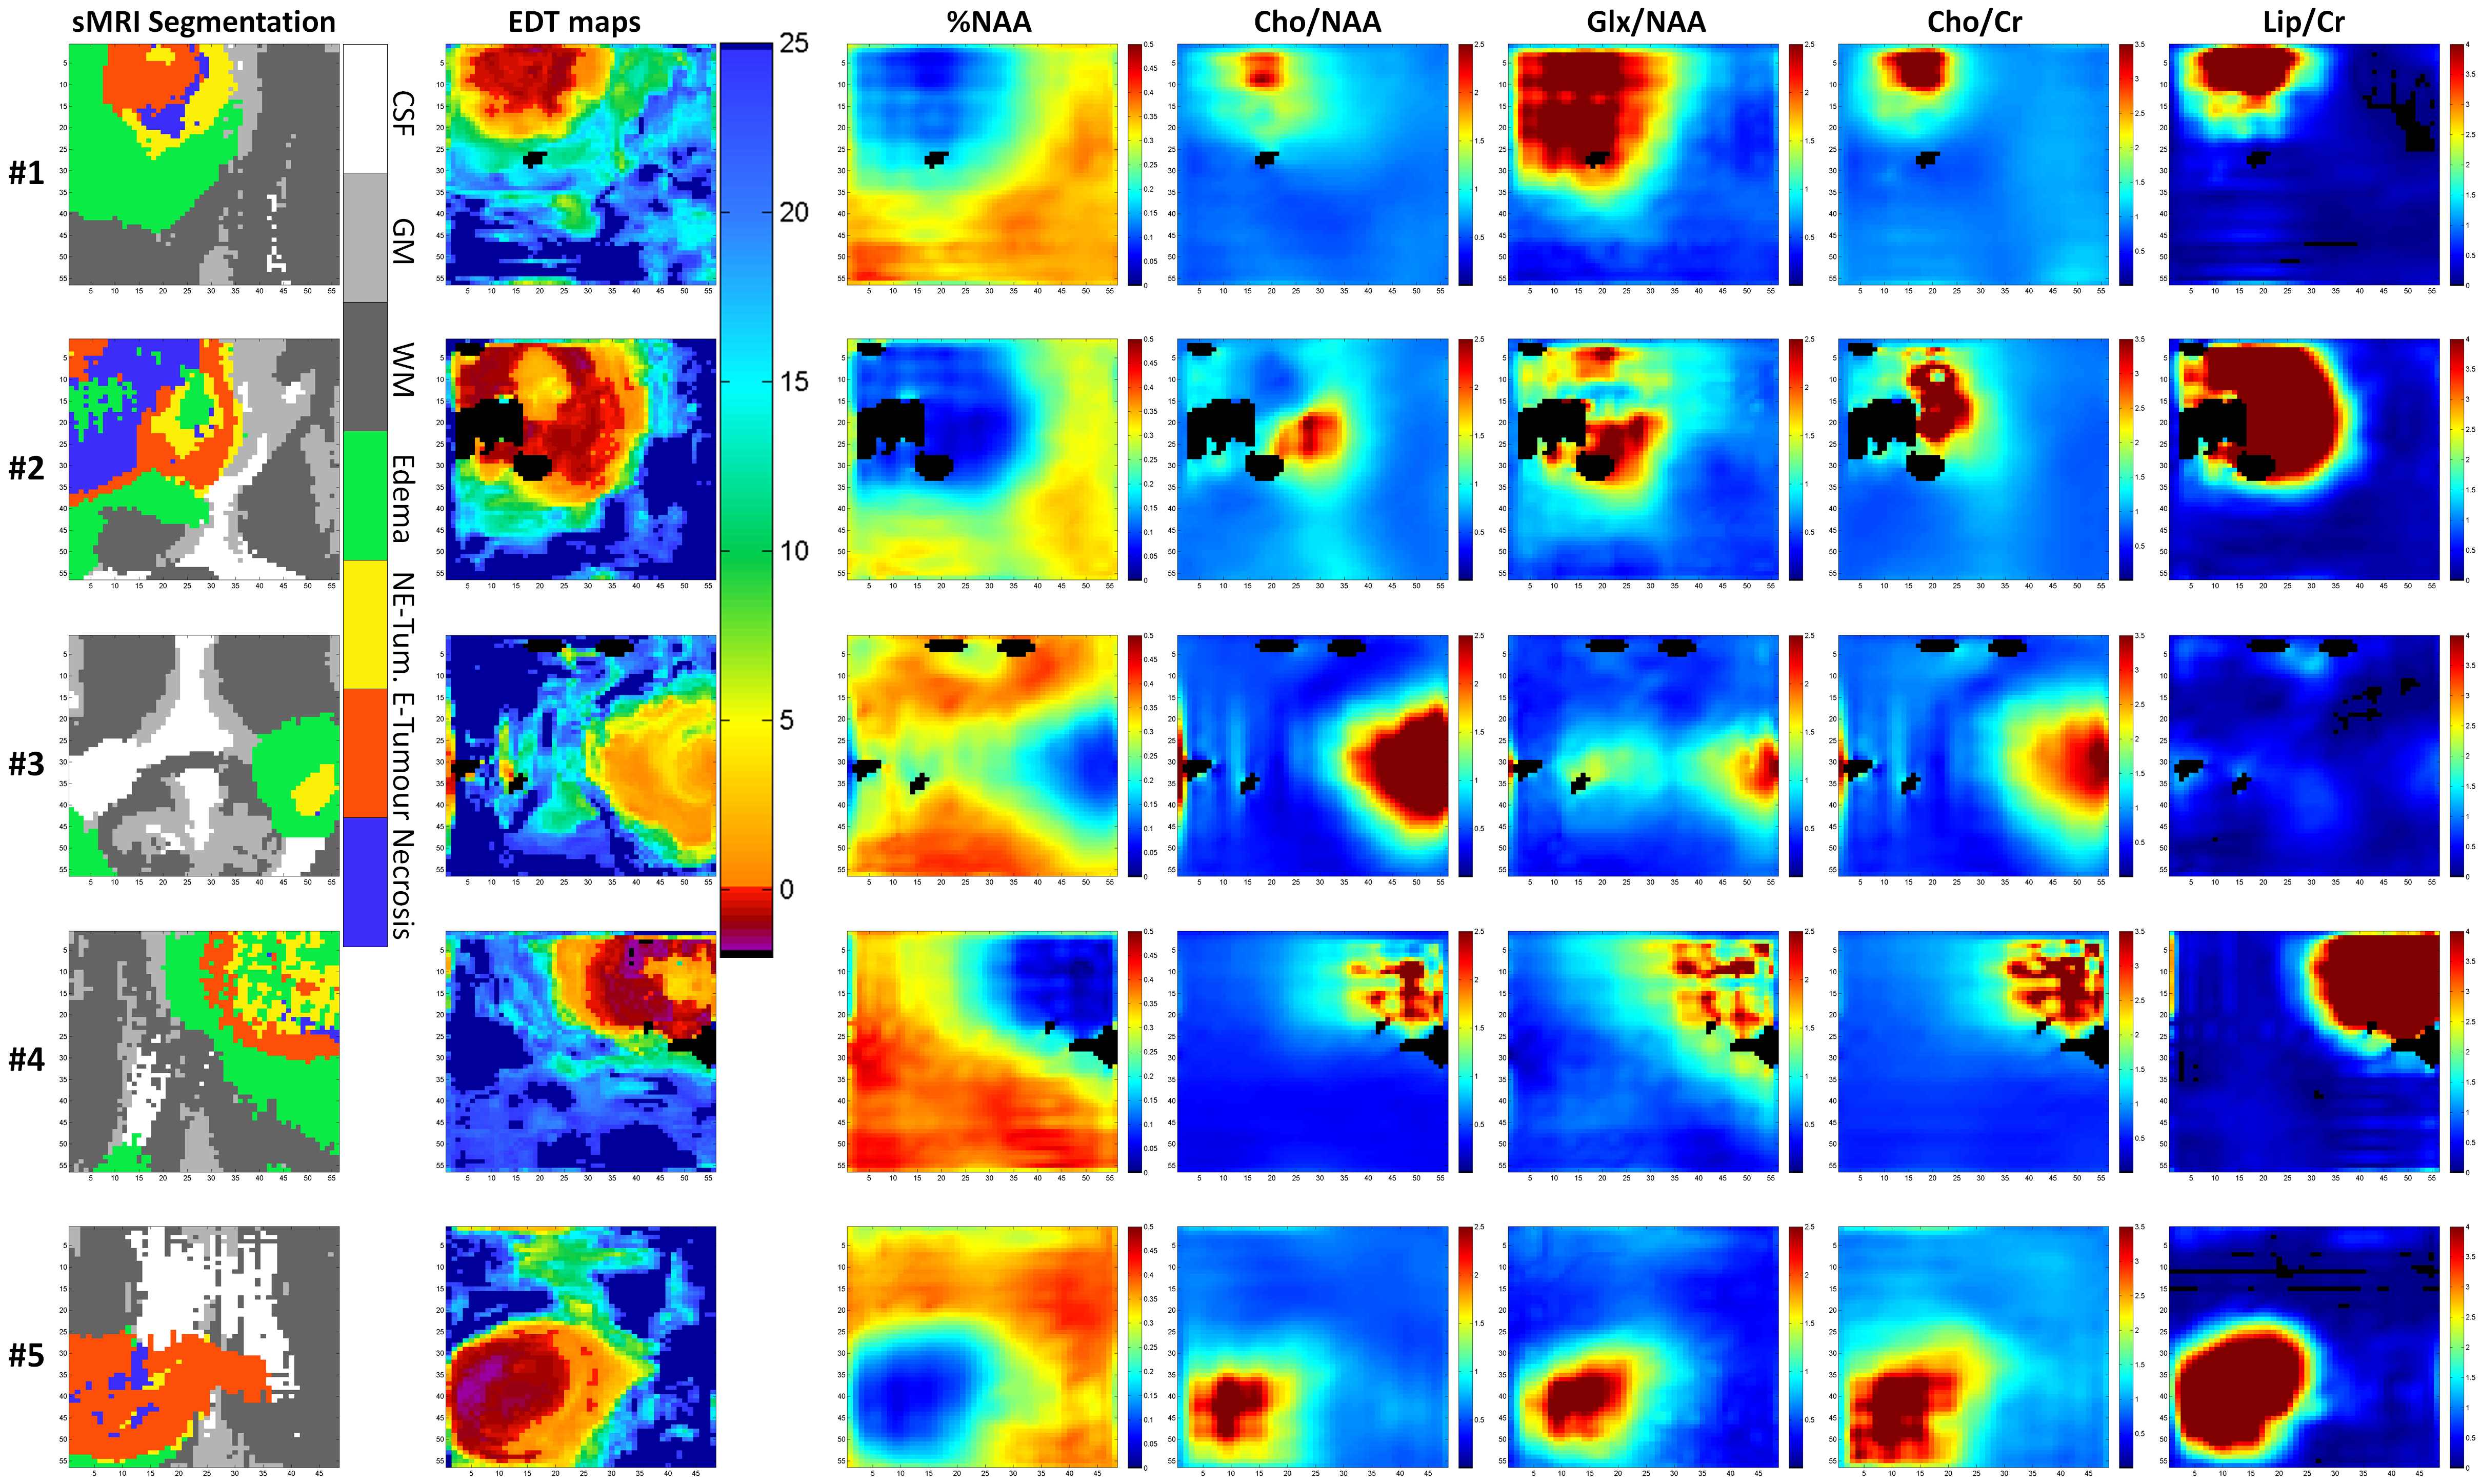
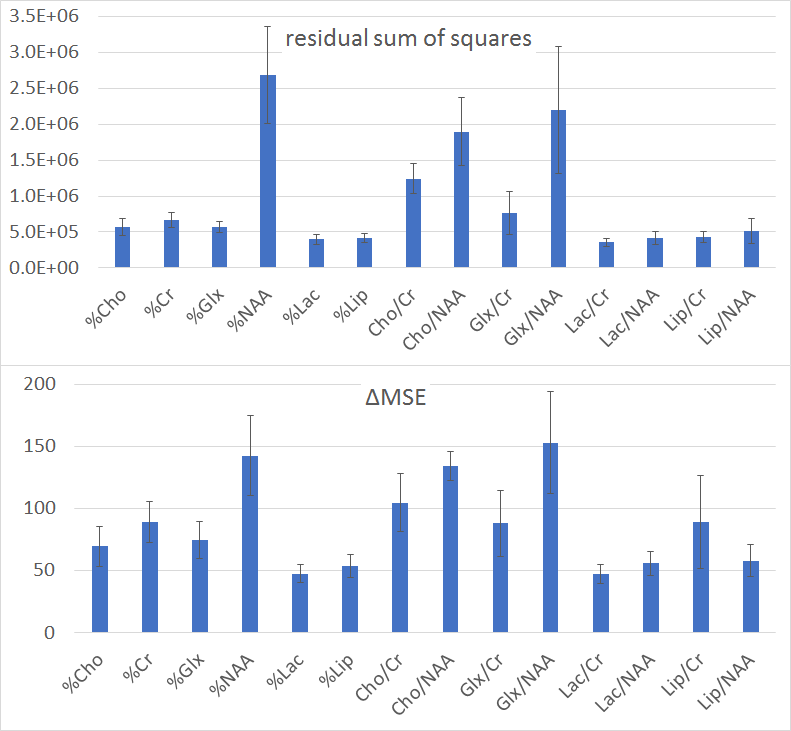
Figure 2 - Feature importance plots of the Regression Forests trained to estimate the distance to the tumor. The bar plots show the mean ± 2 times the standard deviation values calculated based on the 6-fold CV scheme used to train and test the RF models. For a better explanation of the meaning of these measures please see 6,7.