3860
Assessment of metabolic heterogeneity in glioblastoma multiforme (GBM) through histogram analysis of whole-brain echo planar spectroscopic imaging1Radiology, Icahn School of Medicine at Mount Sinai, New York, NY, United States, 2Neuroradiology, Hospital of the University of Pennsylvania, Philadelphia, PA, United States, 3Pathology, Hospital of the University of Pennsylvania, Philadelphia, PA, United States, 4Neurosurgery, Hospital of the University of Pennsylvania, Philadelphia, PA, United States, 5Cellular and Molecular Physiology, University of Liverpool, Liverpool, United Kingdom
Synopsis
Glioblastoma multiforme (GBM) is an infiltrating and heterogeneous disease with low median survival and over 70% recurrence rates, though 20-30% of progressive enhancing lesions seen in GBM post-treatment exhibit pseudoprogression rather than true recurrent tumor. Differentiating these could improve speed and accuracy of treatment. A statistical and histogram analysis of segmented high-resolution echo-planar spectroscopic imaging data goes beyond mean metabolite ratios to show distribution of Cho/NAA and Cho/Cr ratios in contrast enhancing regions and the surrounding tissue. Cho/NAA distribution in enhancing region showed greater kurtosis than Cho/Cr, suggesting reduction in NAA may be a driving factor in observed Cho/NAA increases.
Introduction
Glioblastoma multiforme (GBM) is an infiltrating and heterogeneous disease, and the most common form of primary brain cancer. Despite aggressive standard-of-care treatment entailing maximal surgical resection followed by radiation therapy with adjuvant temozolomide (TMZ), GBM exhibits recurrence rates as high as 70% with consequently low median overall survival. However, 20-30% of enhancing lesions seen at 6 months post-treatment may be pseudoprogression (PsP) (1-4), characterized as progressive and enhancing lesions that stabilize or decrease in size through TMZ therapy alone, as opposed to true progressive tumor (TP). Accurate differentiation of PsP from TP carries direct clinical implications, whether in avoiding unnecessary invasive surgery in the case of PsP or the discontinuation of ineffective TMZ to accelerate surgical intervention for TP. Whole-brain echo-planar spectroscopic imaging (EPSI) (5-8) has previously been demonstrated as an effective non-invasive technique for assessing abnormal biochemistry within these high-grade gliomas and the surrounding edema. This study entails a histogram analysis incorporating thousands of EPSI voxels segmented within and around the enhancing lesions of a cohort of GBM patients whose lesions have previously been characterized through immunohistochemistry or clinical assessment. This high-resolution technique, paired with a large cohort of patients has yielded wealth of data which may potentially identify useful biomarkers for future prospective analyses of these lesions through spectroscopic imaging.Materials & Methods
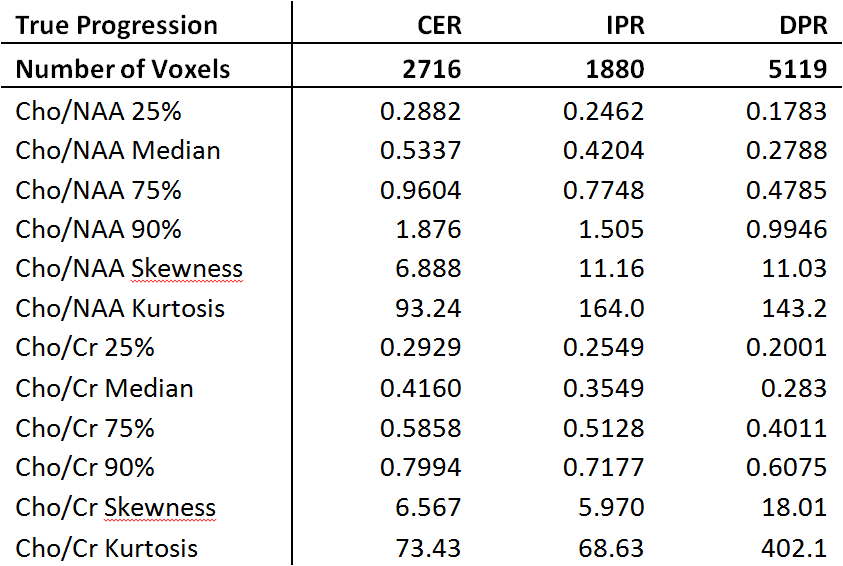
Study participants were recruited from a cohort of patients showing enhancing lesions under clinical 3T MRI following standard-of-care treatment for GBM. Twenty-seven subjects (14 male, 13 female, age 64.2±9.84) presenting these enhancing lesions were scanned prior to biopsy with the EPSI sequence using a Siemens 3T Tim-Trio MRI scanner. Scan parameters for the EPSI sequence included: TE/TR=17.6/1550ms, 280x280mm field-of-view (FOV), 18 slices covering 180mm total thickness, interpolated to 32 slices, 512 complex points with 616 Hz bandwidth and 15 minutes scan time. Data were post-processed using the Metabolic Imaging and Data Analysis System (MIDAS), which interpolated the acquired 50x50x18 resolution to a final resolution of 64x64x32 and a final nominal voxel size of 0.108 ml. Contrast-enhanced T1-weighted (TE/TR=3.11/1760ms, 250x250mm FOV, 256x256 resolution, 192 slices of 1mm) and T2-weighted fluid-attenuated inversion recovery (FLAIR) (TE/TR=141/9420ms, 240x240mm FOV, 256x256 resolution, 60 slices of 3mm) anatomical imaging were acquired for tumor localization and segmentation. Custom IDL and Matlab scripts were used to perform quantification following co-registration of the EPSI-generated metabolic maps with T1-weighted contrast enhanced and imaging studies. Co-registered metabolic maps were segmented into three categories: contrast-enhancing region (CER) including voxels entirely within the contrast enhancement under T1-imaging, immediate peritumoral region (IPR) including voxels with partial enhancement or immediately adjacent to contrast-enhancing voxels and distant peritumoral region (DPR) including all remaining voxels within the edema as observed through T2-FLAIR. Determination of TP vs. PsP was made through immunohistochemical analysis or clinical follow-up.Results
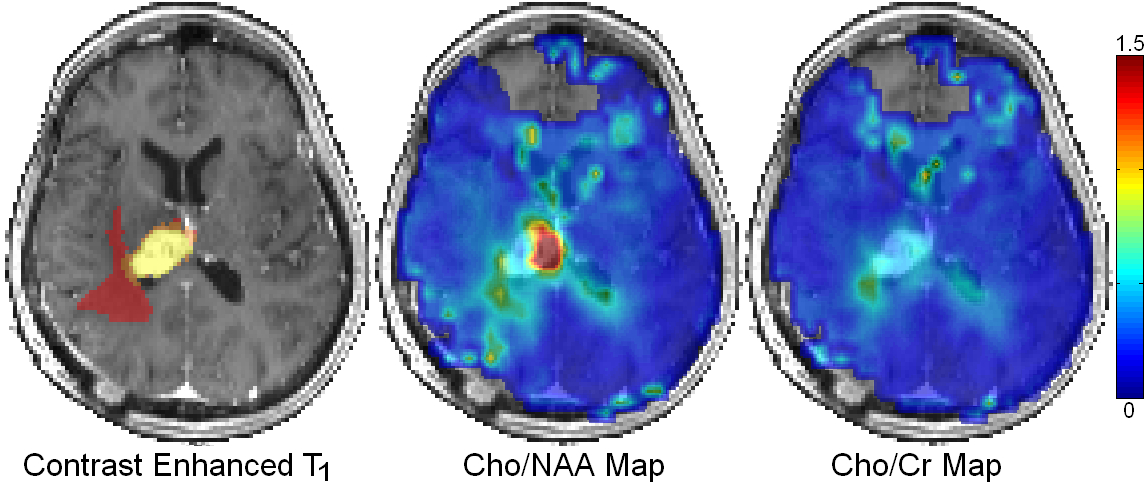
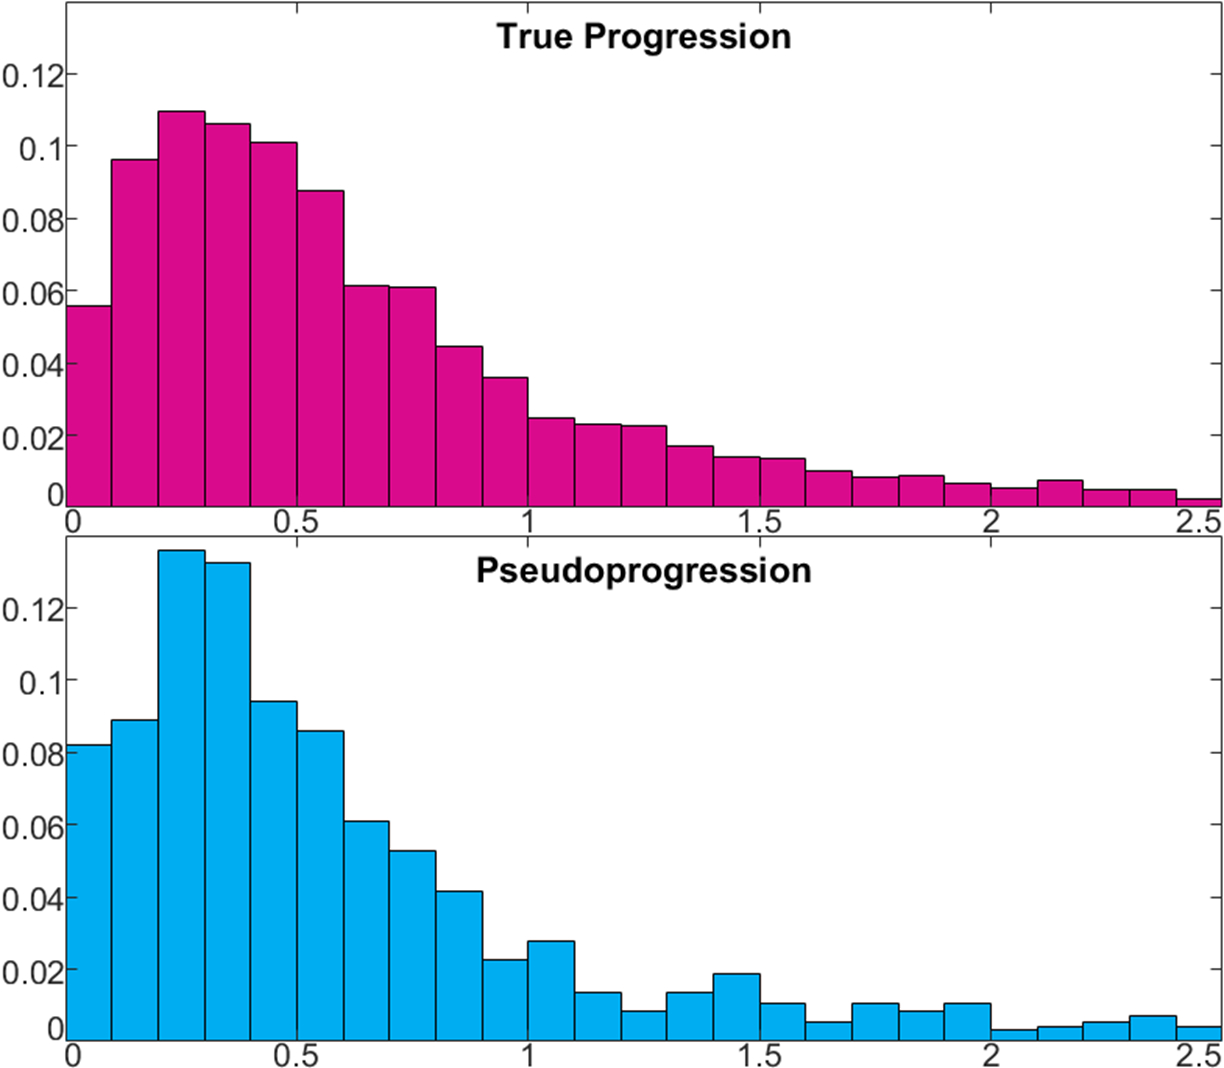
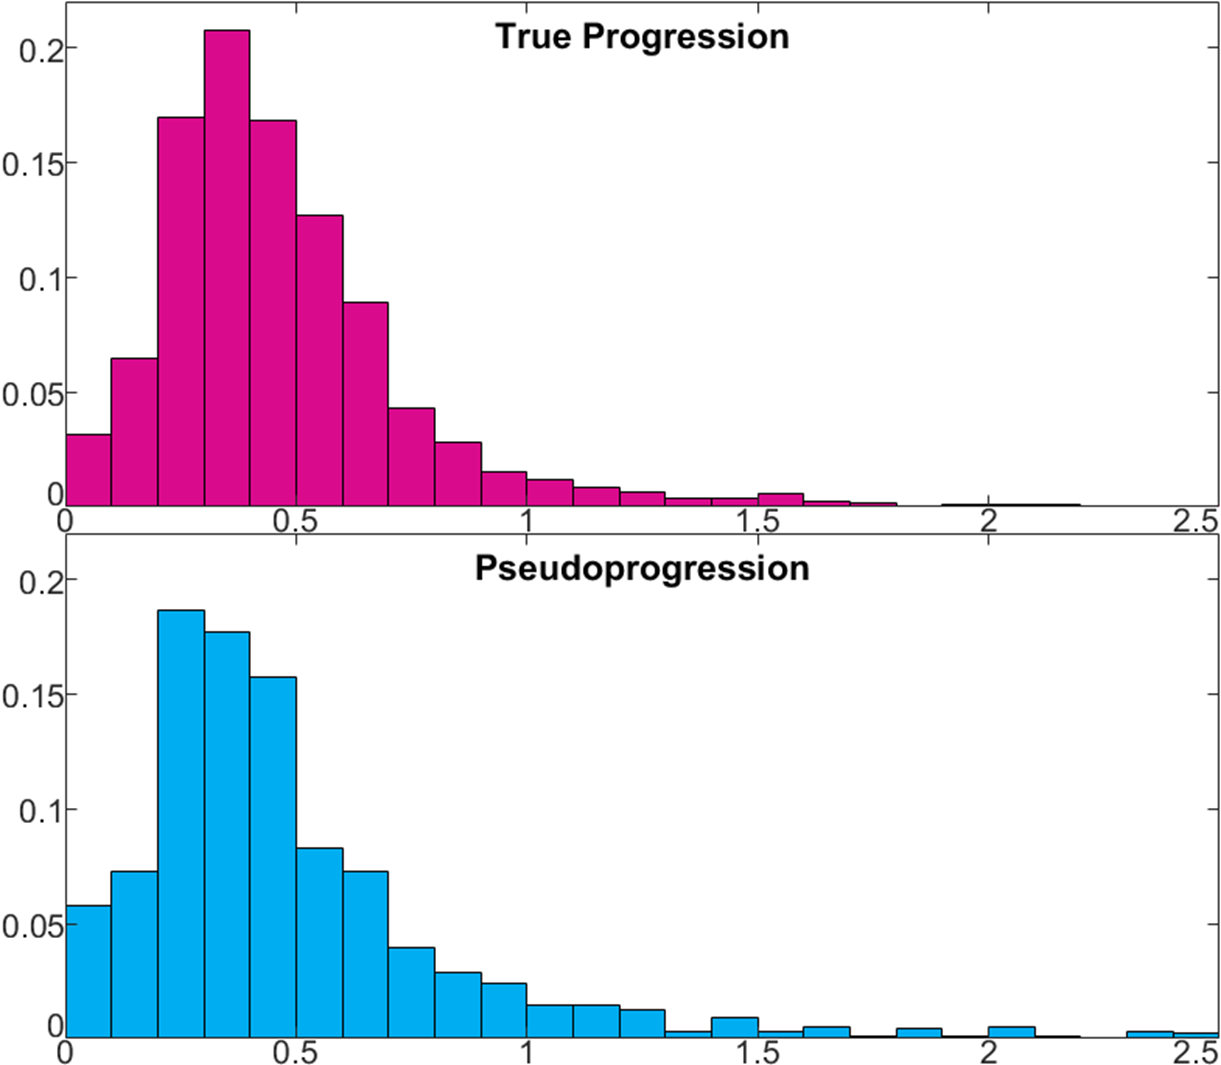
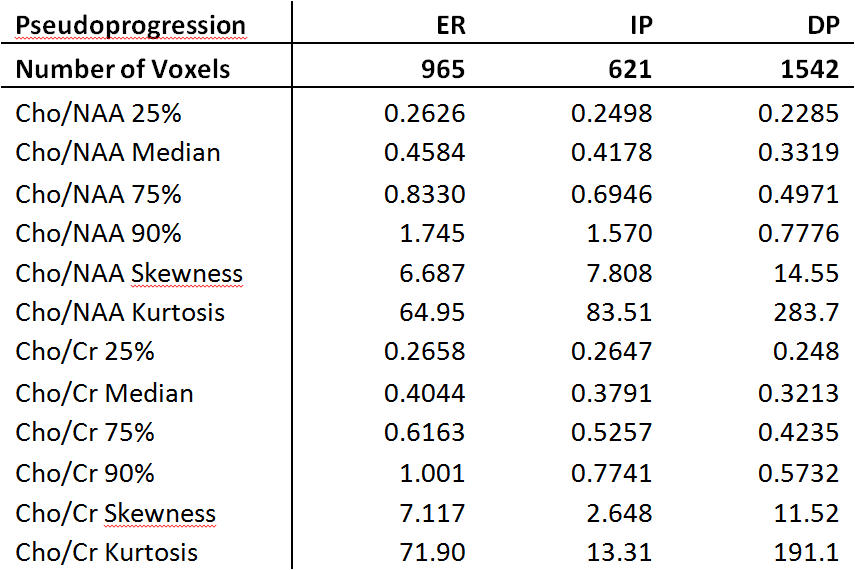
Figure 1 shows representative tumor segmentation and Cho/NAA, Cho/Cr maps from a TP patient. Voxels within the enhancing region in TP subjects showed greater median Cho/NAA compared to PsP cases (0.534 ± 1.42 vs. 0.458 ± 1.30), and normalized histograms of Cho/NAA (Figure 2) higher kurtosis among the TP cases (93.2 vs. 64.9). An analogous analysis of Cho/Cr ratio in enhancing region (Figure 3) shows kurtosis of 73.4 among TP cases vs. 71.9 for PsP and skewness of 6.6 among TP vs. 7.1 for PsP. Median Cho/Cr in enhancing region was 0.416 ± 0.431 in TP and 0.404 ± 0.806 in PsP. Tables 1 show statistical measures including quartiles, 90th percentile, skewness and kurtosis for each of the segmented regions in true progression patients, and table 2 shows the same measures in subjects with PsP. Mann-Whitney U-test showed significant difference in Cho/NAA ratio in the enhancing region of TP vs. PsP with p=0.00014, but not in the Cho/Cr ratio (p=0.35).Discussion
TP subjects showed a greater degree of kurtosis in the distribution of Cho/NAA but not of Cho/Cr, and likewise significantly higher Cho/NAA was observed the enhancing region of TP subjects, though not significantly higher Cho/Cr. These results suggest a loss in NAA – a marker for neuronal loss in GBM – maybe the driving factor in observed Cho/NAA increase. Though they were distinctly higher in the enhancing region, measured choline ratios in the immediate and distant peritumoral regions also showed elevation compared to contralateral healthy tissue, indicating the presence of abnormal metabolism several centimeters away from the enhancing lesion. By taking advantage of this high-resolution technique to characterize these heterogeneous lesions, EPSI may improve treatment outcomes both by accelerating surgical intervention when appropriate and assessing metabolism in peritumoral regions to potentially reduce surgical margins.Acknowledgements
Acknowledgements: The authors would like to acknowledge funding from NIH grants 1R21CA170284 (HP) and R01 CA202911-01A1 (PB).References
1. Topkan E, Topuk S, Oymak E, Parlak C, Pehlivan B. Pseudoprogression in patients with glioblastoma multiforme after concurrent radiotherapy and temozolomide. American journal of clinical oncology. 2012;35(3):284-9.
2. Fink J, Born D, Chamberlain MC. Pseudoprogression: relevance with respect to treatment of high-grade gliomas. Curr Treat Options Oncol. 2011;12(3):240-52.
3. Da Cruz LH, Rodriguez I, Domingues R, Gasparetto E, Sorensen A. Pseudoprogression and pseudoresponse: imaging challenges in the assessment of posttreatment glioma. American Journal of Neuroradiology. 2011;32(11):1978-85.
4. Wang S, Martinez-Lage M, Sakai Y, Chawla S, Kim S, Alonso-Basanta M, et al. Differentiating tumor progression from pseudoprogression in patients with glioblastomas using diffusion tensor imaging and dynamic susceptibility contrast MRI. American Journal of Neuroradiology. 2016;37(1):28-36.
5. Ebel A, Soher BJ, Maudsley AA. Assessment of 3D proton MR echo‐planar spectroscopic imaging using automated spectral analysis. Magnetic resonance in medicine. 2001;46(6):1072-8.
6. Cordova JS, Shu H-KG, Liang Z, Gurbani SS, Cooper LA, Holder CA, et al. Whole-brain spectroscopic MRI biomarkers identify infiltrating margins in glioblastoma patients. Neuro-oncology. 2016;18(8):1180-9.
7. Maudsley AA, Darkazanli A, Alger JR, Hall LO, Schuff N, Studholme C, et al. Comprehensive processing, display and analysis for in vivo MR spectroscopic imaging. NMR Biomed. 2006;19(4):492-503. 8. Parra NA, Maudsley AA, Gupta RK, Ishkanian F, Huang K, Walker GR, et al. Volumetric spectroscopic imaging of glioblastoma multiforme radiation treatment volumes. International Journal of Radiation Oncology* Biology* Physics. 2014;90(2):376-84.
Figures