3859
A 3 Minute Clinical Protocol for Quantitative High-Speed MR Spectroscopic Imaging in Patients with Brain Tumors1Neurology, University of New Mexico, Albuquerque, NM, United States, 2Neurosurgery, University of New Mexico, Albuquerque, NM, United States, 3Neurology, Physics and Astronomy, University of New Mexico, Albuquerque, NM, United States
Synopsis
We develop a quantitative 3-minute 3D short echo-time (TE) proton-echo-planar-spectroscopic-imaging (PEPSI) protocol. The short scan time is made possible by using partial brain coverage that encompasses the tumor and integration of the water reference (WR) scan into the water suppression module, which enables short repetition time. The method was validated in 5 healthy controls and applied to mapping tumor margins and infiltration in 3 patients with brain tumors. Slab-averaged metabolite/water ratios varied by less than 10% between healthy controls and metabolite concentration values after partial volume and relaxation correction were in the range of our previous study.
Introduction
Studies have demonstrated the potential of MR spectroscopic imaging (MRSI) for identifying tumor infiltrating regions beyond the margins seen in clinical MRI and guiding the extent of resection to improve the clinical outcome of glioma surgery1-6. Studies using conventional phase encoding were limited to 2D spatial acquisition. High-speed MRSI methods using echo-planar and spiral encoding provide 3D volume coverage with scan times on the order of 10 minutes. Shorter scan times are desirable for integration into routine clinical imaging protocols. In this study, we develop a quantitative 3-minute 3D short echo-time (TE) proton-echo-planar-spectroscopic-imaging (PEPSI) protocol. The short scan time is made possible by using partial brain coverage that encompasses the tumor and integration of the water reference (WR) scan into the water suppression module, which enables short repetition time. The method was validated in healthy controls and applied to mapping tumor margins and infiltration in patients with brain tumors.Methods
Five healthy adults (4F,1M), 3 patients with brain tumors (2F,1M) were scanned on 3T scanner with 32-channel head array coil. Institutionally approved informed consent was obtained. The 3D PEPSI pulse sequence7-9 used semi-LASER double spin-echo (TR/TE:1250/36ms) or conventional spin-echo (TR/TE:1250/15ms) prelocalization of a 40mm slab. The water signal, which is typically suppressed in proton MR spectroscopy, was acquired immediately after the first water suppression RF-pulse using an echo-planar spatial-spectral encoding readout-gradient module with 60ms duration followed by gradient-dephasing. A spatial-spectral binomial slab-selective RF-pulse (monopolar, 10 RF-pulses) was used for water excitation. Acquisition parameters – ky-kz-elliptical sampling matrix: 32x32x8x1024, voxel-size: 7x7x7mm3, spectral-width: 1087Hz, 8- or 10-slice outer volume suppression, single-average, scan time: 2:56min. 2D-PEPSI scan with spectral editing was additionally acquired in one of the patients (TR/TE: 2000/75ms, voxel-size: 2x2x3cm3, scan-time: 4:24min) to investigate mapping of 2-hydroxyglutarate (2HG)10,11. Data were reconstructed online as described previously9. WR data were zero-filled to 1024 data points. Spectral quantification in reference to WR was performed using LCModel12. Water reference data were fitted separately using a singlet basis set that was truncated to match the line-shape of the water peak. Partial volume and relaxation corrections were performed in one control, using literature T1 and T2-values9.Results
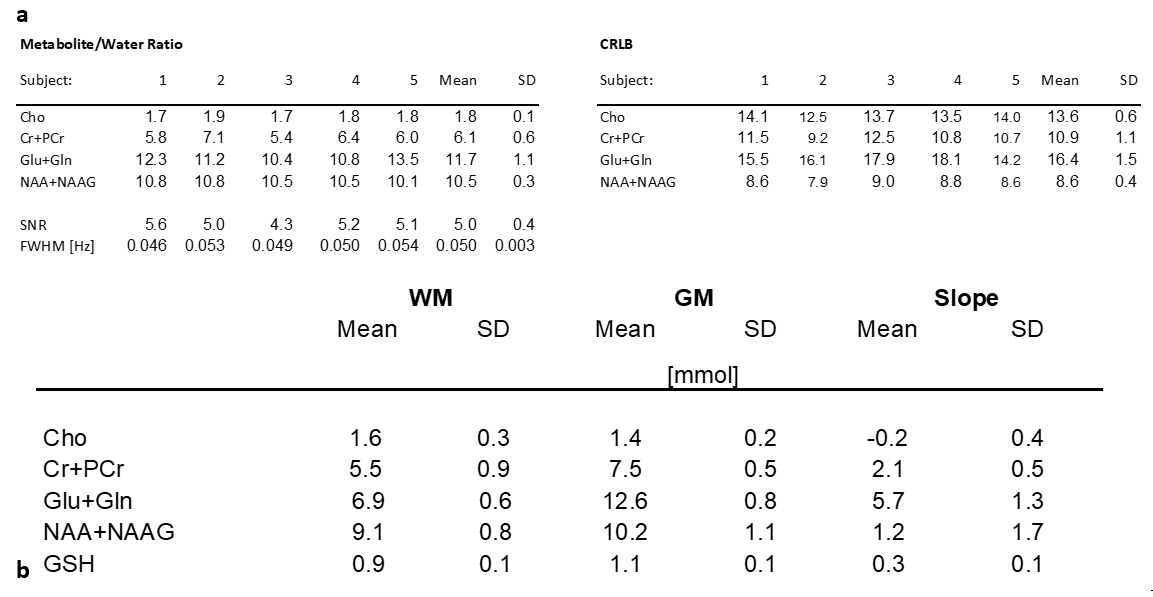
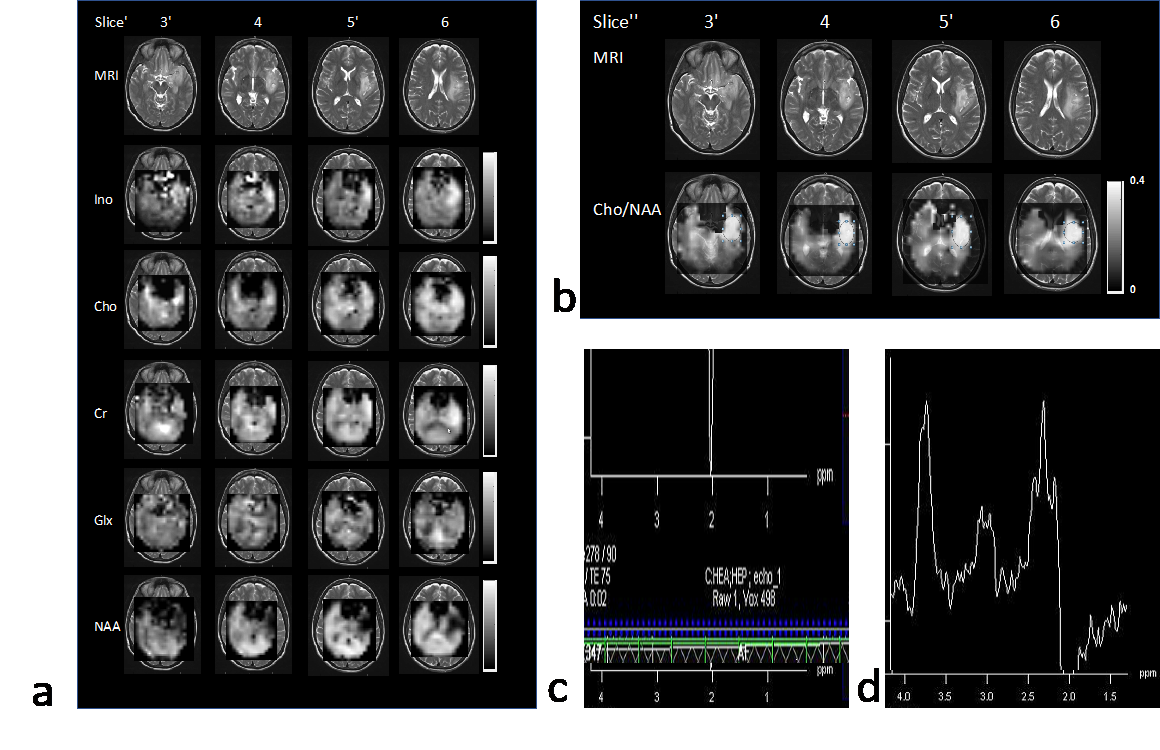
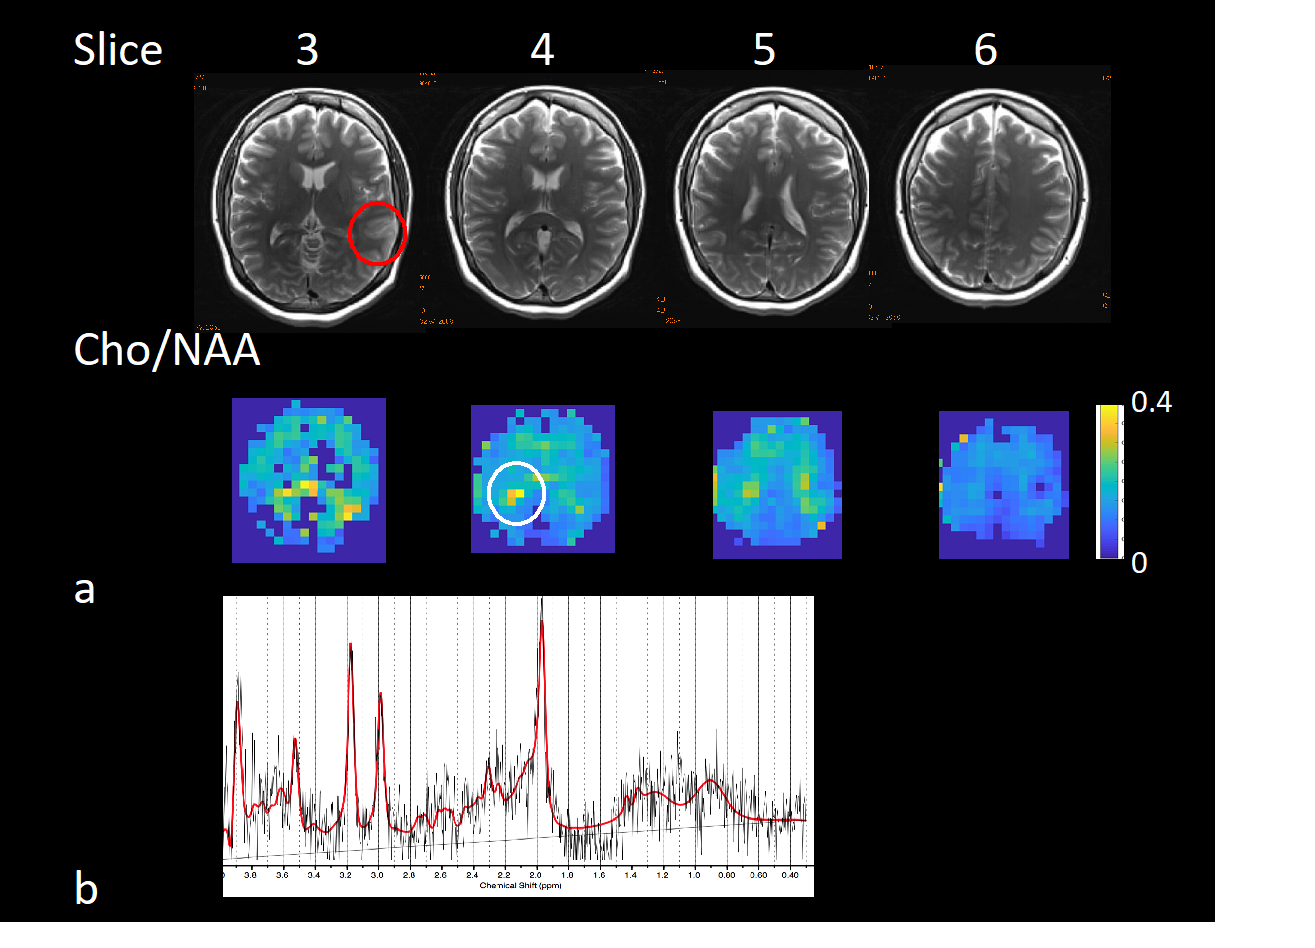
Method validation in controls showed that the integration of WR-acquisition had negligible impact on spectral quality, SNR and water suppression efficiency. Slightly increased leakage from peripheral lipids was observed in oblique compared with axial slab orientation. Metabolite concentration values after partial volume and relaxation correction were in the range of our previous study9 (Figure 1). Metabolite/water maps in a patient with a low-grade glioma display decreased NAA and elevated inositol in the tumor, whereas choline and creatine levels were almost isointense with the contralateral side (Figure 2). The edited scan showed no elevation of 2HG. In the second patient with a low-grade glioma in left temporal lobe (Figure 3), spectral quality in the tumor was degraded due to susceptibility inhomogeneity. However, elevated choline was measured in contralateral normal appearing WM close to the ventricles, which may reflect inflammation. In the third patient with high-grade glioma (Figure 4), elevated choline/NAA was measured along medial GM extending into contralateral WM beyond T1 and T2 abnormalities seen on clinical MRI, suggesting possible tumor infiltration. Strongly elevated lipid resonances were measured in the necrotic core of the tumor.Discussion
This short (3 minutes) high spatial resolution (0.3 cc) 3D MRSI protocol provides sufficient sensitivity for mapping changes in major singlet resonance levels on the order of 10-20%, which enables delineation of metabolic tumor margins and infiltration. Cho/NAA ratio images were the most sensitive biomarker for detecting tumor related metabolic abnormality. Metabolite/water images provided additional information for quantifying increases in Cho and/or decreases in NAA. Although partial brain coverage, which was tailored to the tumor location and extent, improves uniformity of shimming compared with whole brain shimming, susceptibility related line broadening in inferior temporal lobe remains a limitation. Further limitations of this approach include partial saturation of cortical regions due to the small number of suppression slices, residual lipid bleeding in the vicinity of the suppression slices, and the need for T1 saturation correction due to short TR, which may bias metabolite quantification in edematous regions of brain tumors.Conclusions
The short scan time of this quantitative 3D high-speed short TE MRSI approach facilitates integration into clinical presurgical imaging protocols. Studies in patients with brain tumors are in progress to further characterize sensitivity constraints for mapping tumor margins and infiltration and to assess the clinical utility of this approach for presurgical mapping.Acknowledgements
This research was in part supported by 1R21EB011606-01 and 1R01DA14178-01. We gratefully acknowledge the support of Elena Ackley, Akram Etemadi Amin, Catherine Smith, Diana South, Kishore Vakamudi, and Akio Yoshimoto.References
[1] J. Guo, C. Yao, H. Chen, D. Zhuang, W. Tang, G. Ren, Y. Wang, J. Wu, F. Huang, and L. Zhou, "The relationship between Cho/NAA and glioma metabolism: implementation for margin delineation of cerebral gliomas," Acta Neurochir (Wien), vol. 154, pp. 1361-1370; discussion 1370, Aug 2012, 3407558.
[2] N. A. Parra, A. A. Maudsley, R. K. Gupta, F. Ishkanian, K. Huang, G. R. Walker, K. Padgett, B. Roy, J. Panoff, A. Markoe, and R. Stoyanova, "Volumetric spectroscopic imaging of glioblastoma multiforme radiation treatment volumes," Int J Radiat Oncol Biol Phys, vol. 90, pp. 376-384, Oct 1 2014.
[3] B. Roy, R. K. Gupta, A. A. Maudsley, R. Awasthi, S. Sheriff, M. Gu, N. Husain, S. Mohakud, S. Behari, C. M. Pandey, R. K. Rathore, D. M. Spielman, and J. R. Alger, "Utility of multiparametric 3-T MRI for glioma characterization," Neuroradiology, vol. 55, pp. 603-613, May 2013.
[4] A. A. Maudsley, B. Roy, R. K. Gupta, S. Sheriff, R. Awasthi, M. Gu, N. Husain, S. Mohakud, S. Behari, and D. M. Spielman, "Association of metabolite concentrations and water diffusivity in normal appearing brain tissue with glioma grade," J Neuroimaging, vol. 24, pp. 585-589, Nov 2014.
[5] J. P. Wijnen, A. J. Idema, M. Stawicki, M. W. Lagemaat, P. Wesseling, A. J. Wright, T. W. Scheenen, and A. Heerschap, "Quantitative short echo time 1H MRSI of the peripheral edematous region of human brain tumors in the differentiation between glioblastoma, metastasis, and meningioma," J Magn Reson Imaging, vol. 36, pp. 1072-1082, Nov 2012.
[6] J. S. Cordova, H. K. Shu, Z. Liang, S. S. Gurbani, L. A. Cooper, C. A. Holder, J. J. Olson, B. Kairdolf, E. Schreibmann, S. G. Neill, C. G. Hadjipanayis, and H. Shim, "Whole-brain spectroscopic MRI biomarkers identify infiltrating margins in glioblastoma patients," Neuro Oncol, vol. 18, pp. 1180-1189, Aug 2016, PMC4933486.
[7] S. Posse, C. DeCarli, and D. Le Bihan, "Three-dimensional echo-planar MR spectroscopic imaging at short echo times in the human brain," Radiology, vol. 192, pp. 733-738, Sep 1994.
[8] S. Posse, G. Tedeschi, R. Risinger, R. Ogg, and D. Lebihan, "High-Speed H-1 Spectroscopic Imaging in Human Brain by Echo-Planar Spatial-Spectral Encoding," Magnetic Resonance in Medicine, vol. 33, pp. 34-40, Jan 1995.
[9] S. Posse, R. Otazo, A. Caprihan, J. Bustillo, H. Chen, P. G. Henry, M. Marjanska, C. Gasparovic, C. Zuo, V. Magnotta, B. Mueller, P. Mullins, P. Renshaw, K. Ugurbil, K. O. Lim, and J. R. Alger, "Proton echo-planar spectroscopic imaging of J-coupled resonances in human brain at 3 and 4 Tesla," Magn Reson Med, vol. 58, pp. 236-244, Aug 2007.
[10] O. C. Andronesi, G. S. Kim, E. Gerstner, T. Batchelor, A. A. Tzika, V. R. Fantin, M. G. Vander Heiden, and A. G. Sorensen, "Detection of 2-hydroxyglutarate in IDH-mutated glioma patients by in vivo spectral-editing and 2D correlation magnetic resonance spectroscopy," Sci Transl Med, vol. 4, p. 116ra114, Jan 11 2012, 3720836.
[11] C. Choi, S. K. Ganji, R. J. DeBerardinis, K. J. Hatanpaa, D. Rakheja, Z. Kovacs, X. L. Yang, T. Mashimo, J. M. Raisanen, I. Marin-Valencia, J. M. Pascual, C. J. Madden, B. E. Mickey, C. R. Malloy, R. M. Bachoo, and E. A. Maher, "2-hydroxyglutarate detection by magnetic resonance spectroscopy in IDH-mutated patients with gliomas," Nat Med, vol. 18, pp. 624-629, Apr 2012, 3615719.
[12] S. W. Provencher, "Estimation of Metabolite Concentrations from Localized in-Vivo Proton Nmr-Spectra," Magnetic Resonance in Medicine, vol. 30, pp. 672-679, Dec 1993.
Figures