3858
Quantification and Assessment of T2 Relaxation Times of Human Bile Components with In Vivo MR Spectroscopy at 7T1Center for Biomedical Imaging, Department of Radiology, New York University School of Medicine, New York City, NY, United States, 2Division of Endocrinology and Metabolism, Department of Internal Medicine III, Medical University of Vienna, Vienna, Austria, 3Faculty of Healthcare, University of Prešov, Prešov, Slovakia, 4Department of Radiology, General Hospital of Levoča, Levoča, Slovakia, 5High-field MR Centre, Department of Biomedical Imaging and Image-guided Therapy, Medical University of Vienna, Vienna, Austria, 6Division of Gastroenterology and Hepatology, Department of Internal Medicine III, Medical University of Vienna, Vienna, Austria, 7Christian Doppler Laboratory for Clinical Molecular MR Imaging, Vienna, Austria
Synopsis
In vivo measurements of concentrations of bile components are of high interest for understanding and diagnosis of cholestatic diseases. We measured human bile in the gallbladder in vivo using single-voxel 1H-MR spectroscopy at 7T and assessed T2 relaxation times of water and eight bile components in healthy volunteers. With precise T2 correction, all eight bile components could be quantified with ultra-short TE sequence and four with long TE sequence.
Introduction
The bile mainly consists of water, lipids, cholesterol, and bile salts. In vivo measurements of concentrations of major bile components, glycine-conjugated bile acids (GCBA:3.74ppm), taurine-conjugated bile acids (TCBA:3.08ppm), total bile acids (TBA) and choline-containing phospholipids (Chol-PL:3.22ppm), are of high interest for understanding and diagnosis of cholestatic diseases1. These metabolites and several other proton-groups (amide proton at 8.00ppm, methylene (CH2-PL) at 1.26ppm and methyls at 1.00, 0.88 and 0.66ppm (CH3-TBA)) can be observed in 1H-MR spectrum of bile in vivo2.
Several studies already shown potential of in vivo gallbladder 1H-MR spectroscopy (MRS) in animals3 and humans2,4,5. In vitro studies showed that bile components have relatively long T2 relaxation times2 which allows for use longer echo time (TE) sequences for signal separation. Nonetheless, there is to our knowledge no report on T2 relaxation times of human bile components in vivo, which are necessary for correct quantification of signals measured with any given TE.
The human in vivo studies up to date were performed on clinical magnetic field strengths of 1.5 and 3T. In general, ultra-high magnetic field strength of 7T allows higher spectral resolution and SNR for the price of shorter T2s. Employing surface coils at 7T is challenging especially for an intricate B1 inhomogeneity6 and motion artifacts. The B1 field, for example, does not allow for fine-tuning of outer volume suppression slabs distant from the coil. Breath-holds can reduce breathing artifacts but usually for the price of patient discomfort and longer acquisition times. Due to the both effects, it is difficult to employ water suppression as well.
We aimed to measure human bile composition in the gallbladder in vivo with single-voxel 1H-MRS during normal breathing and without any signal suppression at 7T and to assess the T2 relaxation times of bile components for quantification.
Methods
MRS experiments were performed on six healthy volunteers (age 33±5years, BMI 22±1kg.m-2, 3m/3f) using 7T MR system (Siemens, Germany) with 1H/31P surface coil (1H double-loop:14x23cm, Rapid Biomedical, Germany). Volunteers were measured after overnight fasting in supine position. Single-voxel MRS was performed with modified STEAM sequence7 with voxel individually adjusted in range from 1 to 8cm3. Sequence parameters: TR=5s, TEs in range from 6 to 200ms, with two frequency offsets: 0.0ppm for acquisition of water and adjacent signals and -3.4ppm for methylene and methyl protons, 8 spectral transient signals per TE and offset, all signals were saved separately.
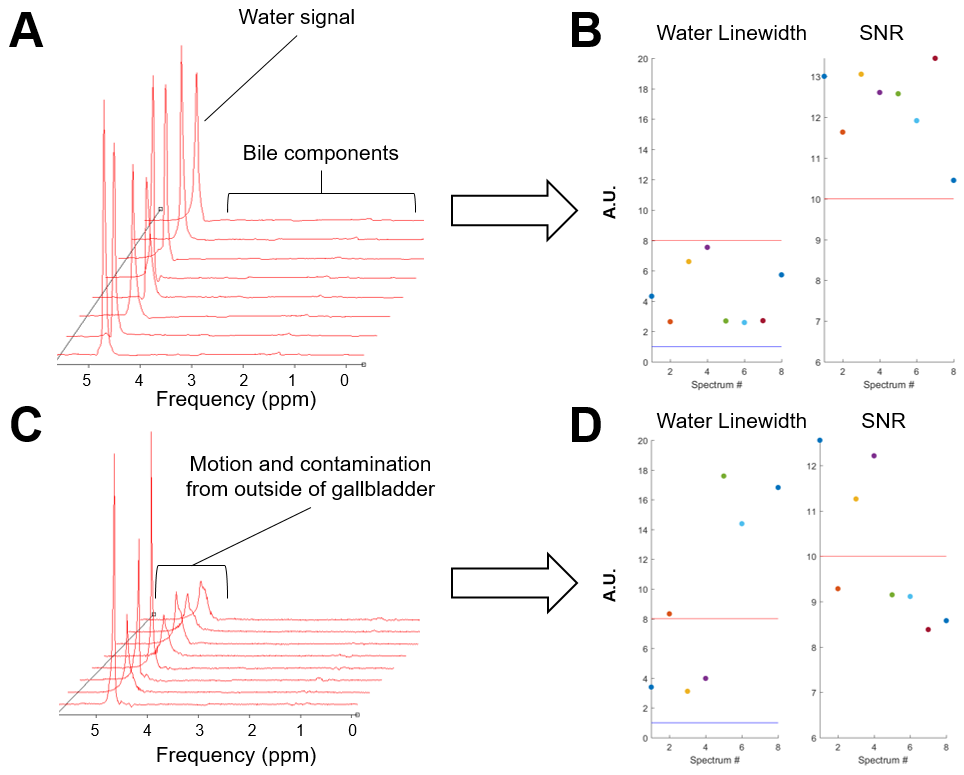
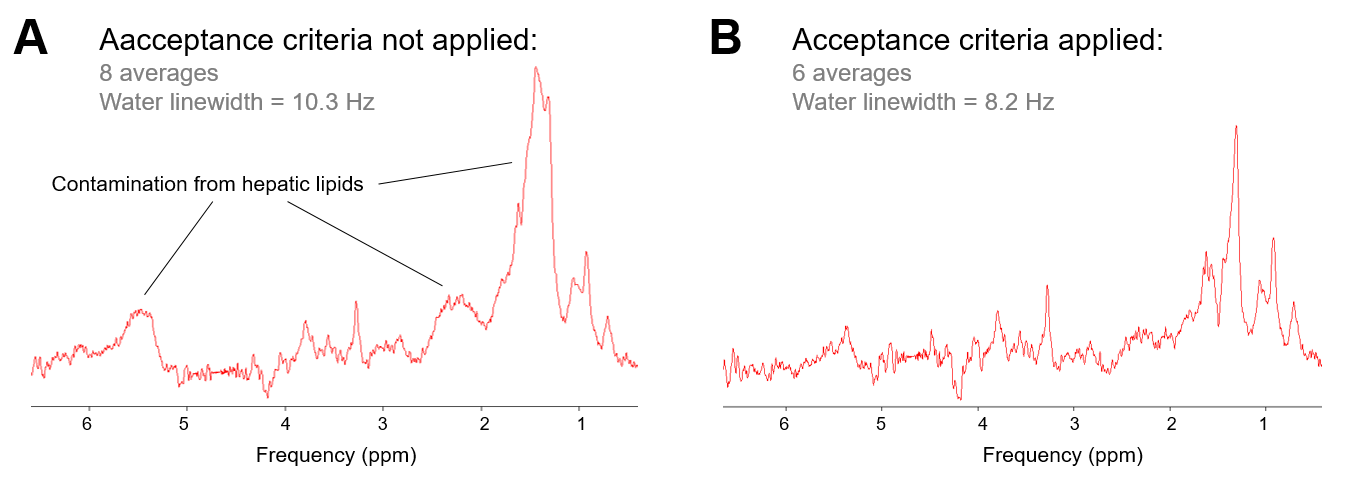
Signals were processed with acceptance criteria (water linewidth<16Hz, SNR>10) with in-house software in MATLAB (MathWorks, USA), then averaged and fitted in jMRUI with AMARES8. The coefficient of determination (R2) was used as indicator of the quality for the T2 mono-exponential fitting. Prior spectral fitting of bile components, water was removed with HL-SVD method9. Prior knowledge for peaks assignment and concentrations were calculated according to previous study2.
Results
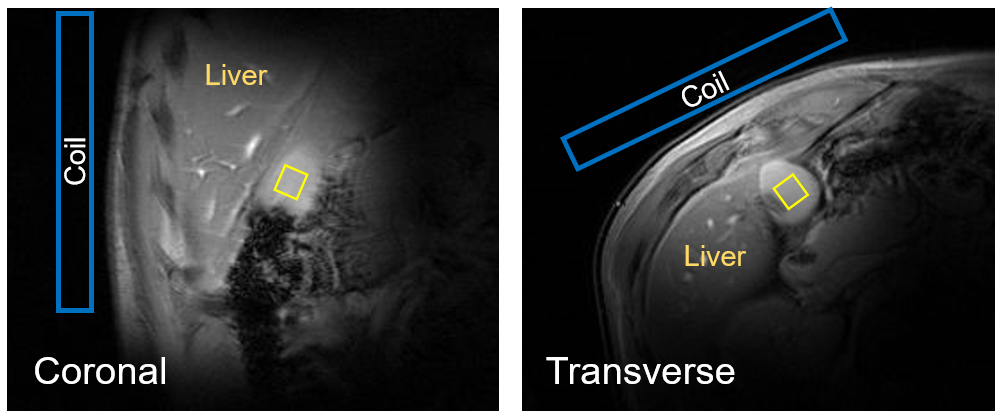
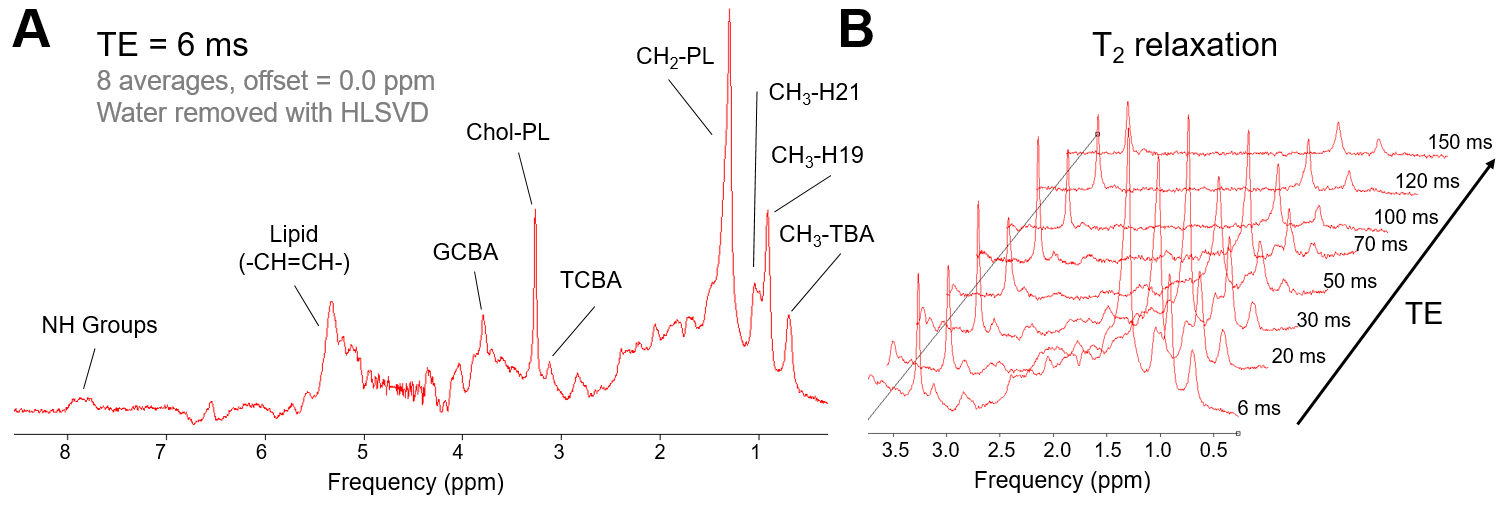
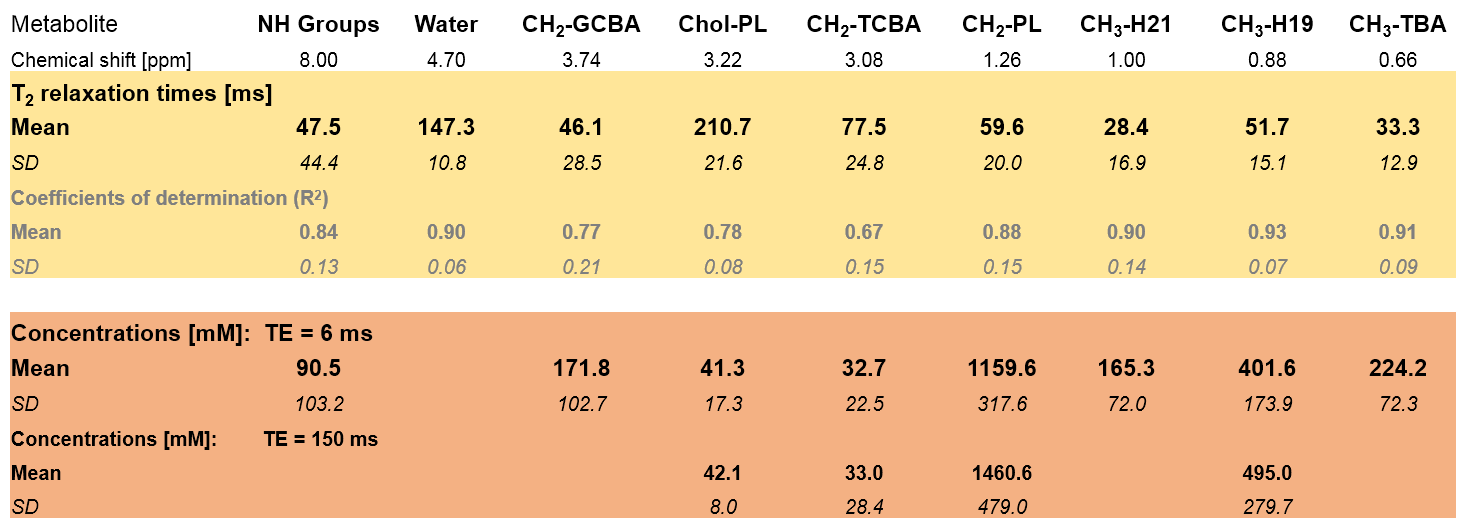
The scout images and typical voxel placement are depicted on Fig.1. Effects of motion and signal mislocalization are illustrated in Fig.2. Signals from liver with broader signals were automatically excluded from further processing (Fig.3). Mean number of accepted signals per TE, offset and volunteer was 5±2, mean water linewidth after post-processing was 13±4Hz (TE=6ms). Example of bile spectrum measured with TE=6ms is depicted in Fig.4A. Signals measured with ultra-short TE and adjacent to the water could be affected by water sidebands (2.7 and 6.7ppm) and imperfect offline water suppression. As visible from the Fig.3B and 4A, SNR could vary, however high spectral resolution was maintained. T2 relaxation times were relatively longer for Chol-PL, TCBA, CH2-PL and CH3-H19 (Fig.4B), what allowed for their quantification with TE=150ms. Calculated T2s, T2-fit quality and concentrations from spectra measured with TE=6ms and 150ms are summarized in Table.Discussion
Measurements without breath-holds were very well tolerated by all volunteers. Location and size of the gallbladder varied in every individual. The software discarded several signals in post-processing, however we could still achieve sufficient SNR, what is demonstrated by relatively high R2>0.75 for fitting of spin-spin relaxation behavior for all components except for TCBA. Concentrations of measured bile components such as Chol-PL and TCBA were in agreement with previous study2: Chol-PL 48±21 and TCBA 33±23mM, however for several other metabolites we have found higher concentrations as reported previously: GCBA 3.4x, NH groups 2x and CH3-TBA 1.9x higher.Conclusion
Although in vivo 1H-MRS of gallbladder is extremely challenging, we presented feasible MRS protocol at 7T which delivered spectra of excellent resolution and quality in less than 2min. Measured T2 relaxation times showed not only credibility of the signal localization and processing but also allowed for precise quantification of several bile components with longer TE.
Acknowledgements
The authors thank Sami Auno, Esau Rodriguez Poblador (Medical University of Vienna, Vienna, Austria) and Michal Jablonski (Institute of Scientific Instruments, Brno, Czech Republic) for help with the software for data processing.References
1. Ijare OB, Bezabeh T, Albiin N, Bergquist A, Arnelo U, Lindberg B, Smith ICP. Simultaneous quantification of glycine- and taurine-conjugated bile acids, total bile acids, and choline-containing phospholipids in human bile using 1H NMR spectroscopy. J. Pharm. Biomed. Anal. [Internet] 2010;53:667–673.
2. Mohajeri S, Ijare OB, Bezabeh T, King SB, Thomas MA, Minuk G, Lipschitz J, Kirkpatrick I, Smith M, Smith ICP. In vivo 1H MRS of human gallbladder bile at 3 T in one and two dimensions: detection and quantification of major biliary lipids. NMR Biomed. [Internet] 2014;27:1192–202.
3. Künnecke B, Bruns A, von Kienlin M. Non-invasive analysis of gallbladder bile composition in cynomolgus monkeys using in vivo 1H magnetic resonance spectroscopy. Biochim. Biophys. Acta [Internet] 2007;1771:544–9.
4. Prescot AP, Collins DJ, Leach MO, Dzik-Jurasz ASK. Human gallbladder bile: noninvasive investigation in vivo with single-voxel 1H MR spectroscopy. Radiology 2003;229:587–592.
5. Dzik-Jurasz a. SK, Prescot a. P, Leach MO, Collins DJ. Non-invasive study of human gall bladder bile in vivo using 1H-MR spectroscopy. Br. J. Radiol. 2003;76:483–486.
6. Vaidya M V., Collins CM, Sodickson DK, Brown R, Wiggins GC, Lattanzi R. Dependence of B1− and B1+ field patterns of surface coils on the electrical properties of the sample and the MR operating frequency. Concepts Magn. Reson. Part B Magn. Reson. Eng. [Internet] 2016;46:25–40.
7. Gajdošík M, Chadzynski GL, Hangel G, et al. Ultrashort-TE stimulated echo acquisition mode (STEAM) improves the quantification of lipids and fatty acid chain unsaturation in the human liver at 7 T. NMR Biomed. [Internet] 2015;28:1283–1293.
8. Stefan D, Cesare F Di, Andrasescu A, et al. Quantitation of magnetic resonance spectroscopy signals: the jMRUI software package. Meas. Sci. Technol. [Internet] 2009;20:104035.
9. de Beer R, van den Boogaart A, van Ormondt D, Pijnappel WW, den Hollander J a, Marien a J, Luyten PR. Application of time-domain fitting in the quantification of in vivo 1H spectroscopic imaging data sets. NMR Biomed. [Internet] 1992;5:171–8.
Figures