3857
Evaluation of accuracy and reproducibility of 1H MRS measurements of lactate at 7 T1Center for Psychiatric Neuroscience, Lausanne University Hospital, Lausanne, Switzerland, 2Brain Mind Institute, École Polytechnique Fédérale de Lausanne, Lausanne, Switzerland, 3Animal imaging and technology core, Center for Biomedical Imaging, Lausanne, Switzerland
Synopsis
Lactate is known as an end-product of aerobic glycolysis, and it has been considered as a potential biomarker of metabolic abnormalities occurred in different cerebral pathological states. However, the 1H MRS detection of lactate is hampered by the presence of co-resonant lipid and macromolecule resonances. The aim of this study was to evaluate the performance of different 1H MRS protocols applied in semi-adiabatic spin-echo full-intensity acquired localized spectroscopy sequence, I) TE=16 ms, no inversion, II) TE=16 ms, TI= 300 ms, and III) TE=110 ms, no inversion in reliable detection of lactate in the brain using in vivo measurement and simulated spectra at different experimental condition. The in vivo measurement and simulation analysis suggests that short-TE 1H MRS approach without inversion pulse is likely to be a more reliable method for estimating the absolute concentration of lactate and other metabolites simultaneously from the human brain.
Purpose
Lactate, a metabolic product of glycolysis is known as an essential intermediate in the energy metabolism of organs with high-energy demands such as brain1-3 and as recently shown a signal for neuroplasticity and neuroprotection 4. Monitoring the brain lactate concentration in vivo using 1H MRS is useful for seeking biomarkers for the diagnosis and prognosis of brain metabolic abnormalities and pathological states 5-8. In vivo MRS detection of lactate is challenging because of its relatively low concentration in the brain and the large overlapping resonances from macromolecules and lipids.Short-TE MRS provides the highest sensitivity, but the quantification of lactate relies on deconvolution methods such as LCModel. Minimizing macromolecules using long TE or inversion recovery methods allows the observation of distinct lactate resonance but at the expense of SNR.The aim of this study was to provide an initial illustration of the ability of three non-editing 1H MRS techniques(short TE, long TE, and inversion recovery) at 7T for lactate measurements.
Methods
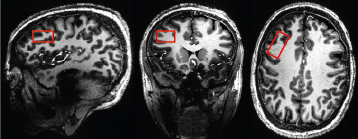
Five healthy volunteers provided informed consent were recruited for MRS measurement. All experiments were performed on a 7 T/68 cm MR scanner(Siemens Medical Solutions) with a commercial transmit-volume coil and 32-channel-receive array(Nova Medical Ins). Localized water suppressed 1H spectra were acquired from the VOI(30×15×15 mm3) placed in the dorsolateral prefrontal cortex(Fig 1) using three different acquisition protocols applied in semi-adiabatic spin-echo full-intensity acquired localized spectroscopy(SPECIAL) sequence. Bo field inhomogeneities were minimized over VOI by FAST(EST)MAP9, thus achieving water linewidth of 12±1 Hz. All acquisition parameters were kept same between different protocols(TR= 6.5 ms, average= 50×2) except echo time (TE) and inversion time (TI) which set as follow: I) TE=16 ms, no inversion; II) TE=16 ms, TI= 300 ms; and III) TE=110 ms, no inversion.
Furthermore, a Monte Carlo simulation was performed to explore the repeatability and accuracy of lactate estimates using the protocol I and II at different experimental conditions. All metabolites spectra were generated using in vivo concentrations and underwent double spin-echo sequence without and with adding inversion pulse for a range of spectral linewidths(3 ≤LW≤ 17) and signal-to-noise ratios(25 ≤SNR≤ 250). In given experimental conditions, 100 spectra were generated with different noise seeds and lactate concentrations ranging from 0.5 mM up to 4 mM. The in vivo and simulated spectra were analyzed using LC Model with basis sets generated for each protocol. To assess how closely the estimated concentration of lactate from LC Model output($$$C_{est}(i)$$$) matches its actual input concentration used in the simulation($$$C_{act}(i)$$$), called accuracy, the mean estimation error(%EE) was calculated using the following equation:
$${EE=}\frac{1}{N} \sum_{i=1}^N \frac{C_{est}(i)-C_{act}(i)}{C_{act}(i)}\times100$$.
To check how well the acquisition protocols will return the same value for lactate concentration at different experimental condition, the reproducibility error(RE) was determined by the following equation:
$${RE}=\frac{\frac{1}{N} \sum_{i=1}^N {({C_{est}(i)-C_{fit}(i)})}^2}{\frac{1}{N}{\sum_{i=1}^NC_{act}(i)}}\times100$$
where $$$C_{fit}(i)$$$ is the concentration calculated from the least-squares fit to the plot of $$$C_{est}(i)$$$ versus $$$C_{act}(i)$$$.
Results and discussion
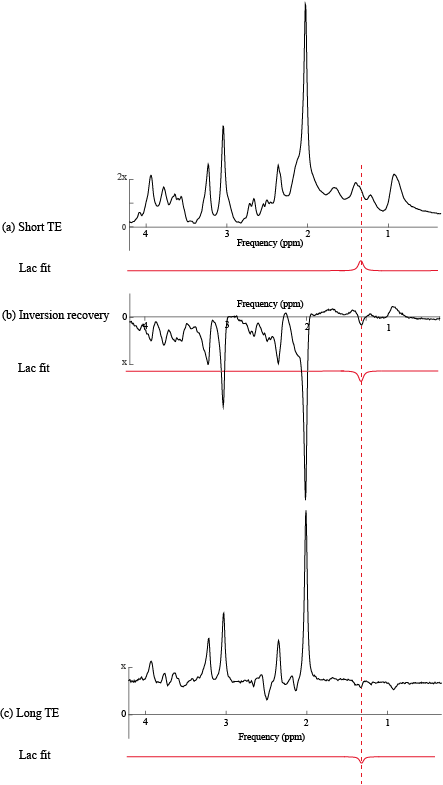
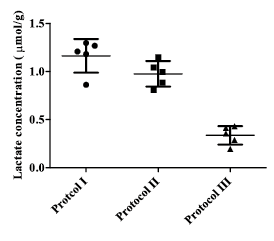
The achieved spectral quality(Fig. 2) allowed reliable quantification of numerous in vivo brain metabolites in each approach(15 to 17 metabolites) with CRLB below 20%. The lactate peak was quantified with CRLB below 8% using protocols I and II and 15% using protocol III. The SNR of the averaged spectrum(relative to NAA peak at 2.01 ppm) acquired using the protocol I is noticeably higher than protocols II and III(~1.5 times). The standard deviation of estimated in vivo lactate concentration (Fig 3) in the protocols I and II presents small dispersion in the distribution of lactate estimation compared with III(30%). Moreover, other metabolites such as glutamate, glutathione, γ-aminobutyric acid, and taurine were estimated with lower CRLB in protocols I and II compared with III. Therefore the reproducibility and accuracy of protocols I and II in the lactate measurement were assessed by simulating spectra at different experimental conditions.
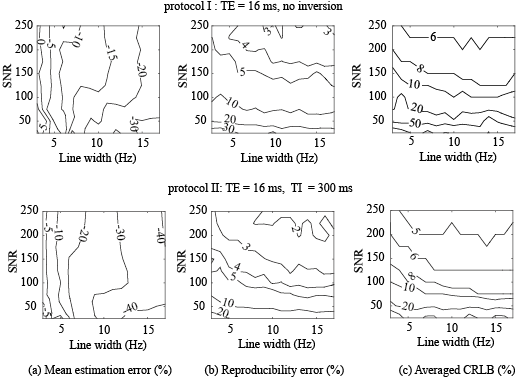
The analysis results of simulated spectra indicated that the lactate concentration at in vivo experimental conditions(LW~12 Hz, SNR~200) will be systematically underestimated by approximately 15 % using the protocol I and 30 % using the protocol II(Fig 4.a). Therefore, the accuracy of lactate measurement is two times higher when we used protocol I. Simulations results also showed that the reproducibility and CRLB in the lactate estimates are more sensitive to the SNR than line width in both protocols I and II(Fig 4.b and 4.c). Considering T1 relaxation of metabolites11 during inversion time and so losing SNR of spectra, the protocol I offers more reproducible lactate estimates than protocol II for the same number of averaged spectra. Therefore, we conclude that short-TE 1H MRS approach without inversion pulse is likely to be a more reliable method for estimating the absolute concentration of lactate and other metabolites simultaneously from the human brain.
Acknowledgements
No acknowledgement found.References
- Brooks, G.A., 2002. Lactate shuttles in nature. Biochem. Soc. Trans. 30, 258–264.
- Gladden, L.B., 2004. Lactate metabolism: a new paradigm for the third millennium. J. Physiol. 558, 5–30.
- Schurr, A., 2006. Lactate: the ultimate cerebral oxidative energy substrate? J. Int. Soc. Cereb. Blood Flow Metab. 26, 142–152.
- Magistretti, P.J., Allaman, I., 2015. A cellular perspective on brain energy metabolism and functional imaging. Neuron 86, 883–901.
- Ernst, J., Hock, A., Henning, A., Seifritz, E., Boeker, H., Grimm, S., 2017. Increased pregenual anterior cingulate glucose and lactate concentrations in major depressive disorder. Mol. Psychiatry 22, 113–119.
- Machado-Vieira, R., Zanetti, M.V., Otaduy, M.C., De Sousa, R.T., Soeiro-de-Souza, M.G., Costa, A.C., Carvalho, A.F., Leite, C.C., Busatto, G.F., Zarate, C.A., Gattaz, W.F., 2017. Increased brain lactate during depressive episodes and reversal effects by lithium monotherapy in rrug-naive bipolar disorder: A 3-T 1H-MRS study. J. Clin. Psychopharmacol. 37, 40–45.
- Rowland, L.M., Pradhan, S., Korenic, S., Wijtenburg, S.A., Hong, L.E., Edden, R.A., Barker, P.B., 2016. Elevated brain lactate in schizophrenia: a 7 T magnetic resonance spectroscopy study. Transl. Psychiatry 6, e967.
- Sijens, P.E., Levendag, P.C., Vecht, C.J., van Dijk, P., Oudkerk, M., 1996. 1H MR spectroscopy detection of lipids and lactate in metastatic brain tumors. NMR Biomed. 9, 65–71.
- Emir, U.E., Auerbach, E.J., Van De Moortele, P.-F., Marjańska, M., Uğurbil, K., Terpstra, M., Tkáč, I., Öz, G., 2012. Regional neurochemical profiles in the human brain measured by 1H MRS at 7 tesla using local B1 shimming. NMR Biomed. 25, 152–160.
- Tkác, I., Oz, G., Adriany, G., Uğurbil, K., Gruetter, R., 2009. In vivo 1H NMR spectroscopy of the human brain at high magnetic fields: metabolite quantification at 4T vs. 7T. Magn. Reson. Med. 62, 868–879.
- Mlynárik V, Gruber S, Moser E., 2001. Proton T (1) and T (2) relaxation times of human brain metabolites at 3 Tesla. NMR Biomed. 14, 325-31.
- Xin, L., Schaller, B., Mlynarik, V., Lu, H., Gruetter, R., 2013. Proton T1 relaxation times of metabolites in human occipital white and gray matter at 7 T. Magn. Reson. Med. 69, 931–936.
Figures