3856
Eddy current evaluation and minimization for PRESS localized diffusion tensor spectroscopy.1University of Alberta, Edmonton, AB, Canada
Synopsis
Gradients used for diffusion spectroscopy require minimization of the eddy currents. Eddy currents impact phase alignment, spectral distortion, and signal amplitude, contributing to error in estimating diffusion coefficients. Strategies have been employed to minimize their effects, including using bipolar gradient pulses around the MRS volume selective pulses. This concept has been further refined to allow multiple eddy current time constants to be minimized by using asymmetric bipolar gradient pairs. An additional oscillatory eddy current may arise as the result of vibration and acoustic noise. We present a simple method for assessing and minimizing the oscillatory eddy currents.
Introduction
The use of strong diffusion sensitizing gradient fields for spectroscopic studies of metabolite diffusion require strategies to minimize the effects of induced eddy currents. These effects impact the accuracy of phase alignment of target peaks, cause spectra distortion, and therefore affect the resulting measured signal amplitude, which in turn increases the potential error in the calculated values for diffusion coefficients. A number of strategies have been employed to minimize the eddy current effects, which include the use of bipolar gradient pulses around each of the latter two MRS volume selective pulses (1-3). This concept has been further refined to allow multiple eddy current time constants to be minimized by using asymmetric bipolar gradient pairs (4,5). An additional oscillatory eddy current may arise as the result of vibration and acoustic noise, which have long time constants in the order of several seconds (6,7). Here we present a simple method for assessing and subsequently minimizing the oscillatory eddy currents present when using typical diffusion gradient schemes for diffusion tensor spectroscopy (DTS).Methods
All data were acquired using a 4.7T magnet, a Varian/Agilent spectrometer, and a single channel transmit/receive head coil. A dual concentric sphere containing n-Octanol in the inner chamber, and 50mM saline in the outer chamber was used for these studies. A PRESS sequence was used with the following modifications: (i) A gradient pre-pulse array for eddy current assessment. (ii) Diffusion gradient pairs around each of the PRESS 180 pulses. Eddy current assessment used the PRESS scheme we described previously (8), with 8 averages acquired for each summed spectrum, and where the time interval following a gradient pre-pulse of 5 Gauss/cm were adjusted from 10ms up to 2s. All 3 gradient directions were assessed with single gradient pulse (unipolar), two 30ms gradient pulses with either the same phase or opposite phase, or 15ms gradient pulse lengths for the 4 gradient pulse schemes. The timing between the leading edge of the gradient pairs was adjusted to be consistent with diffusion sensitization gradient timings in the PRESS portion of the sequence. All spectra were phase aligned, using the n-Octanol methylene peak, and the mean and SD of the phase correction required for each set of 8 averages computed. Once each set of 8 averages was summed the methylene peak amplitude was measured. For DTS experiments all pre-pulse amplitudes set to zero.Results
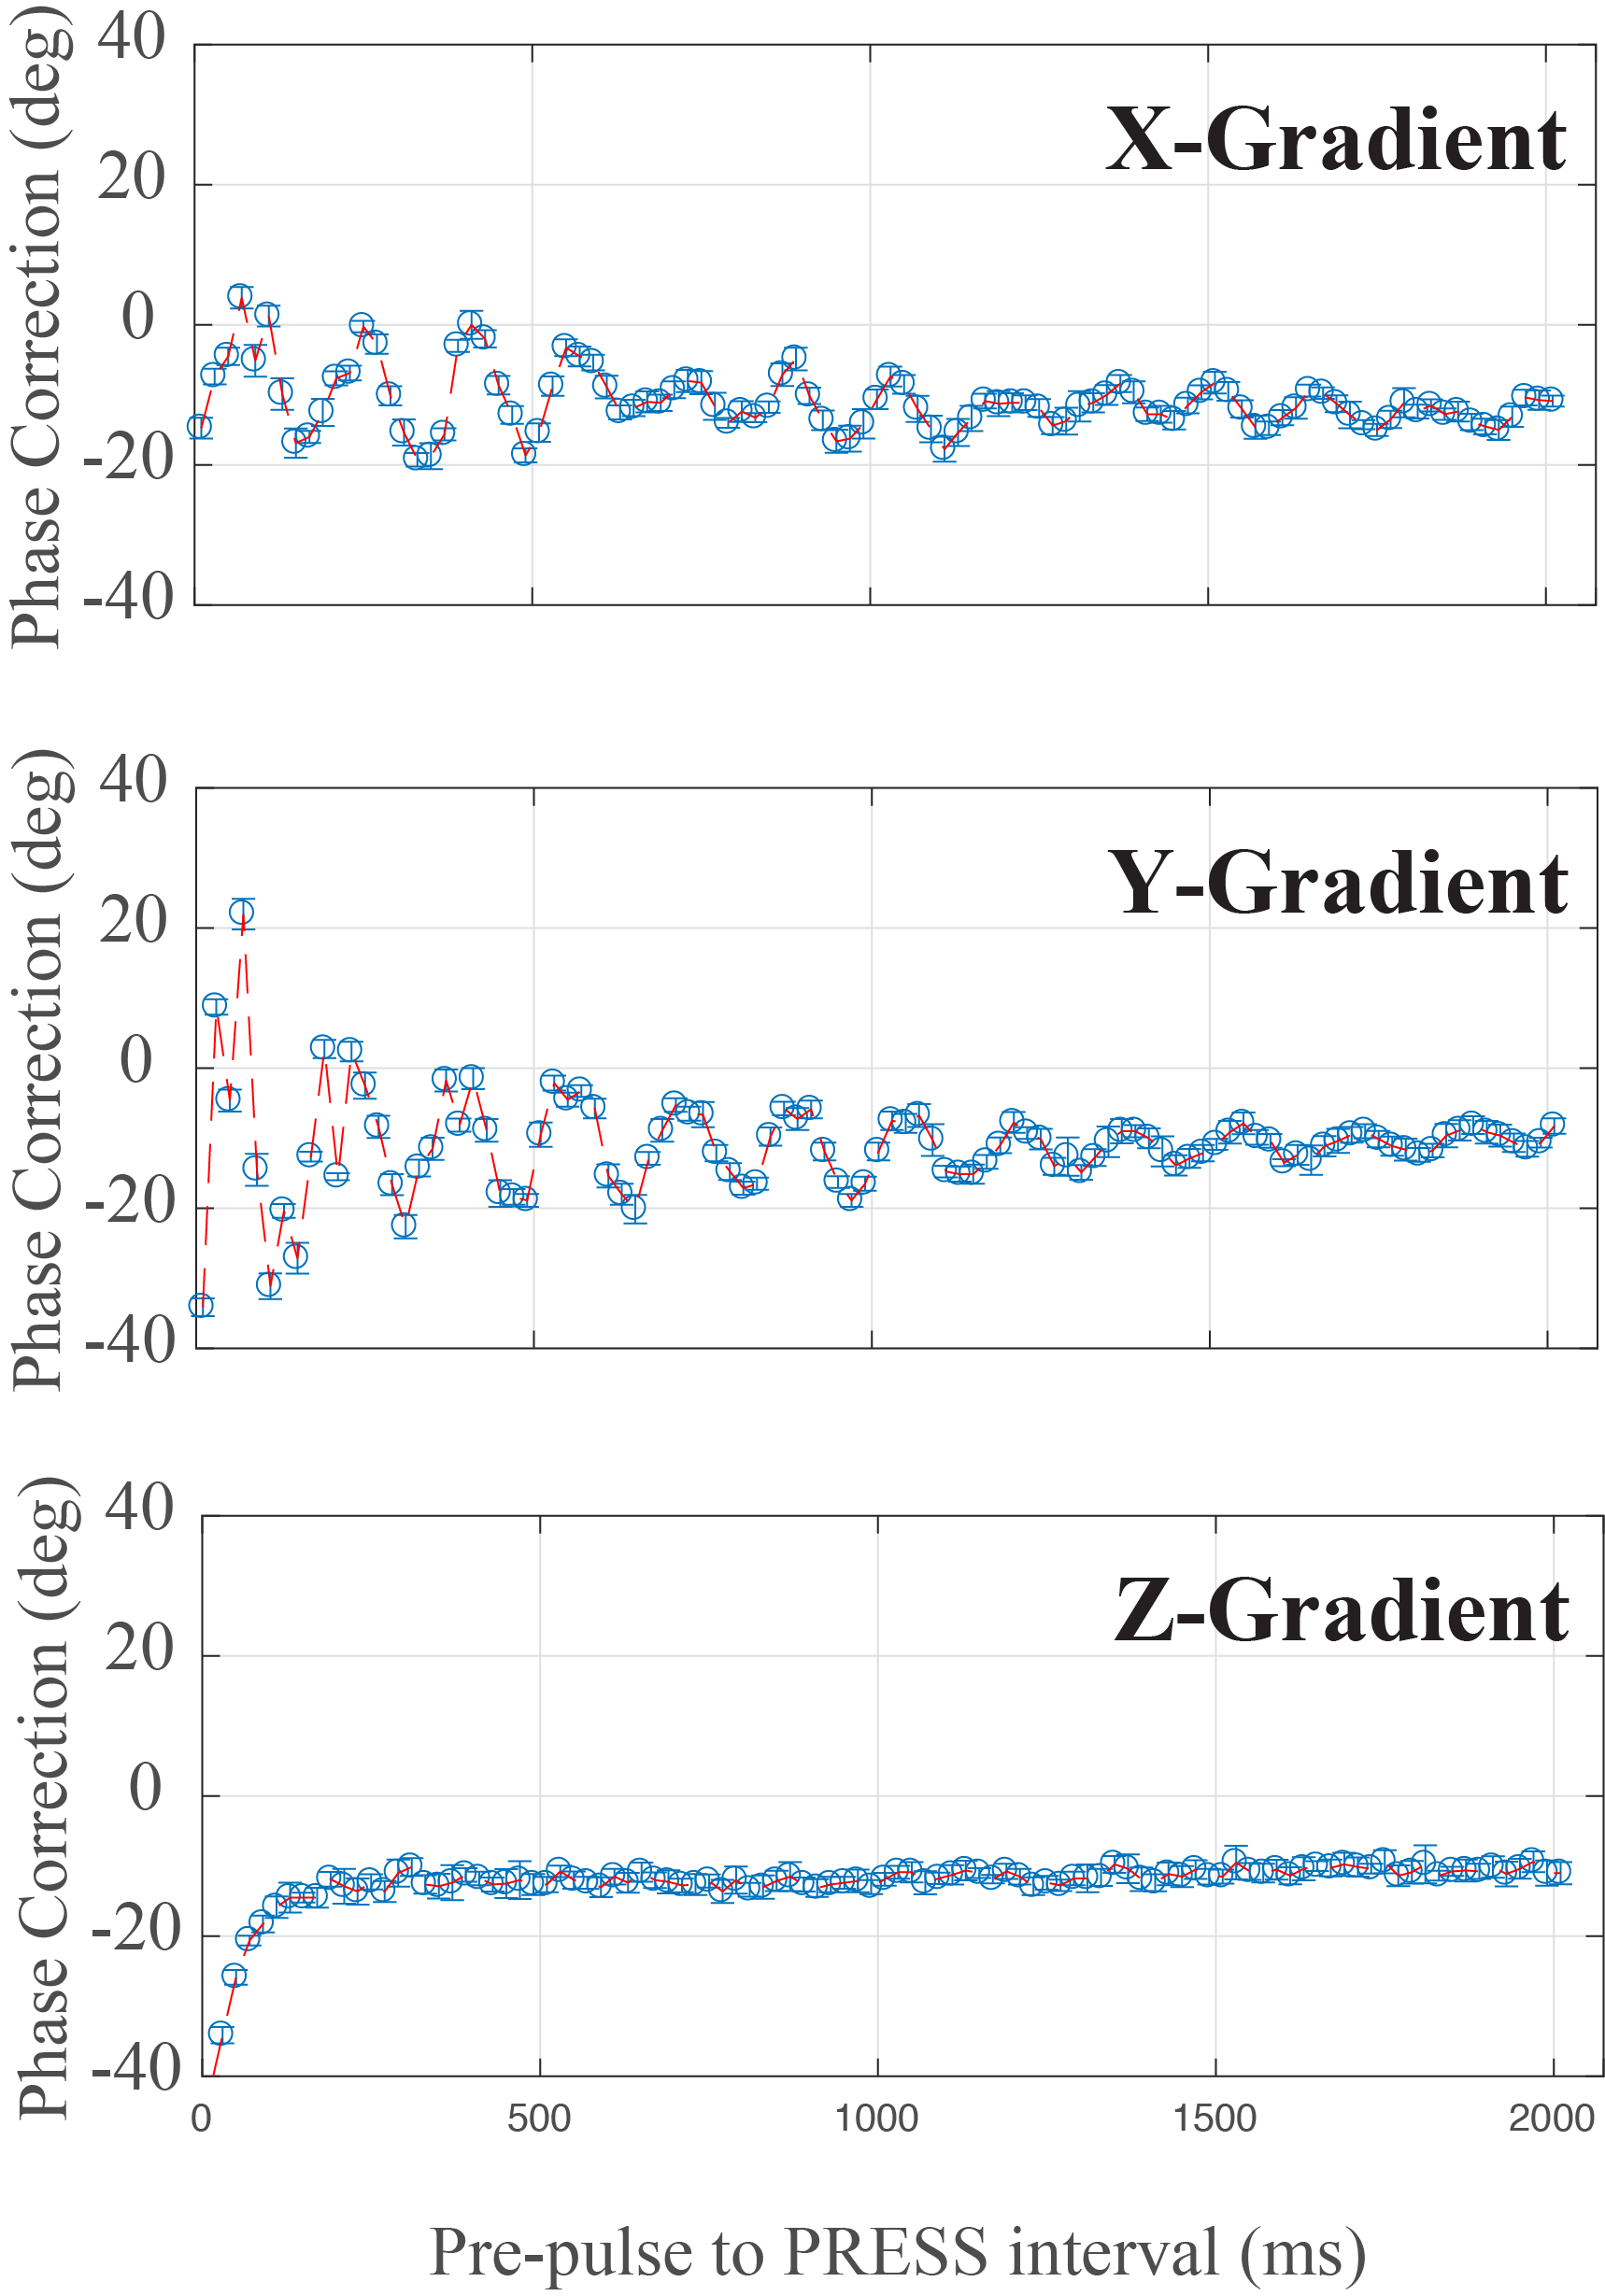
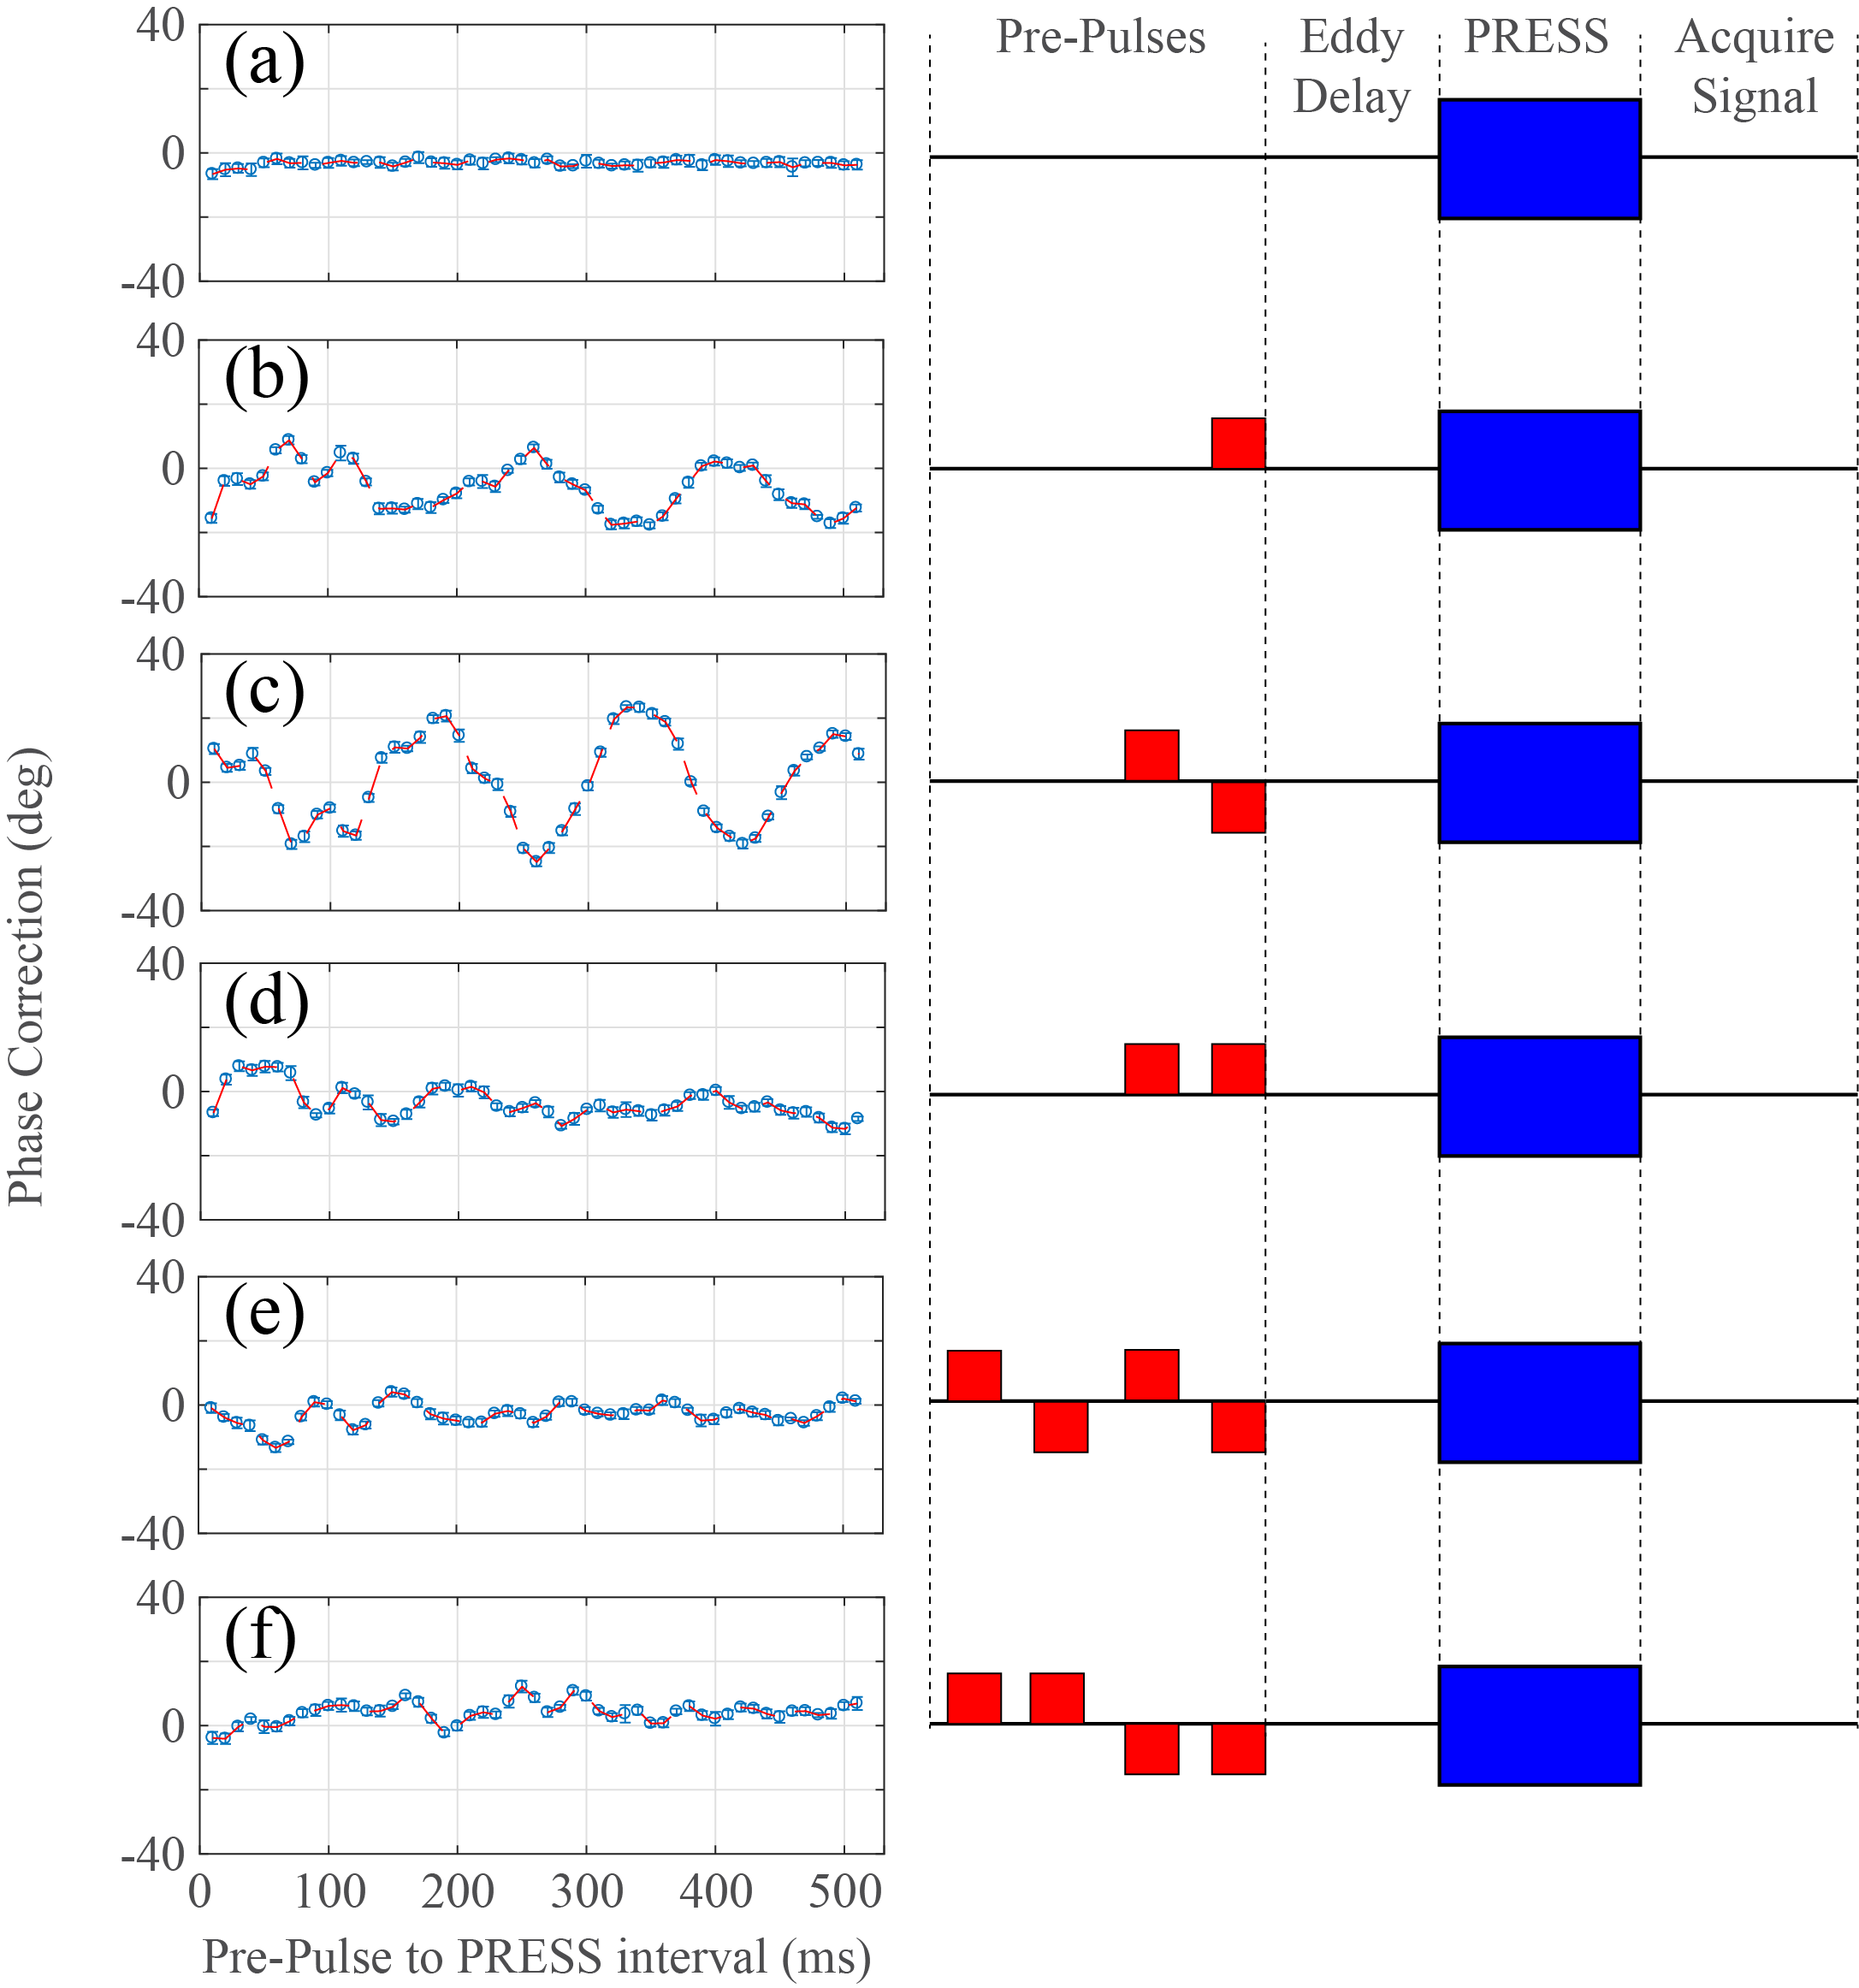
The effect on the signal phase following a single X, Y or Z gradient pre-pulse is illustrated in Figure 1. The effect of the Z-gradient shows a simple single exponential decay of the eddy current, with a time constant of ~45ms. While the X and Y gradients show a very long-lasting sinusoidal decay, and where the period of oscillation is ~150ms. Figure 2 illustrates the effect of applying none 2(a), one 2(b) or two 30ms gradient pre-pulses separated by a time interval of 45ms. The gradient pulses were either opposite phase, Figure 2(c), or same phase, Figure 2(d). Extending the pre-pulses to two pairs either alternating phase, Figure 2(e), or same phase, Figure 2(f), show further improvements in reduced phase error accumulation.Discussion
While the typical schemes to minimize eddy current effects for DTS applications will be effective for the Z gradient characteristics observed here, such methodology will not permit minimization of the oscillatory eddy current effects observed for the X and Y gradients. Furthermore, using the normal reversed phase bipolar scheme as used in most studies about each 180 pulse, and with typical sequence timings, results in constructive interference, illustrated in Figure 2(c), and thereby degrading the quality of the DTS data. On the other hand, using a same phase bipolar pair, Figure 2(d), with the inter-pulse timing adjusted to match half the period of the oscillatory eddy current, destructive interference results and the effect on the signal phase was greatly reduced, and thereby providing a more stable signal phase and amplitude. Using a hardware approach compensation for an oscillatory eddy current has been shown to be effective, and is the ideal method to resolve this (7). However, implementation of this hardware upgrade is not readily feasible for the majority of scanners, since it requires the installation non-standard equipment, and we present here a simple method for achieving reasonable suppression.
In summary, using same phase pairs of diffusion gradients around each 180 pulses in the PRESS sequence provides an effective and efficient means of suppressing oscillatory eddy currents.
Acknowledgements
The authors acknowledge the funding support from the Canadian Institute for Heath Research.References
1. Alexander AL, Tsuruda JS, Parker DL. Magn Reson Med 1997,38,1016-1021.
2. Koch M, Norris DG. Phys Med Biol 200,45,3821-3832.
3. Steidle G, Schlick F. Magn Reson Med 2006,55,541-548.
4. Reese TG, Heid O, Weisskoff RM, Wedeen VJ. Magn Reson Med 2003,49,177-182.
5. Finsterbusch J. Magn Reson Imag 2010,28,434-440.
6. Ryner LN, Stroman P, Wessel T, Hoult DI, Saunders JK. ISMRM 1998, p1903.
7. Nixon TW, McIntyre S, Rothman DL, de Graaf RA. J Magn Reson 2008,192,209-217.
8. Hanstock C, Cobzas D, Beaulieu C. ISMRM 2017, 3019
Figures