3855
Intra- and inter-site reproducibility of single voxel MRS at 3T in the human brain1Department of Physics, University of British Columbia, Vancouver, BC, Canada, 2International Collaboration on Repair Discoveries (ICORD), Vancouver, BC, Canada, 3MR Clinical Science, Philips Healthcare Canada, Markham, ON, Canada, 4UBC MRI Research Centre, University of British Columbia, Vancouver, BC, Canada, 5ImageTech Lab, Simon Fraser University, Surrey, BC, Canada, 6Department of Statistics, University of British Columbia, Vancouver, BC, Canada, 7Department of Radiology, University of British Columbia, Vancouver, BC, Canada, 8Philips Healthcare, Bonn, Germany, 9Division of Neurology, University of British Columbia, Vancouver, BC, Canada, 10Department of Pathology & Laboratory Medicine, University of British Columbia, Vancouver, BC, Canada
Synopsis
We investigated the intra- and inter-site reproducibility of 1H-MRS with short-TE PRESS at 3T acquired on a single manufacturer at 6 different sites. Metabolite concentrations were robust to small inconsistencies in voxel placement (mean alignment=86%), highlighting that site was not the driving factor for differences in metabolite concentrations. Between-subject differences drove the concentration variability for creatine, choline and myoinositol (42-65% of the variance). The mean intra-site coefficient of variation for the metabolites was between 2.5% and 5.3%. The results support the use of a large single voxel 1H-MRS acquisition from a single manufacturer for multi-site clinical trials.
Background
Proton magnetic resonance spectroscopy (1H-MRS) can provide quantitative measurements of brain metabolites, making it potentially useful for clinical trials assessing neuroprotective therapies. However, for 1H-MRS to be an effective outcome measure, data must be reproducible, and consistent across different sites. While inter-site single voxel 1H-MRS can be highly reproducible at 7T using a lengthy and non-standard acquisition protocol1, this implementation is not directly transferable to a clinical trial situation using 1.5T or 3T scanners with limited time available for the 1H-MRS acquisition. Evaluating the reproducibility of 1H-MRS within and across different sites is important to determine its feasibility for multi-site clinical trials.Purpose
To evaluate the intra- and inter-site reproducibility of 1H-MRS with the same MRI manufacturer.Methods
Study Design: Five healthy volunteers (3F/2M; mean age: 37yrs, range: 24–54yrs) travelled to 6 MRI sites across Canada & USA and underwent 2 MR examinations (Scan A, Scan B) within 24 hours at each site
MRI Experiments: Exams were performed on 3T MR systems from the same vendor (Achieva, Philips, Best, The Netherlands) with 8-channel head coils. Data included: 1. midline sagittal T1 , 2. axial Quick-T2 for manual 1H-MRS planning, 3. IR-T1 (TE/TR/TI=4.6/8.0/1500ms, FOV=240/196/65mm), 4. 1H-MRS (PRESS, TE/TR/NSA=36ms/4s/56, ap/lr/fh=65/45/18mm3 = 53mL, second order shimming, excitation water suppression, 8 non-water suppressed spectra), and 5. 3D-T1 (TE/TR/TI/shot interval=3.6/8.0/838/1800ms FOV=250/174/200mm, with 1mm3 isotropic resolution, collected at mid-timepoint of study (exam 9/12)).
Data Processing: 1H-MRS data was analysed using LCModel (Version 6.3-1H)2 with water scaling. Tissue segmentation and intra-subject registration was performed with FSL FAST and FLIRT3, respectively. The voxel location was identified on the IR-T1 and registered to the 3D-T1 (Figure 1). Absolute metabolite concentrations, [met], were calculated based on voxel tissue composition, with corrections for water relaxation (Figure 1)4-7.
Data Analysis:Intra-site (scan-rescan) variability was assessed by coefficient of variation (CoV). Voxel consistency was the relative overlap of each scan with the mean voxel location per subject, and compared between subjects using a one-way ANOVA with multiple-comparison (p<0.05). For inter-site reproducibility, we model [met] from each scan for N-Acetyl-Aspartate (NAA), total creatine (tCr), total choline (tCho), glutamate (Glu) and myo-Inositol (Ins) using a linear mixed effect (LME) model, with a systematic site effect and a random subject effect. The total variance was decomposed into 3 additive components of site, subject and unexplained residual
Results
Spectra were highly consistent with narrow linewidths (mean ± standard deviation = 5.3±0.9Hz) and high signal to noise (mean ± standard deviation = 43.8±4.8) (Figure 2a,b). One spectrum was rejected because of outer volume signal artefacts. For 7 spectra, only tCr, tCho and Ins were considered reliably fit due to baseline distortions below 2.8ppm. Voxel consistency was overall high (86±3%), with volunteer A being significantly better than B, D, and E (Figure 2c,d). Bland-Altman plots8 (Figure 3) showed no bias in the scan-rescan differences with increasing mean [met]. Intra-site CoVs tended to be lower for NAA and tCr and higher for Glu and Ins (Figure 4). tCho showed the largest range of CoVs for different sites. The estimated variance components of the LME model are shown in Figure 5. Note that correcting for VOI consistency did not change the trend of the results. The main sources of variance for tCr, tCho, and Ins were inter-subject variability, whereas the majority of the variance in Glu and NAA could not be explained by site or subject factors. Site was not the driving factor in the variance of the measurement of any [met]. For a multi-centre trial, the [met] CoV can be estimated with the mean intra-site CoV averaged across volunteers: NAA 2.9%; tCr 2.5%; tCho 3.3%; Glu 3.7%; Ins 5.2%.Discussion and Conclusion
We
assessed 1H-MRS intra- and inter-site reproducibility across 6 sites with the
same MRI manufacturer, and achieved scan-rescan CoV similar to those reported previously
at 1.5T9-10. Modelling
all of the data with site and subject factors as sources of variance showed
that site was not the driving factor in the variance for any metabolite. The
consistency of voxel placement did not have an appreciable effect on the
spectral quality or measurement variance, demonstrating that careful planning
by trained MR technologists can provide reproducible results. The large voxel
size would be less sensitive to small changes in voxel location given the
relatively homogenous tissue in this region. These results support the use of a large
single voxel 1H-MRS acquisition from a single vendor for future multi-site
clinical trials.Acknowledgements
We sincerely thank the study participants, MRI technologists, physicists and support staff at the 6 participating sites. We gratefully acknowledge funding support from Sanofi Genzyme and the MS Society of Canada. CG is the recipient of an endMS MSc Scholarship. ELM is supported by Philips Healthcare Canada. CL was the recipient of the Women Against MS (WAMS) endMS Research and Training Network Transitional Career Development Award from the MS Society of Canada, and holds operating grants from the MS Society of Canada and NSERCReferences
1. van de Bank BL, Emir UE, Boer VO, et al. Multi-center reproducibility of neurochemical profiles in the human brain at 7 T. NMR in Biomed. 2015;28(3):306–316.
2. Provencher SW. Estimation of metabolite concentrations from localized in vivo proton NMR spectra. Magn. Reson. Med. 1993;30(6):672–679.
3. Jenkinson M, Beckmann CF, Behrens TEJ, et al. FSL. Neuroimage. 2012;62(2):782–790.
4. de Graaf RA. In Vivo NMR Spectroscopy: Principles and Techniques. 2nd ed. Hoboken, NJ: John Wiley & Sons; 2007.
5. Laule C, Vavasour IM, Kolind SH, et al. Long T2 water in multiple sclerosis: what else can we learn from multi-echo T2 relaxation?. J Neurol. 2007;254(11):1579–1587
6. Vavasour IM, Laule C, Kolind SH, et al. Hydration status does not affect brain water content or myelin water fraction in healthy volunteers. Proceedings of 19th Annual International Society for Magnetic Resonance in Medicine Annual Meeting & Exhibition. Honolulu. 2009.
7. Liang ALW, Vavasour IM, Mädler B, et al. Short-term stability of T1 and T2 relaxation measures in multiple sclerosis normal appearing white matter. J Neurol. 2012;259(6):1151–1158.
8. Bland JM, Altman DG. Statistical methods for assessing agreement between two methods of clinical measurement. Lancet. 1986;1(8476):307–310.
9. Chard DT, McLean MA, Parker GJM, et al. Reproducibility of in vivo metabolite quantification with proton magnetic resonance spectroscopic imaging. J Magn Reson Imaging. 2002;15(2):219–225.
10. Komoroski RA, Kotrla KJ, Lemen L, et al. Brain metabolite concentration ratios in vivo: Multisite reproducibility by single-voxel 1H MR spectroscopy. Magn Reson Imaging. 2004;22(5):721–725.
Figures
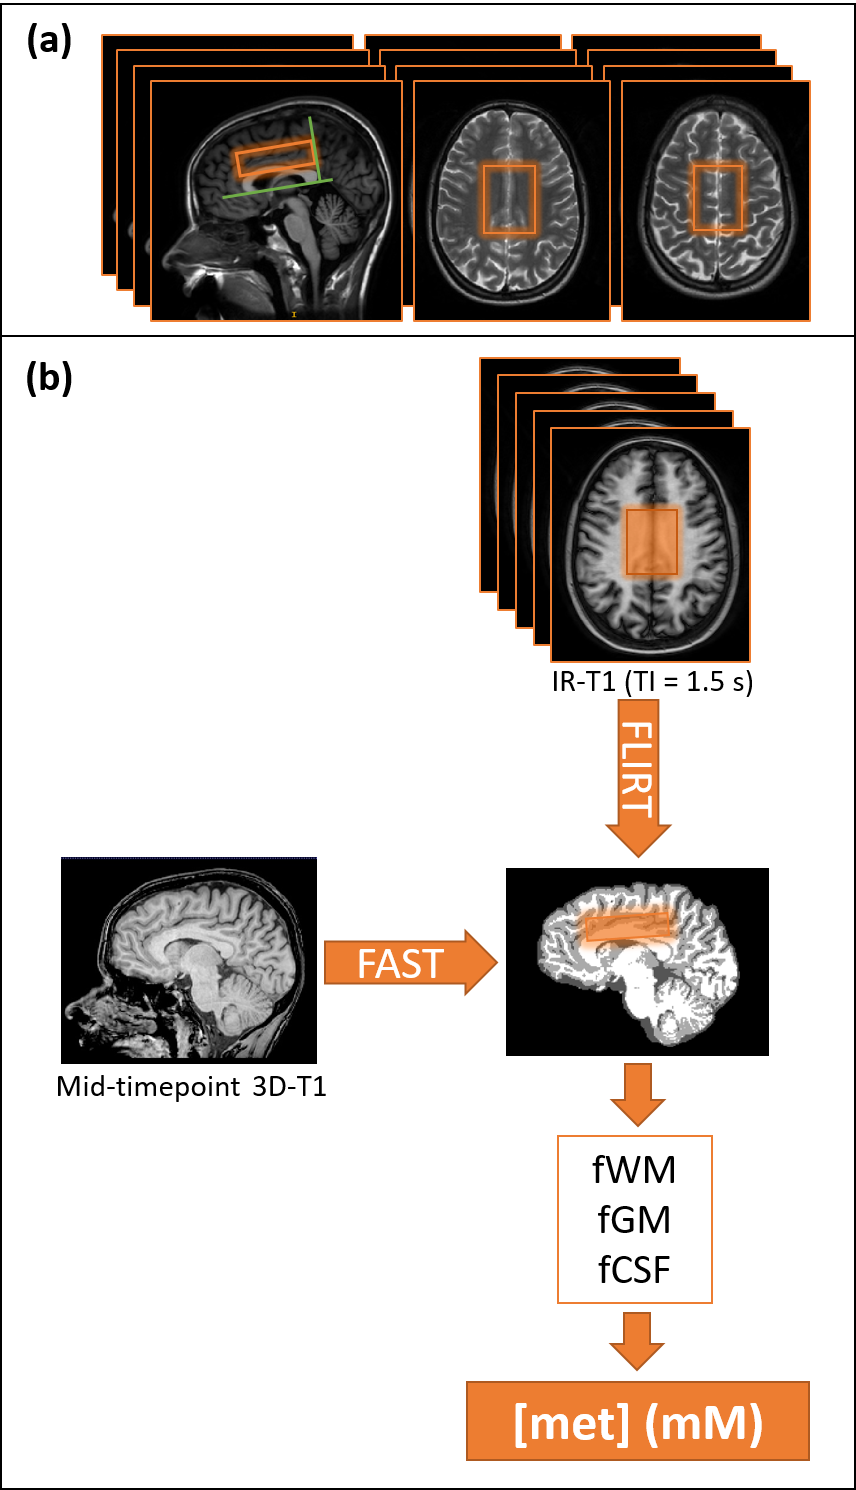
Figure 1: Voxel Planning (a) and Analysis Pipeline For Each Subject (b).
(a) The voxel was aligned with the genu and splenium on the sagittal T1 and shifted “upwards” so that the bottom of the voxel was one slice above the ventricles.
(b) Each
voxel was localised on the IR-T1 rather than the Quick-T2 due to the shorter
time delay until the 1H-MRS. IR-T1s were registered to the 3D-T1. 3D-T1 partial
volume fractions (fraction white matter (fWM), grey matter (fGM), cerebrospinal
fluid (fCSF)) were applied to correct the water concentration ([H2O](WM/GM/CSF)=0.74/0.82/0.99)
and
attenuation (T1(WM/GM/CSF)=0.98/1.42/3.00s,
T2(WM/GM/CSF)=70/75/500ms) to calculate absolute concentrations [met].
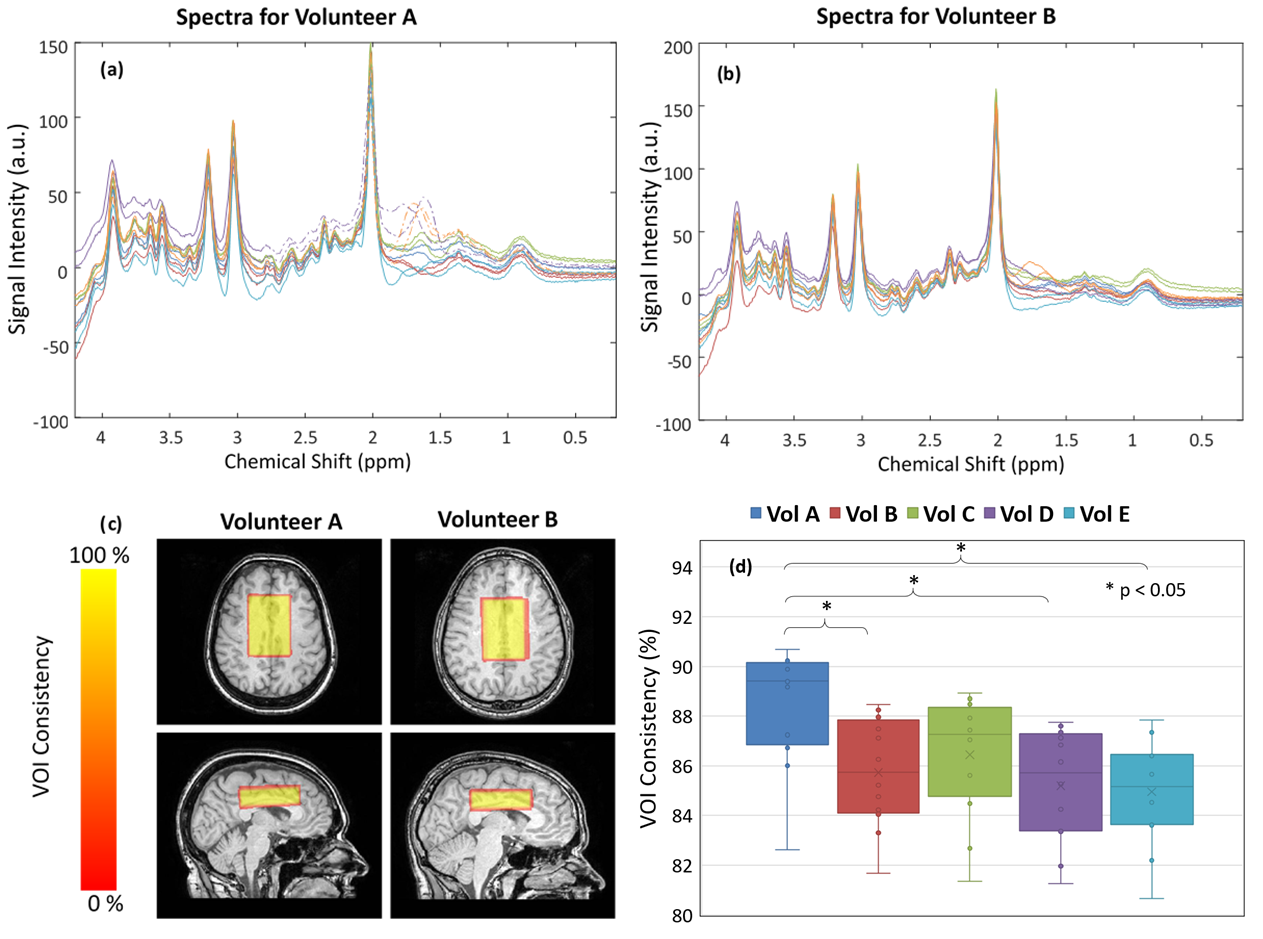
Figure 2: Spectral Quality and Voxel Consistency.
(a) and (b) show all spectra from 2 volunteers (same colours indicate the same site, dashed sections of spectra indicate baseline distortions in the fit that led to unreliable quantification of metabolites < 2.8ppm). Spectra in (a) have a wider range suggesting outer volume signal leakage between 1.5 and 2.0 ppm, whereas (b) shows more consistent spectral quality.
(c) and (d) represent a measure of voxel consistency. Although volunteer B has significantly decreased voxel consistency compared to A, it does not have a direct effect on spectral quality.
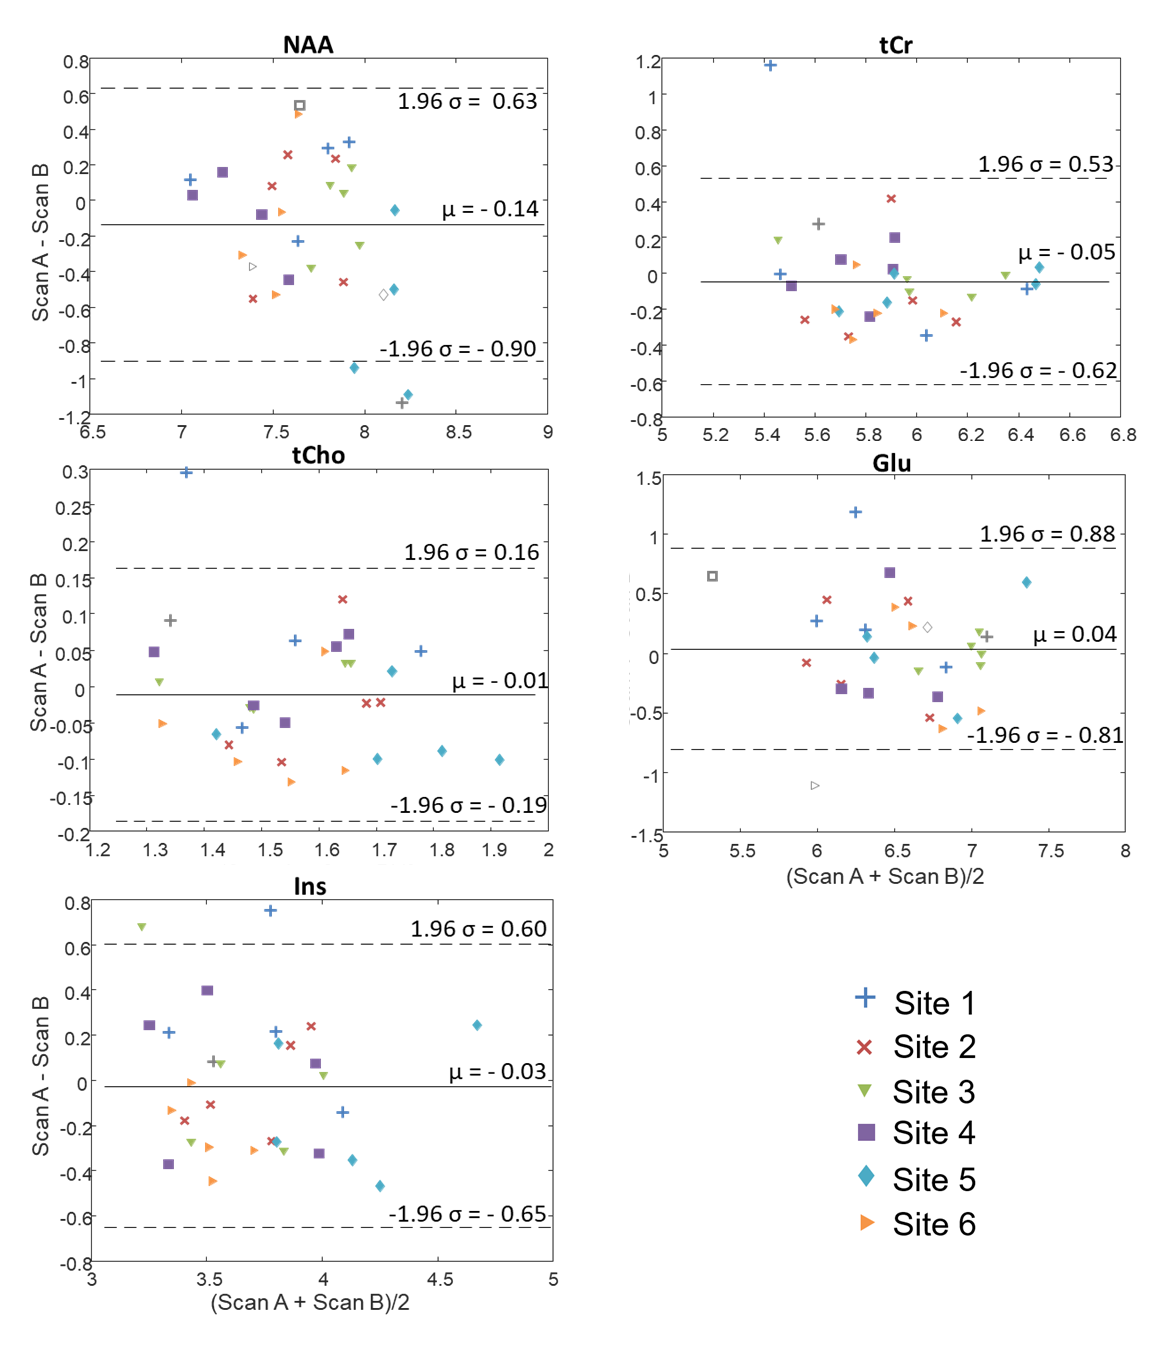
Figure 3: Bland-Altman plots of Scan-Rescan Differences.
The difference in [met] for pairs of scans is plotted against the mean. Note that the ideal Bland-Altman plot would be a horizontal line at y = 0, stating that there is no difference between A and B. Dashed lines mark the 95% confidence interval. Open and grey icons show a ScanA/B pair where one data point was rejected due visual inspection of the spectral quality, and was not included in further analysis.
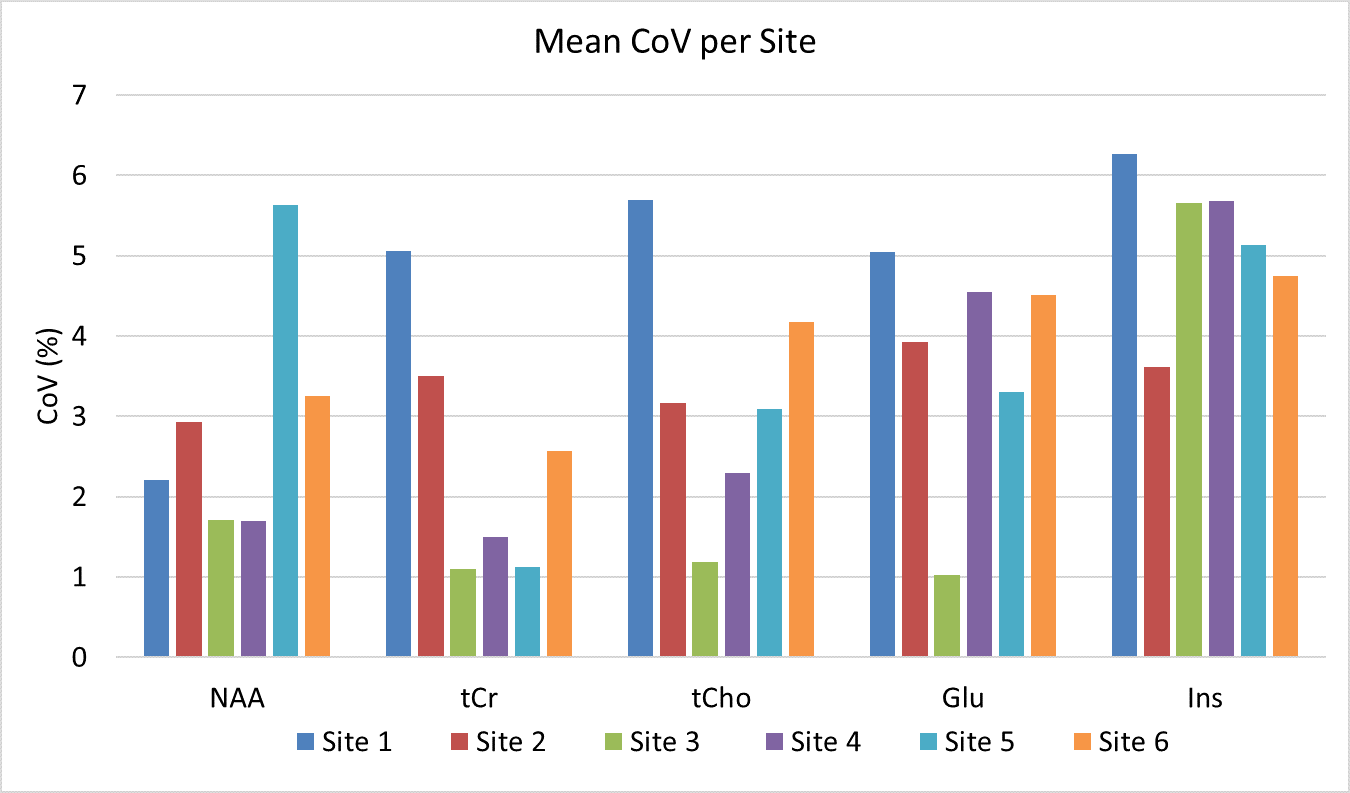
Figure 4: Mean Intra-Site Coefficient of Variation (CoV).
Mean CoV averaged over all CoVs for each scan A/B pair within one site. NAA and tCr have lower relative CoVs (mean(range) NAA CoV=2.9 (1.7-5.6)%, tCr CoV=2.5 (1.1-5.1)%), while Glu and Ins show higher CoVs (Glu CoV=3.7 (1.0-3.7)%, Ins CoV=5.2 (3.6-6.3)%). tCho shows the largest range of CoVs for different sites (3.3(1.2-5.1)%)

Figure 5: Sources of Variance as estimated by Linear Mixed Effects Model.
The different sources of variance are represented for different [met]. The total variance σtot2 of a scan taken randomly at one of the six sites consists of three additive components of σsite2,σsubject2 ,σresidual2. No σtot2 is dominated (largest percentage contribution or effect, printed in bold) by the variance attributed to inter-site differences.