3852
Direct Estimation of Model Parameters in MR Spectroscopic Imaging using Deep Neural Networks1Department of Computer Science, Technical University of Munich, Munich, Germany, 2GE Healthcare, Munich, Germany, 3Department of Physics, Technical University of Munich, Munich, Germany, 4Klinikum rechts der Isar, Munich, Germany
Synopsis
We introduce a deep neural-network framework based on a multilayer perceptron for estimation of the output parameters of a model-based analysis of MR spectroscopy data. Our proposed framework: (1) learns the spectral features from a training set comprising of different variations of synthetic spectra; (2) uses this learning and performs non-linear regression for the subsequent metabolite quantification. Experiments involve training and testing on simulated and in-vivo human brain spectra. We estimate parameters such as metabolite-concentration ratios and compare our results with that from the LCModel.
Introduction
Quantification of MR Spectroscopy (MRS) signals generates metabolic-maps which show the concentration of metabolites in the sample being investigated. Accurate quantification of these metabolites is important for diagnosis of in-vivo diseases. For this purpose, non-linear model-fitting tools are widely used (such as the LCModel1, TARQUIN2, AMARES3 and ProFit4). The LCModel1 is widely regarded as the gold-standard fitting tool. However, some of its drawbacks include: (1) prior knowledge-tuning and long fitting-times, and (2) high estimation-error for noisy data. Prior work has also focused on using machine-learning for metabolite-quantification5. In this study, we present an alternative to the non-linear model fitting using a deep neural-network approach.Methods
A multilayer-perceptron(MLP)6 is a fully-connected, feedforward deep-neural network comprising of three or more layers of non-linearly activated nodes. The nodes in each layer are connected to the next layer with certain weights. For training, these weights are updated after each backward-pass7 and the error (loss-function), between the actual and predicted parameters, is computed after each iteration. Once the error reduces and achieves convergence, the learning stops.
In MRSI, the frequency-domain complex spectrum of a nucleus is given by $$$S(\omega)$$$. Using the MLP-framework, we perform the inverse signal modeling where we have a training dataset $$$D = (S_{i} (\omega), Y_{i}), i\in [1, N]$$$, where $$$N$$$ is the total number of synthetic training spectra. $$$S_{i}(\omega)$$$ represents the synthetic training spectral data while $$$Y_{i}$$$ represents the corresponding training labels.
As a preliminary study, for our model parameters, we consider the concentration-ratios for the major metabolites - NAA and Choline. Therefore, for a given spectrum $$$S_{i}(\omega), Y_{i} = [ NAA_{i}, Cho_{i}]$$$.
MLP Network. A five-layered perceptron network was constructed to work as a regressor mapping $$$S_{i}(\omega)$$$ to $$$Y_{i}$$$. Each layer consisted of 300 neurons with rectified linear unit (ReLU) activation. The randomly-initialized network was trained to predict the labels by iteratively minimizing the error using gradient-descent with a learning-rate of 10-3. For faster convergence, Adam-optimizer with a Nesterov's momentum of 0.9 was employed and the 'early-stopping' convergence check was utilized on 0.1. To check our network's ability to predict the parameters, we use two test-sets: synthetic and real human in-vivo CSI. The predicted concentrations are denoted by $$$\hat{Y}_{j}$$$. The corresponding LCModel-fitted concentration-ratio labels $$$Y_{j}$$$ serve as the ground-truth, $$$j\in [1, M]$$$, where $$$M$$$ is the total number of test-spectra.
Error Calculation. For our experiments, given the estimate $$$\hat{Y}_{j}$$$ and the testing label $$$Y_{j}$$$, the corresponding estimate error can be calculated as, $$\hat{E}_{j} = ||\hat{Y}_{j} - Y_{j}||_{1}./||Y_{j}||_{1}$$
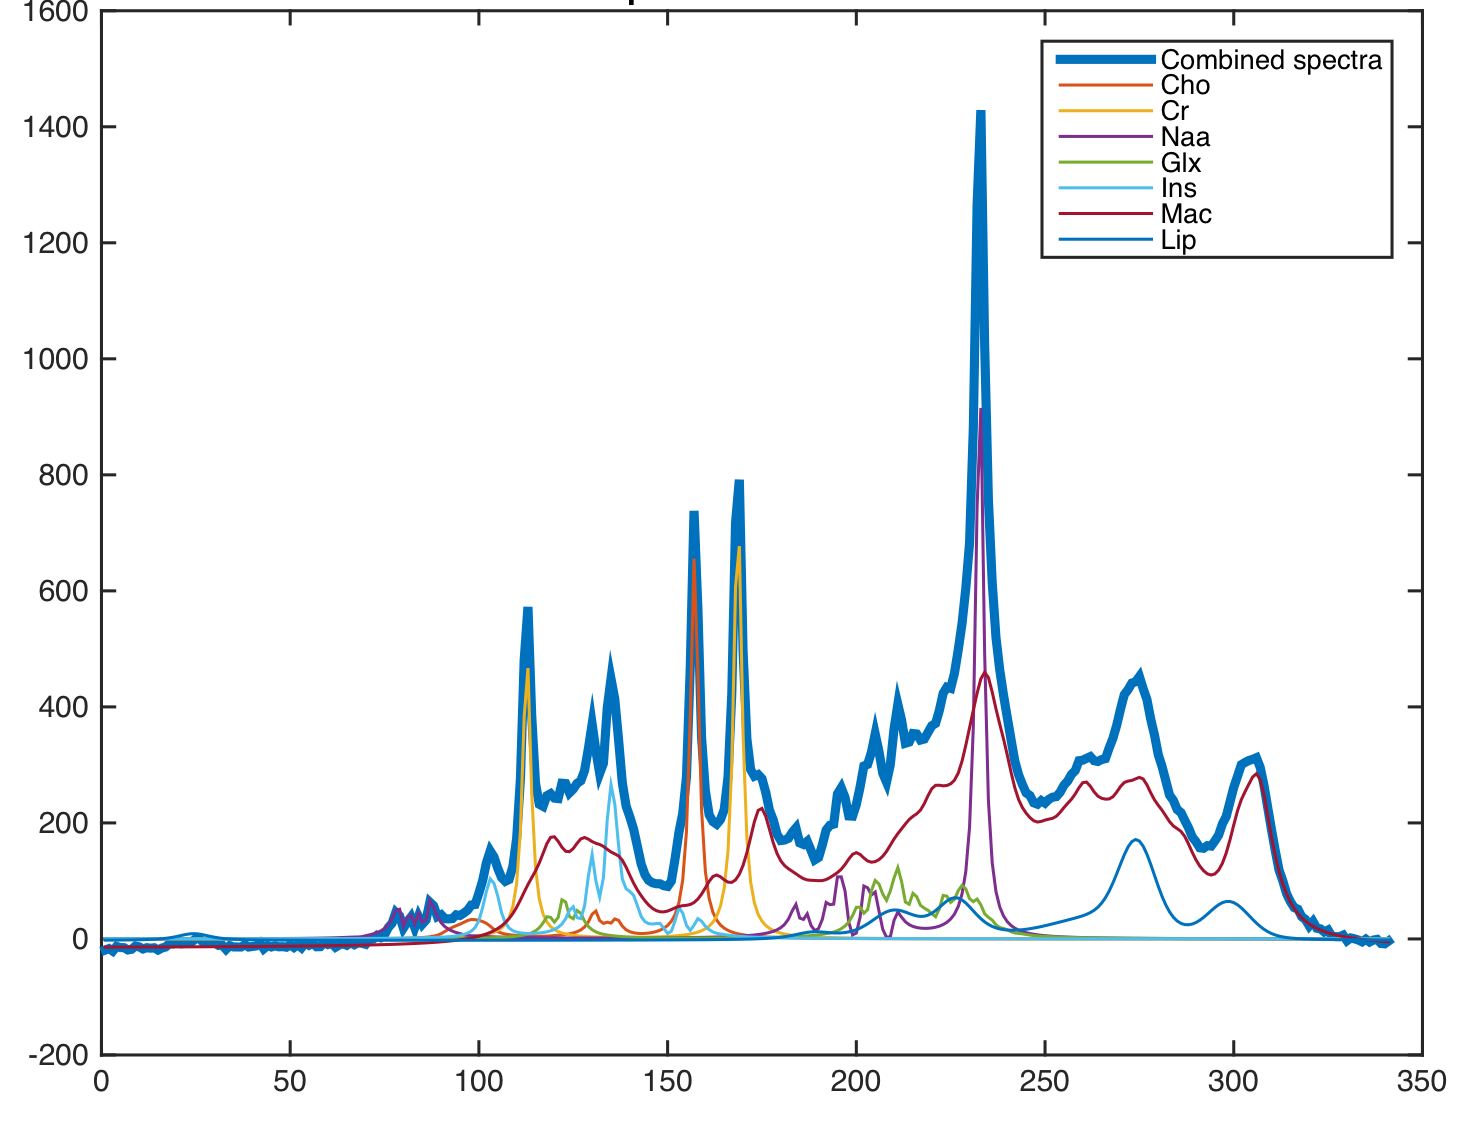
Data. A metabolite basis-set was generated by using the data provided by the ISMRM-Fitting Challenge 20168. An example spectra has been shown in Fig.1. $$$N$$$ = 1-million spectra were simulated with variations in metabolite-concentrations, macro-molecular baseline, lipids, linewidth and SNR to account for changes in spectral quality. For testing, we acquire a standard phase-encoded 2D brain MRSI data of a healthy human volunteer on a 3T-scanner using a PRESS sequence with voxel size = $$$10x10x15 mm^{3}$$$, $$$TE/TR = 35/1000 ms$$$, spectral width = $$$2000 Hz$$$, number of points = $$$400$$$. For testing purposes, we use 96 spectra from the inner-region of the brain which serves as the region of interest. For peak alignment, ppm-cropping and signal-normalization of the training and test spectra, a pre-processing step is performed.
Results
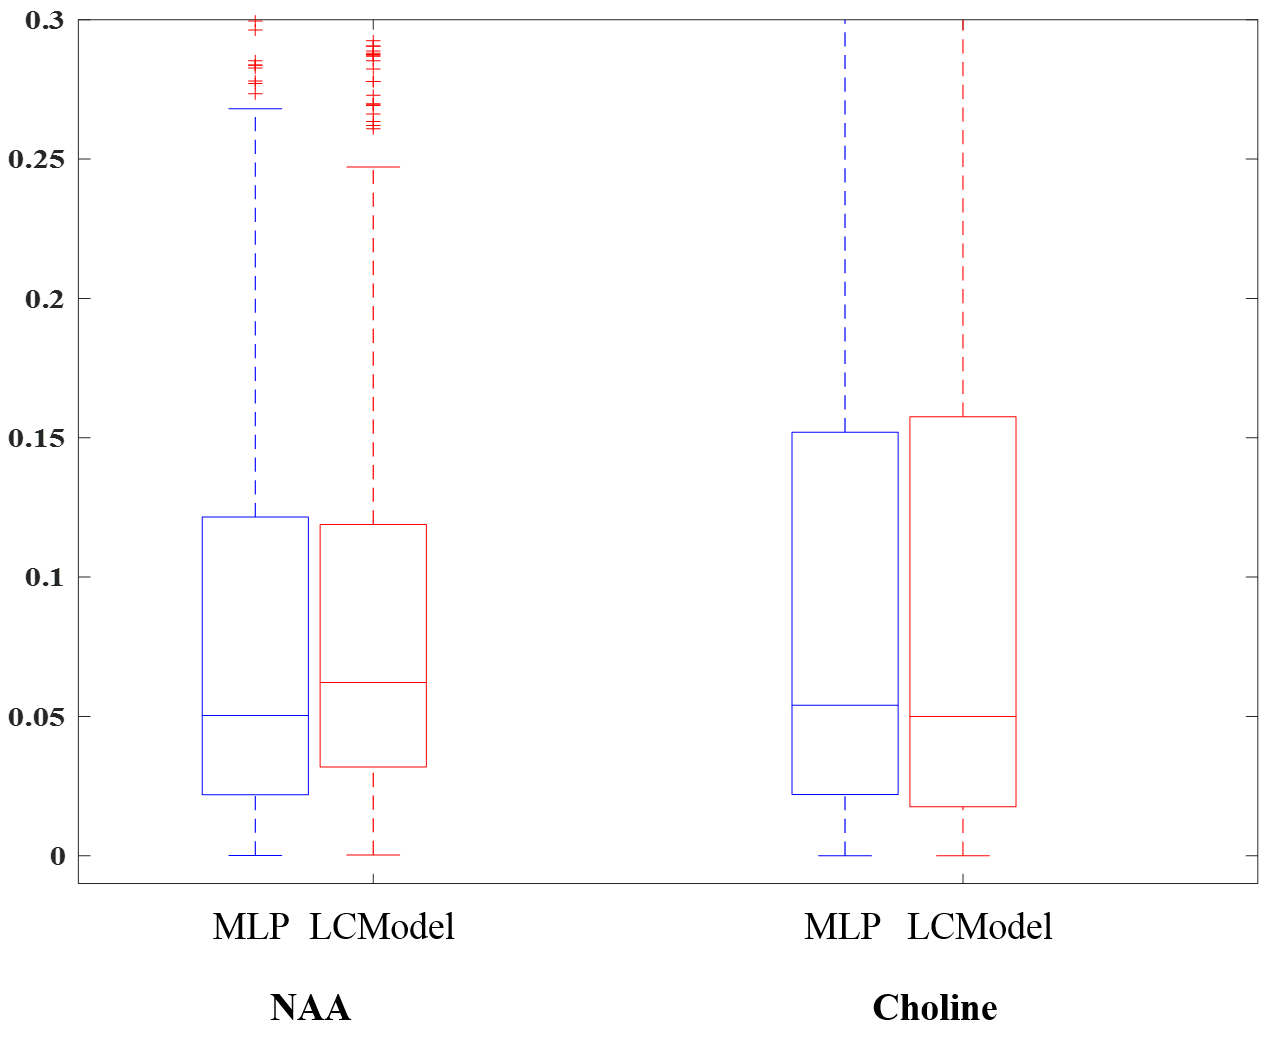
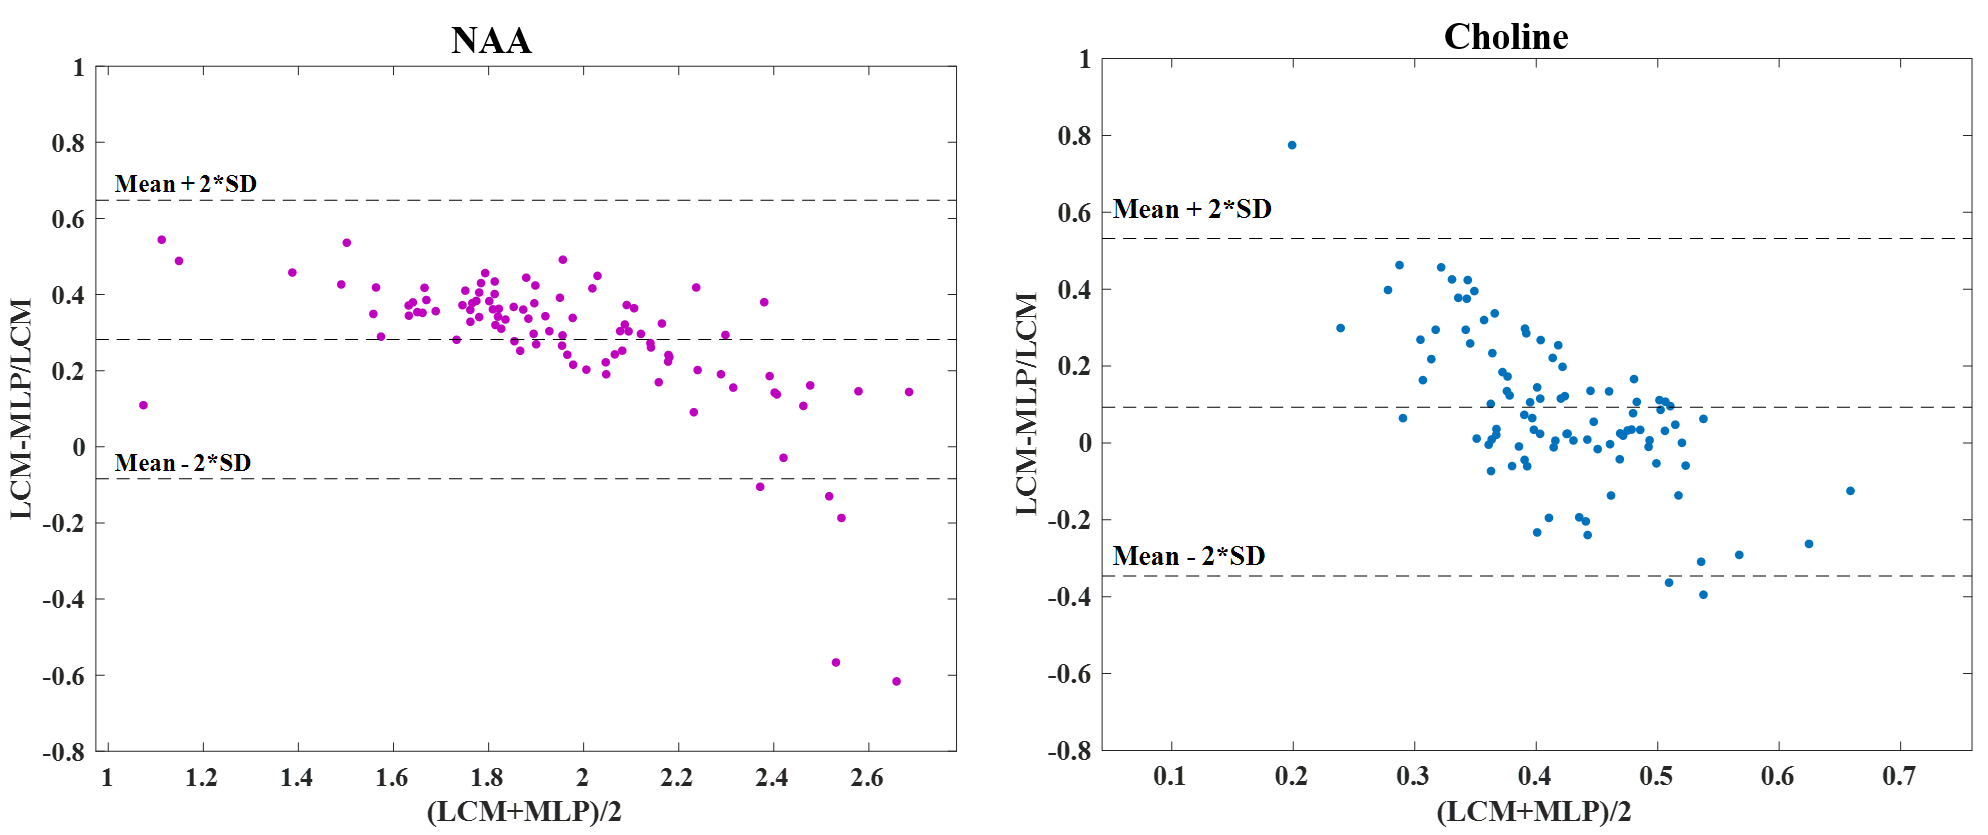
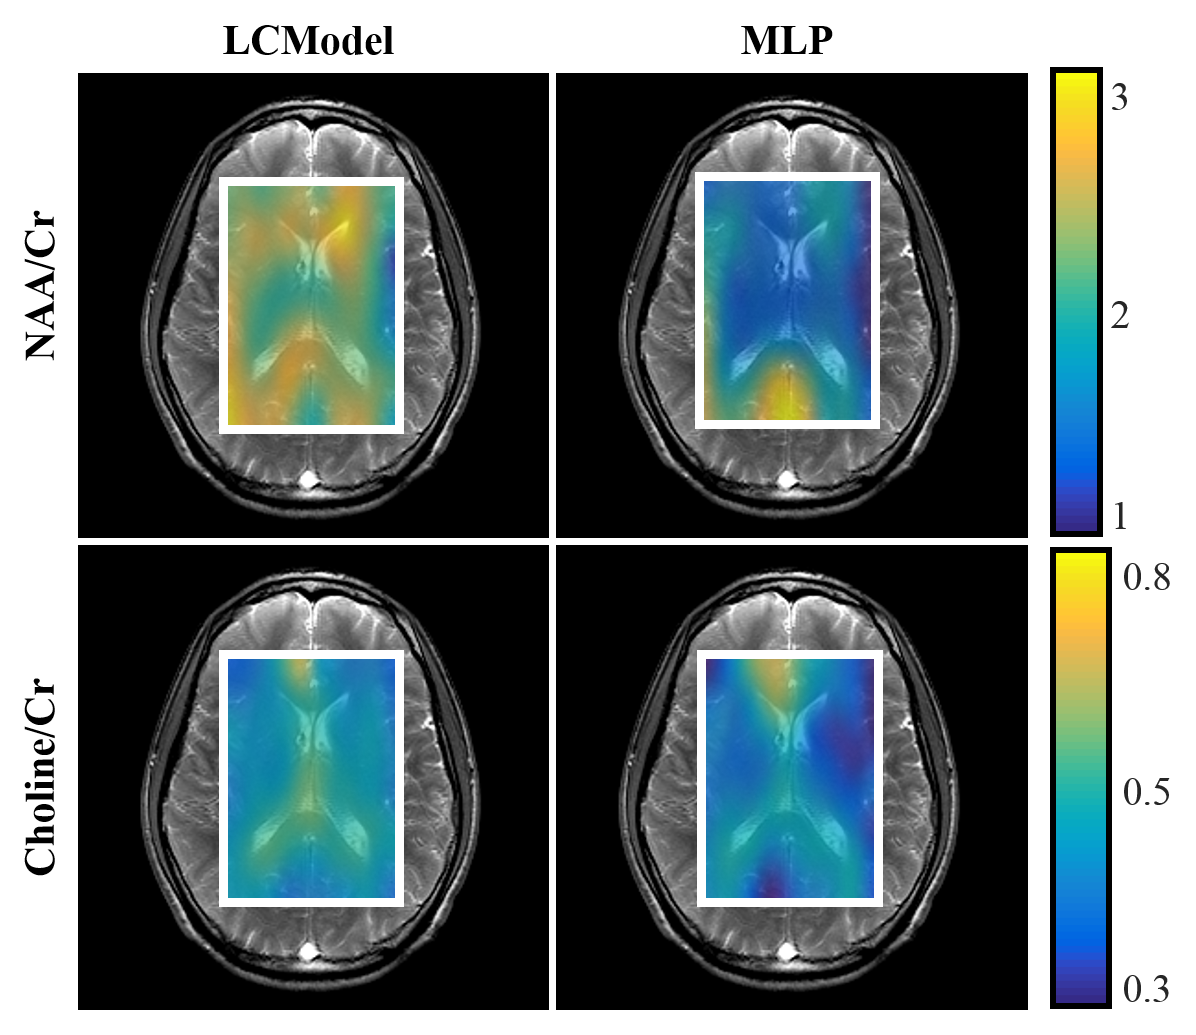
The error distribution for the synthetic test-set comparing the MLP and LCModel methods is shown in Fig.2. For both NAA/Cr and Cho/Cr, the MLP shows a lower median error than the LCModel. Using the Bland-Altman method9, we observe a strong correlation between the LCModel and MLP-estimates for the in-vivo data (Fig.3) while Fig.4 shows the resulting concentration distribution from both methods for NAA/Cr and Cho/Cr with the mean relative-errors from MLP-regression being 0.31 and 0.12 respectively.
Speed: Training time for the synthetic data is 10 minutes using the MLP. While the LCModel takes 10 minutes for the in-vivo metabolite quantification, our proposed network, after training, takes only 10 seconds leading to a 60x improvement in speed.
Discussion and Conclusion
While the synthetic test-results gave a lower error compared to the LCModel, the in-vivo testing gave a slightly higher relative error. A larger training set with more training labels and a stronger network would solve this issue by providing a robust classification of real data. In our proposed method, testing and concentration estimation happens in a few seconds compared to the LCModel-fitting.
Future work would involve using a more diverse network with layer-wise training of spectral features to improve the accuracy of parameter estimation. Once a framework has been established, further work can be done on combining these networks with global decisions about predicting spectral quality especially in the presence of artifacts or as an initialization to the LCModel fits to improve quantification.
Acknowledgements
The research leading to these results has received funding from the European Union's H2020 Framework Programme (H2020-MSCA-ITN-2014) under grant agreement n° 642685 MacSeNet.References
[1] Provencher, S.W.: Estimation of metabolite concentrations from localized in vivoproton NMR spectra. Magnetic Resonance in Medicine (6), 672-679 (1993).
[2] Wilson, M., Reynolds, G., Kauppinen, R.A., Arvanitis, T.N., Peet, A.C.: A constrained least squares approach to the automated quantitation of in vivo 1h magnetic resonance spectroscopy data. Magnetic Resonance in Medicine 65(1), 1-12 (2011).
[3] Vanhamme, L., van den Boogaart, A., Huffel, S.V.: Improved method for accurate and effcient quanti cation of mrs data with use of prior knowledge. Journal of Mag-netic Resonance 129(1), 35-43 (1997).
[4] Schulte, R.F., Lange, T., Beck, J., Meier, D., Boesiger, P.: Improved two-dimensional J-resolved spectroscopy. NMR in Biomedicine 19(2), 264-270 (2006).
[5] Das, D., Coello, E., Schulte, R.F., Menze, B.H.: Quanti cation of Metabolites in Magnetic Resonance Spectroscopic Imaging Using Machine Learning, pp. 462-470. Springer International Publishing, Cham (2017).
[6] Widrow, B., Lehr, M.A.: 30 years of adaptive neural networks: perceptron, madaline, and backpropagation. Proceedings of the IEEE 78(9), 1415-1442 (Sep 1990).
[7] Hecht-Nielsen, R.: Theory of the backpropagation neural network. In: International 1989 Joint Conference on Neural Networks. pp. 593-605 vol.1 (1989)
[8] http://www.ismrm.org/workshops/Spectroscopy16/mrs_fitting_challenge
[9] Bland, J.M., Altman, D.: Statistical methods for assessing agreement between two methods of clinical measurement. The Lancet 327(8476), 307-310 (1986).
Figures