3848
Effect of the phase variation induced by eddy currents on localized spectroscopy fatty acid composition quantification and its correction1Univ. Lyon, INSA‐Lyon, Université Claude Bernard Lyon 1, UJM-Saint Etienne, CNRS, Inserm, CREATIS UMR 5220, U1206, F69621, VILLEURBANNE, France, Lyon, France, 2INSERM, UMR 1099, Rennes, France, Rennes, France, 3Univ Rennes 1, LTSI, Rennes, France, Rennes, France, 4Department of Physiology, Faculty of Biology and Medicine, University of Lausanne, Lausanne, Lausanne, Switzerland, 5Centre de Recherche en Nutrition Humaine Rhône-Alpes (CRNH-RA), Centre Hospitalier Lyon Sud, Pierre-Bénite, Lyon, France, 6Hospices Civils de Lyon, Département d'imagerie digestive, CHU Edouard Herriot, Lyon, Lyon, France
Synopsis
Monte Carlo simulations and in vivo measurements on human abdominal adipose tissue were used to analyze the effect of the phase variation induced by eddy currents on localized spectroscopy fatty acid composition quantification (proportion of polyunsaturated, monounsaturated and saturated fatty acid). Monte Carlo simulations showed that base line distortions were able to strongly impact estimation of fatty acid composition. So we proposed a simple method to correct the base line using a second signal acquired with a longer TE. Test-retest variability of quantitative results was reduced using this correction.
Introduction
The quantification of fatty acid –i.e. proportion of polyunsaturated (PUFA), monounsaturated (MUFA) and saturated (SFA) fatty acid- with lipid MRS is a simple and fast tool to analyze metabolic modifications. However these modifications could be very small against the measurement uncertainties related to the current methods. Thus, any source of variability needs to be tracked. In the case of lipid signal, localized short TE (~ 20 ms) MRS sequences, which are widely available on clinical scanners, are typically used. However, short TE and small voxel prescription imply rapidly switched gradients which in turn create eddy currents and lead to base line distortion in the acquired MR spectra. In this work, we study the effect of the base line distortion due to phase variation on the fatty acid quantification and we propose a simple method to correct the effect of eddy current on in vivo lipid MRS using two acquisitions with different TE.Methods
The lipid resonances are fitted by two different methods as a combination of Gaussian and Lorentzian line shapes: LCModel and Mpeak as described below:
LCModel
LCModel with the Control parameter SPTYPE set to ‘Lipid-8’ was used only on in vivo data. In the case of lipid signals, this quantification method fits a flexible combination of Gaussian and Lorentzian line shapes to the lipid resonances1,2.
Mpeak
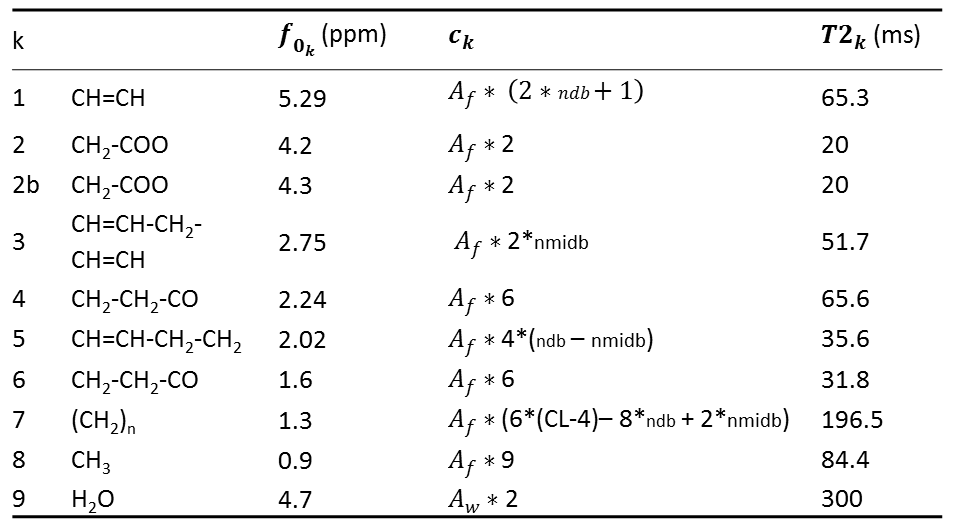
To perform Monte Carlo simulations, we used a model function which permitted to fit Voigt lines shapes3 described by:
[1]
$$f(t)=e^{i\phi_0}\sum_{k=1}^9c_k*e^{\alpha_kt+(\beta_kt)^2+i2{\pi}f_kt}$$
where $$$\phi_0$$$ is the zero order phase, $$$c_k$$$ the amplitudes, $$$\alpha_k$$$ the Lorentzian damping factors, $$$\beta_k$$$ Gaussian damping factors, $$$f_k$$$ the frequency of the kth proton group. The algorithm implementing of Mpeak3 used multiple random starting values for the $$$f_k$$$, $$$\alpha_k$$$ and $$$\beta_k$$$ to compute the starting values of $$$c_k$$$ and $$$\phi_0$$$ using a linear least squares as in AMARES4. Then a nonlinear least squares algorithm was employed to fit the global model function given in [1]. In the Table 1, amplitudes ($$$c_k$$$) were expressed in terms of ndb, nmidb, CL5, Aw and Af. Ratio of amplitudes permitted to estimate ndb and nmidb (Table 1). The proportion of the different fatty acid was then calculated by:
$$PUFA=\frac{nmidb}{3}*100$$
$$MUFA=\frac{(ndb-2*nmidb)}{3}*100$$
$$SFA=100-PUFA-MUFA$$
Monte Carlo Simulation
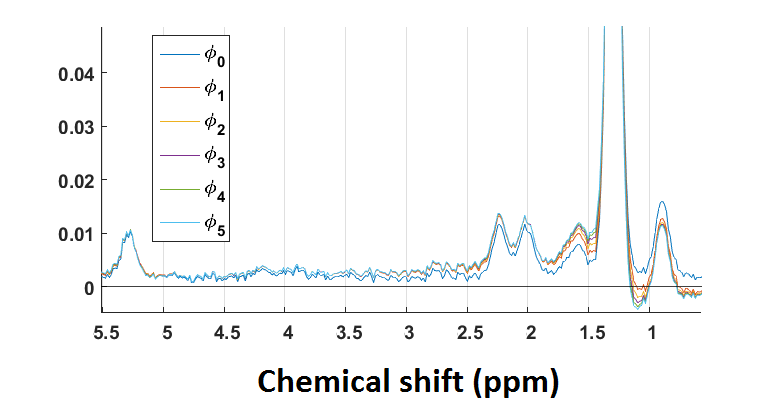
The fatty acid composition of human subcutaneous abdominal adipose tissue6 (18% PUFA, 54.6% MUFA and 27.4% SFA) was used as reference in the simulated data which corresponded to ndbtarget = 2.7, nmidbtarget = 0.54 and CL = 17.47. Monte Carlo simulation was performed using 10-peak lipid signal. A gold standard signal was designed with the equation [1] and one hundred Gaussian noise realizations with zero mean and a variance determined according to the desired SNR were randomly generated and added. $$$c_k$$$ were defined as described in the Table 1 with ndbtarget ,nmidbtarget , Aw = 1 and Af = 37 and then multiplied by exp(-TE/T2k) with TE = 14ms, $$$\alpha_k$$$ were equal to 1 /T2k (T2k in Table 1), $$$\beta_k$$$ = 27.29Hz (T2' = 22ms $$$\beta_k=\sqrt{\frac{1}{4*log(2)*(T2^{'})^2}}$$$) and $$$\phi_0=0$$$. Additionally, phase distortions were introduced to simulate the effect of eddy currents, as illustrated in Figure 1.
In vivo acquisitions
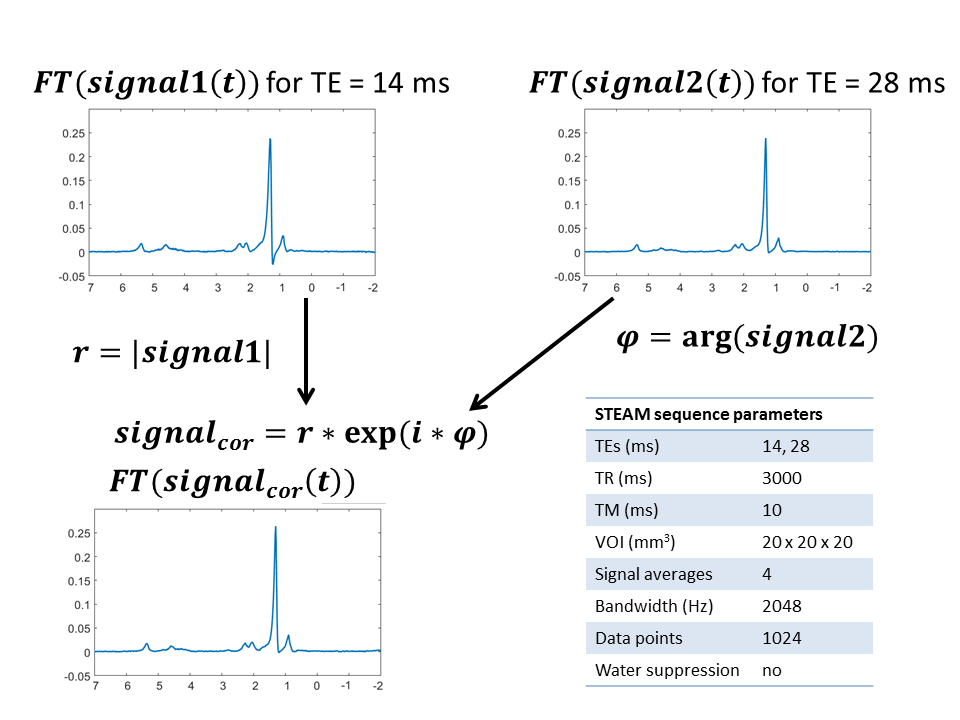
Nine volunteers underwent a STEAM sequence, using respiratory triggering, on a Philips Ingenia 3T system on abdominal subcutaneous adipose tissue using two TE (parameters in Figure 2). MR spectra were acquired twice in a row to measure the test-retest variability of the quantification methods as:
$$Var=\frac{1}{9}\sum_{i=1}^9\frac{{\mid}test_i-retest_i{\mid}}{(test_i-retest_i)/2}*100$$
LCModel and Mpeak methods were applied only on the spectrum of the first echo with and without the phase correction, described in details in Figure 2, which exploit the phase term of the second echo acquisition free from phase variation due to eddy current.
Results
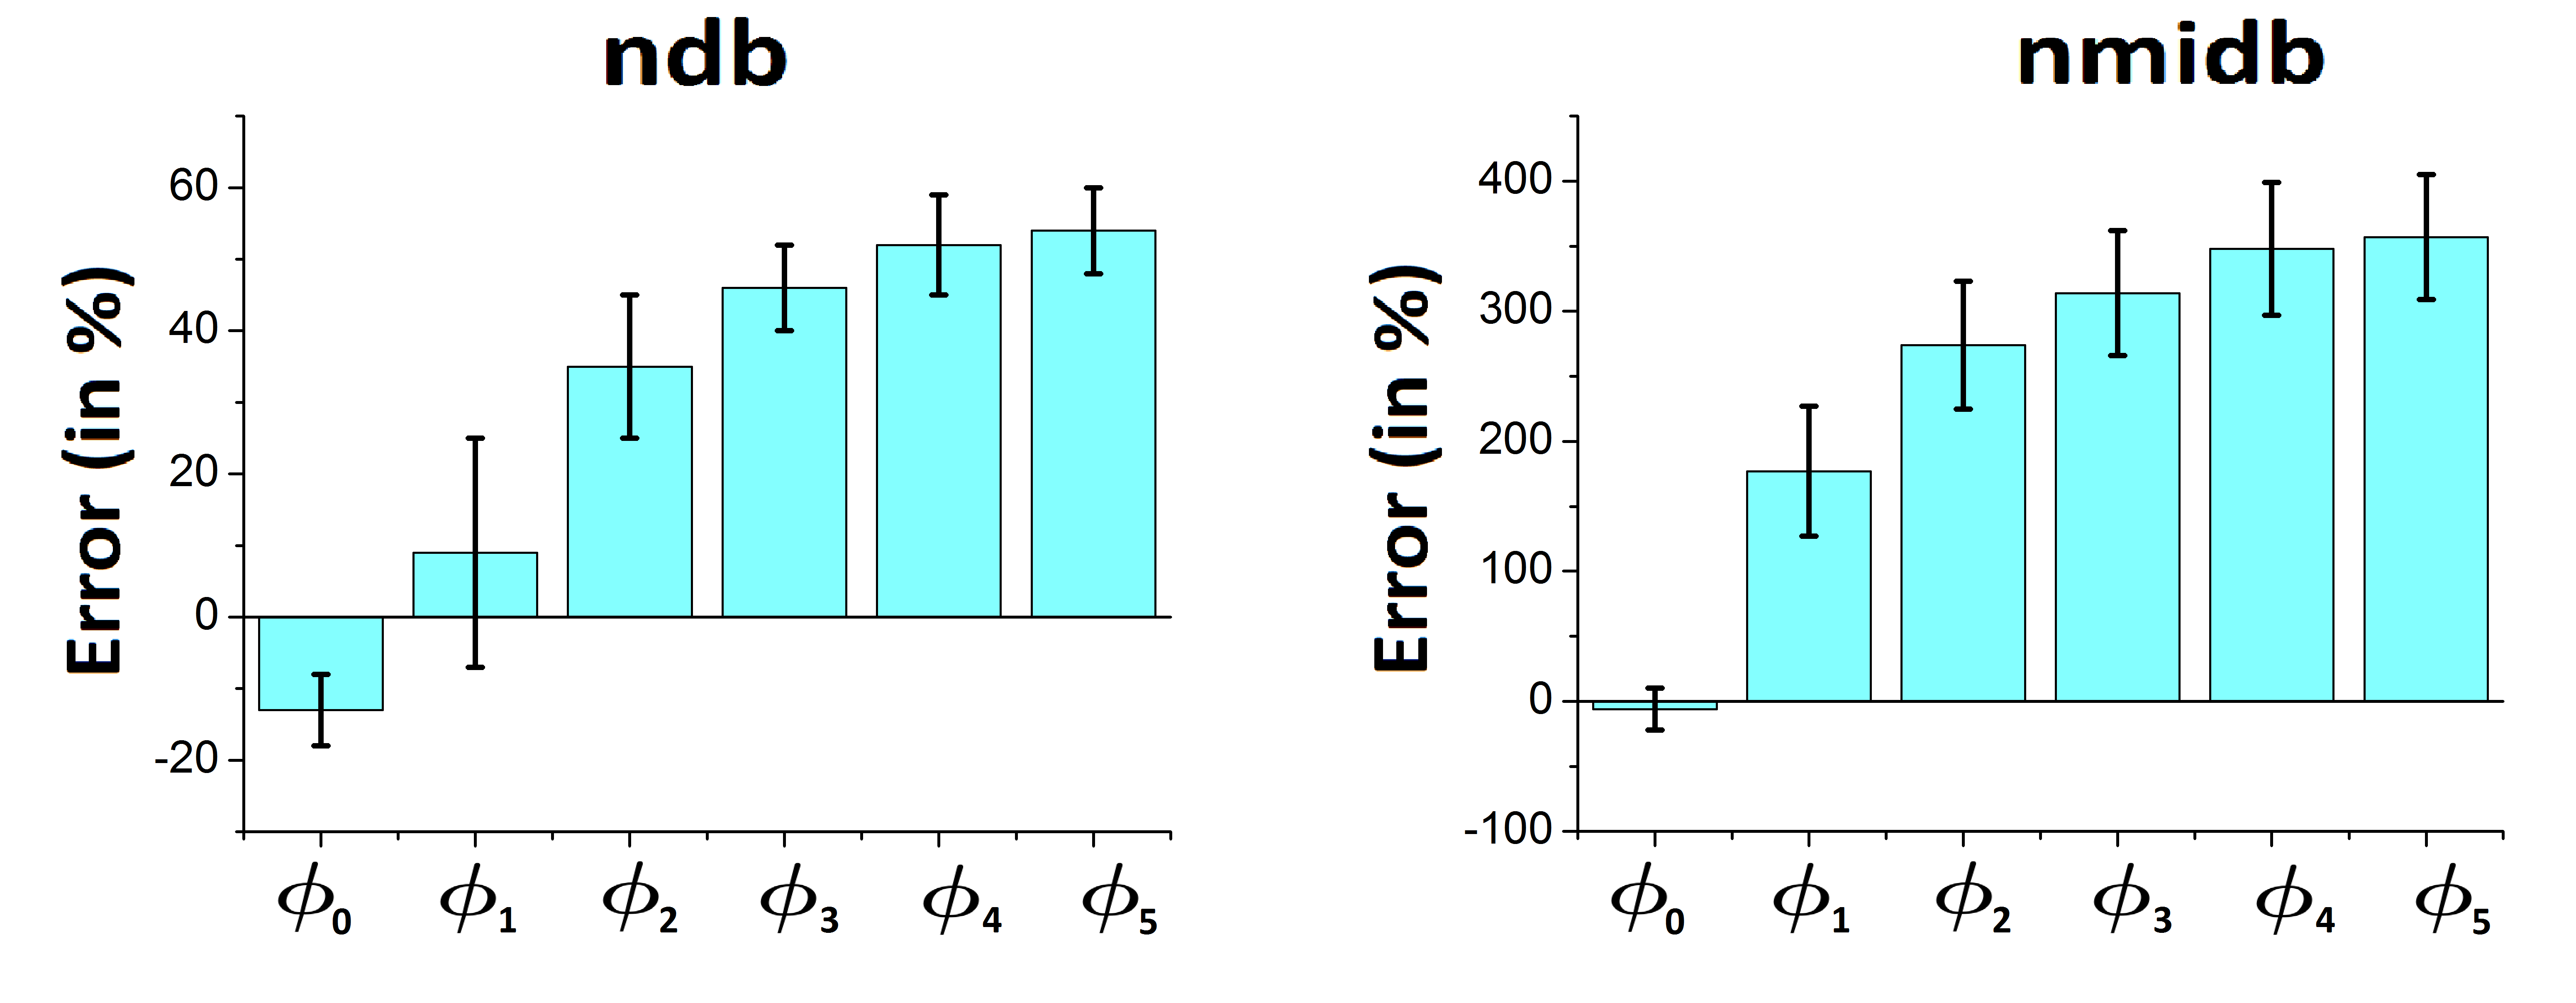
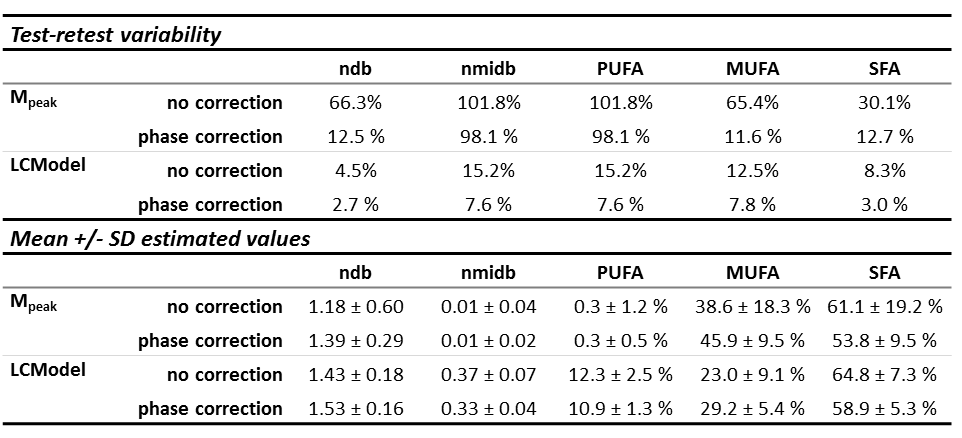
Monte Carlo simulation (Figure 3) showed an increase of the error and of the variability in the estimation of ndb and nmidb with the base line distortion. LCModel results were compared without and with phase correction (Table 2). The mean estimated values of ndb, nmidb, PUFA, MUFA and SFA was equivalent in both cases. Test-retest variability percentage was better with the phase correction than without this correction.Discussion/ Conclusion
Base line distortions due to eddy current can strongly impact estimation of fatty acid composition. So we proposed a simple method to correct the base line, but with the constraints of acquiring a second signal. In the implementation of LCModel, there is probably a method to correct the base line. However, here we demonstrated that processing a correction of the spectrum before using LCModel permitted to reduce the test-retest variability.Acknowledgements
LABEX PRIMES (ANR-11-LABX-0063), program "Investissements d'Avenir" (ANR-11-IDEX-0007), IHU Opera and PHRC-IR Visfatir.References
- Provencher SW. Estimation of metabolite concentrations from localized in vivo proton NMR spectra. Magn Reson Med. 1993 Dec 1;30(6):672–9.
- Provencher SW. Automatic quantitation of localized in vivo1H spectra with LCModel. NMR Biomed. 2001 Jun 1;14(4):260–4.
- Ratiney H, Bucur A, Sdika M, Beuf O, Pilleul F, Cavassila S. Effective voigt model estimation using multiple random starting values and parameter bounds settings for in vivo hepatic 1H magnetic resonance spectroscopic data. In: 2008 5th IEEE International Symposium on Biomedical Imaging: From Nano to Macro. 2008. p. 1529–32
- Vanhamme L, van den Boogaart A, Van Huffel S. Improved Method for Accurate and Efficient Quantification of MRS Data with Use of Prior Knowledge. J Magn Reson. 1997 Nov 1;129(1):35–43.
- Hamilton G, Schlein AN, Middleton MS, Hooker CA, Wolfson T, Gamst AC, et al. In vivo triglyceride composition of abdominal adipose tissue measured by 1H MRS at 3T. J Magn Reson Imaging. 2017 mai;45(5):1455–63.
- Garaulet M, Hernandez-Morante JJ, Lujan J, Tebar FJ, Zamora S. Relationship between fat cell size and number and fatty acid composition in adipose tissue from different fat depots in overweight/obese humans. Int J Obes. 2006 Jan 31;30(6):899–905
Figures