3846
High Resolution Semi-LASER Localized Echo Planar Spectroscopic Imaging at Ultra High Field1Technische Universität München, Munich, Germany, 2GE Healthcare, Munich, Germany, 3MR Applied Science Lab Europe, GE Healthcare, Berlin, Germany, 4MR Applied Science Lab, GE Healthcare, Menlo Park, CA, United States, 5Department of Radiology and Biomedical Imaging, University of California San Francisco, San Francisco, CA, United States
Synopsis
This work presents a robust framework for fast high-resolution 1H MRSI at 7 Tesla using semi-localized by adiabatic selective refocusing (semi-LASER) and high-bandwidth symmetric echo planar spectroscopic imaging (EPSI). Inconsistencies in the symmetric EPSI trajectory are corrected using a single shot water reference scan, effectively removing spectral ghosting. With the proposed methodology, high-resolution metabolite ratio maps that show correlation with anatomical structures were obtained under 5-minutes.
Introduction
Proton MR Spectroscopic Imaging (MRSI) at 7T allow the detection of low concentration metabolites in the brain with a larger chemical shift dispersion and improved SNR. However, major challenges need to be addressed to achieve the theoretical signal improvements at high field strengths. The presence of strong B0 and B1 inhomogeneities degrade signal quality and spectral resolution. Long TRs are often required due to specific absorption rate (SAR) limitations, extending acquisition time. Moreover, nuisance signal contributions from water and lipids introduce artifacts that hinder the reliable quantification of metabolites. In this work, we present a robust framework for 1H MRSI that enables fast high-resolution acquisitions at ultra-high field. The method achieves a significant reduction in acquisition time by implementing a high-bandwidth symmetric EPSI readout1,2 in combination with semi-LASER3,4 spatial localization and VAPOR water suppression5. Furthermore, an effective correction for symmetric EPSI using a single shot water reference scan is introduced to reduce spectral ghosting.Methods
The proposed MRSI sequence (Fig.-1) combines VAPOR water suppression and semi-LASER spatial localization with a ramp-sampled symmetric EPSI readout, which requires fewer repetitions to fully sample k-space, thus reducing the scanning time and keeping the total acquisition within the SAR limits. A significant reduction of SAR per excitation was achieved using GOIA-WURST adiabatic pulses6,7.
Inconsistencies in the symmetric EPSI trajectory that typically corrupt the acquired spatio-temporal (k-t space) signal and cause spectral ghosting, were corrected adapting the method described for k-space alignment in EPI8. The linear and first order phase correction terms were obtained from a water reference scan acquired without phase encoding gradients.
Initially, the phase difference φtdiff(k) between adjacent temporal points of the water reference signal rt(k) is computed, where t and k represent the temporal and k-space locations, respectively. Then, a first-order fit is performed in using weighted least squares to retrieve the phase correction term $$\varphi_t^{\textrm{corr}}(k) = \textrm{a}_t k+ \textrm{b}_t\approx\varphi_t^{\textrm{diff}}(k),$$ where at and bt correspond to the linear and constant phase correction coefficients. The correction terms are then applied to every phase encode and channel of the water suppressed scan.
Data acquisition: MRSI measurements of three healthy volunteers (V1-V3) were acquired on a GE 7T MR950 scanner (GE Healthcare, Waukesha, WI, USA) using a 32-channel receive array with a volume-transmit head coil (NOVA Medical, Wilmington, MA, USA). A 6-minute protocol was used consisting of: (i) a water-suppressed semi-LASER EPSI scan with four averages and a total duration of 4.8 minutes; (ii) a 3-second water-unsuppressed reference scan, with the same prescription and no phase-encoding gradients, used for phase correction (PC); and (iii) a 1.2-minute fully encoded water reference used for eddy-current correction (ECC). Prior to the MRSI acquisition, T1-weighted (T1w) images were acquired and the flip angle of VAPOR was calibrated to achieve optimal water suppression. The following parameters were used: TE/TR=35/3000 ms, matrix size 24×24, field of view 12x12 cm2, 512 spectral points and 2500 Hz spectral bandwidth.
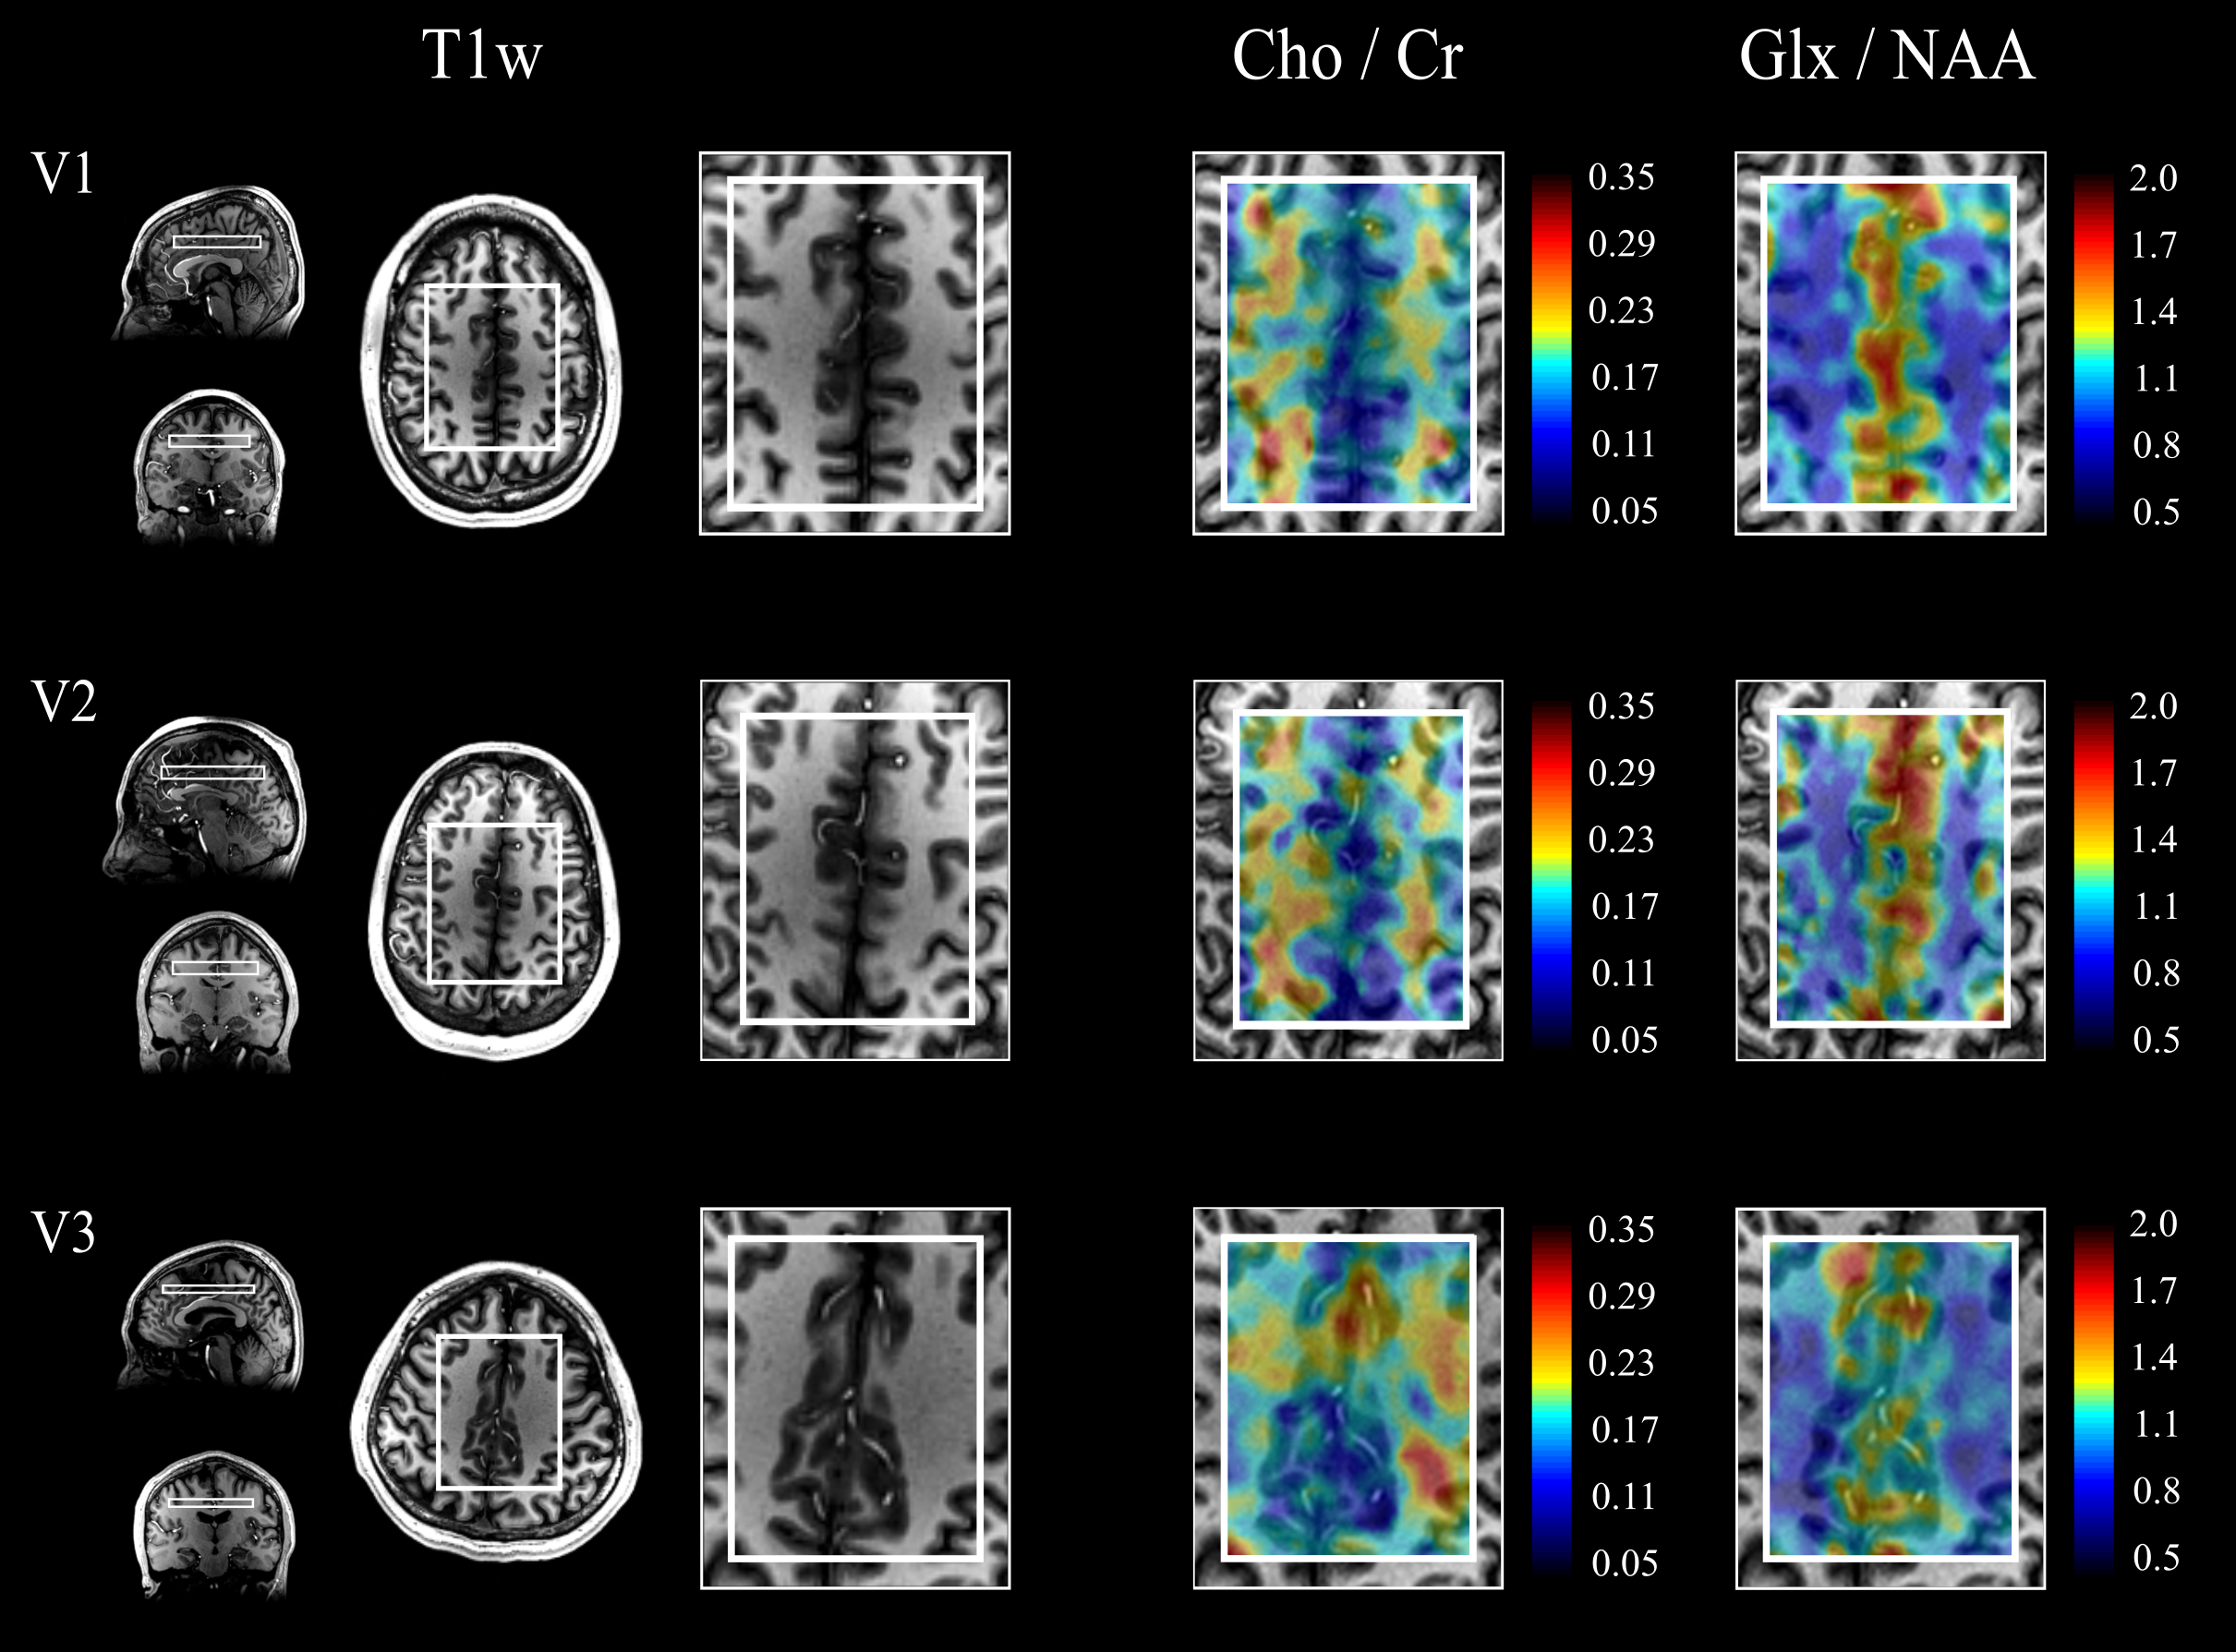
Data Processing: EPSI data was reshaped into k-t space, even lines were flipped and an 8-Hz Gaussian temporal apodization was applied. The reconstruction was performed with the following pipeline: phase correction of k-t signal, spatial Fourier transform, channel combination, zero-order phase removal, residual water removal using Hankel singular value decomposition (HSVD), and temporal Fourier transform. Metabolite ratio maps of the main metabolic components, choline (Cho), creatine (Cr), glutamate and glutamine (Glx) and N-acetyl-aspartate (NAA); were generated using LCModel with simulated basis spectra.
Results and Discussion
Fig.-2 shows the prescribed water reference and water suppressed scans and a qualitative comparison of PC and ECC in two representative spectra. An effective removal of spectral ghosts in the signal, caused by inconsistencies in symmetric EPSI trajectories, was achieved with the proposed PC with a negligible increase in acquisition time. The effect of performing this correction in the original water reference signal is shown (Fig.-3c and Fig.-3d) and quantified (Fig.-3e). Metabolite ratio maps were reconstructed from the acquired signal, showing noticeable contrast that follows gray and white matter structures (Fig.-5).Conclusion
The high-resolution MRSI framework presented in this work enables robust acquisitions in clinically feasible times and within SAR limits by addressing the main challenges of MRSI at ultra-high field. Semi-LASER spatial localization and VAPOR water suppression reduce contamination of water and lipid signals using B1-insensitive adiabatic refocusing pulses. The proposed PC method for ramp-sampled symmetric EPSI effectively removes spectral ghosting and allows the even and odd lines in the EPSI readout to be jointly reconstructed, enabling a high-bandwidth accelerated acquisition. Furthermore, high-resolution (0.25-0.375 ml) metabolite ratio maps showing correlation with anatomical structures were obtained with the presented methodology.Acknowledgements
This work was partially supported by the Bavarian California Technology Center (BaCaTeC) and the National Council of Science and Technology (CONACyT).References
[1] Posse S et al. Three-dimensional echo-planar MR spectroscopic imaging at short echo times in the human brain. Radiology. 1994;192(3):733–738.
[2] Posse S et al. High Speed 1H Spectroscopic Imaging in Human Brain by Echo Planar Spatial‐Spectral Encoding. Magn Reson Med. 1995;33(1):34–40.
[3] Scheenen TW et al. Short echo time 1H-MRSI of the human brain at 3T with minimal chemical shift displacement errors using adiabatic refocusing pulses. Magn Reson Med. 2008;59(1):1–6.
[4] Scheenen TW et al. Towards 1H-MRSI of the human brain at 7T with slice-selective adiabatic refocusing pulses. MAGMA. 2008;21(1–2):95–101.
[5] Tkác I et al. In vivo 1H NMR spectroscopy of rat brain at 1 ms echo time. Magn Reson Med. 1999;41(4):649–56.
[6] Andronesi OC et al. Spectroscopic imaging with improved gradient modulated constant adiabaticity pulses on high-field clinical scanners. J. Magn. Reson. 2010; 203(2): 283–293.
[7] Deelchand D. et al. Across-vendor standardization of semi-LASER for single-voxel MRS at 3 Tesla. ISMRM Spectroscopy Workshop 2016.
[8] Hinks R et al. Method and System for Image Artifact Reduction Using Nearest-Neighbor Phase Correction for Echo Planar Imaging. US Patent 7,102,352.
Figures