3843
Comparison of Compressed Sensing Reconstruction for 3D Echo Planar Spectroscopic Imaging data using Total Variation and Statistically Optimized Perona-Malik Non-linear Diffusion1Radiological Sciences, University of California, Los Angeles, Los Angeles, CA, United States, 2Medical Image Computing and Signal Processing Laboratory, Indian Institute of Information Technology and Management - Kerala, Trivandrum, India, 3Los Angeles Biomedical Research Institute, Torrance, CA, United States
Synopsis
Conventional magnetic resonance spectroscopic imaging requires long acquisition times. Echo planar spectroscopic imaging (EPSI) significantly reduces the scan time but is limited by conventional phase encoding. Non-uniform sampling and compressed sensing (CS) reconstruction can further accelerated 3D EPSI. We applied a Perona-Malik (PM) non-linear diffusion algorithm for CS reconstruction of 3D EPSI data in both retrospectively and prospectively undersampled phantom and in-vivo data sets, and compared results with those using Total Variation (TV). Our pilot findings demonstrate that PM produces improved reconstruction results compared to TV. Furthermore, PM eliminates the need for parameter tuning, giving it a great advantage over TV.
Introduction
Magnetic Resonance Spectroscopic Imaging (MRSI) enables measurements of metabolic concentrations from multiple locations within a single recording. However, the long acquisition time of conventional 3D MRSI due to incremented phase encoding steps hinders its practical application. Echo-planar spectroscopic imaging1 (EPSI) greatly reduces the acquisition time by simultaneously encoding one spatial and one spectral dimension (x-F), yet is still limited by the inherently slow phase encoding of the other spatial dimensions2 (y-z). Non-uniform sampling (NUS) of ky-kz with compressed sensing (CS) reconstruction has been applied to further accelerate the scan time to within clinically feasible durations3,4. In this study, we apply a Perona-Malik (PM) nonlinear diffusion algorithm5 for CS reconstruction of the 3D EPSI data in both retrospectively and prospectively undersampled phantom and in-vivo data sets, and compare results with those using CS with Total Variation6 regularization.Methods
TV and PM-based CS reconstructions were performed with regularization applied on the combined y-z-F space. A Split-Bregman implementation of TV was used in which the regularization parameter for denoising was chosen empirically as the one giving the best reconstruction quality of the NAA metabolite map. The PM algorithm does not require parameter tuning, as it adaptively finds the optimal diffusivity contrast parameter using an estimate of the mean absolute deviation of the 3D gradient in y-z-F.
A 3D EPSI sequence was used to acquire fully sampled and prospectively undersampled brain phantom and in-vivo brain data sets on a 3T scanner using the following parameters: FOV = 320 x 320 x 120 mm3, matrix size = 32 x 32 x 8, spectral bandwidth = 1163 Hz, spectral points = 512, TE = 41 ms, TR = 1.5 s, and number of averages = 4. Fully sampled data was retrospectively undersampled in ky-kz at reduction factors of 2x, 3x, and 4x using Poisson disk masks. We acquired prospectively undersampled data at 3x from one 31 year-old healthy volunteer and one 57 year-old HIV patient, in accordance with IRB (Institutional Review Board) guidelines. Additionally, fully sampled data was acquired from the HIV patient. Fully sampled scan time was 25.6 minutes.
Reconstruction performance was compared quantitatively using the normalized root-mean-square-error (nRMSE) of metabolite concentration ratios and metabolite maps. Results from the prospective undersampling were qualitatively evaluated through comparisons of the reconstructed metabolite maps. Metabolite maps and metabolite ratios with respect to creatine at 3.0 ppm (Cr 3.0) were calculated for choline (Ch 3.2), N-acetylaspartate (NAA), and glutamine/gluatamate (Glx).
Results
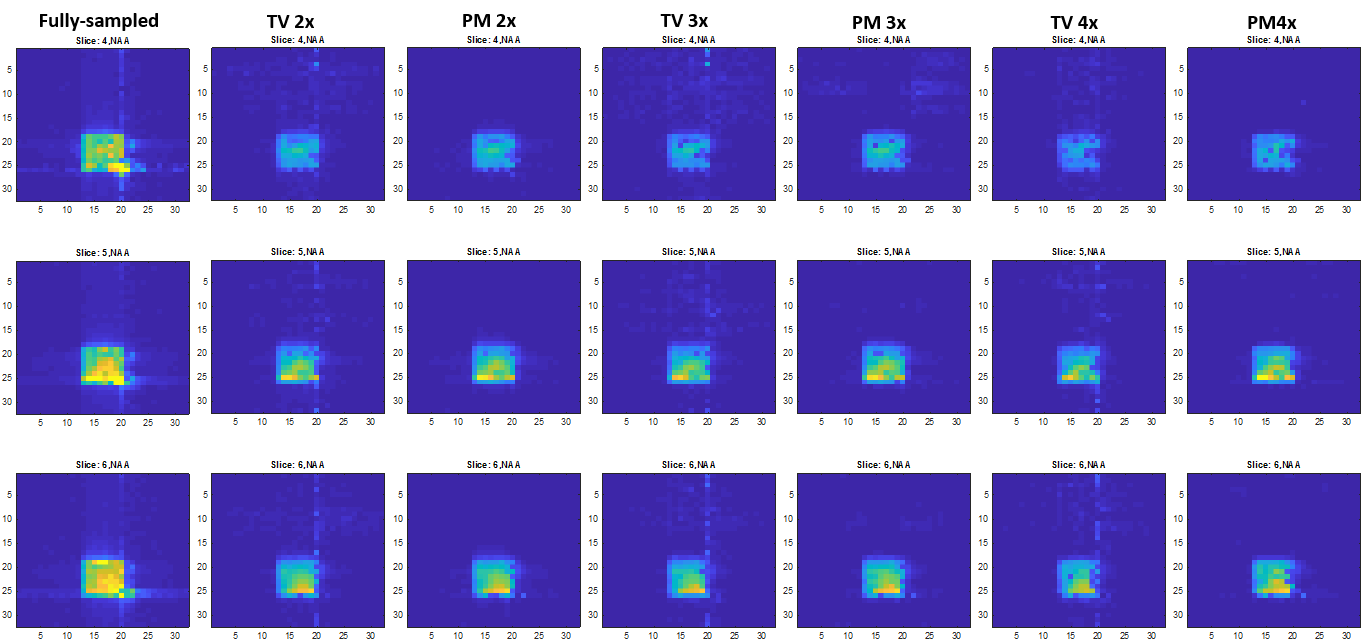
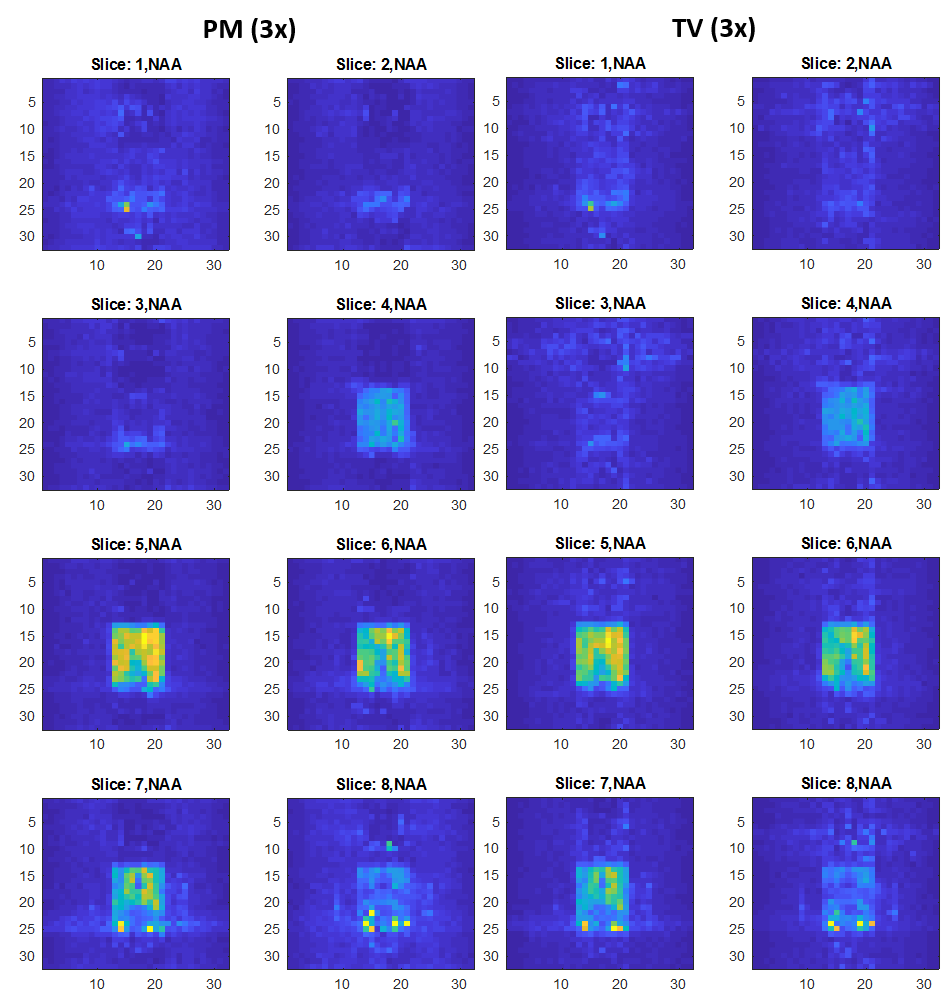
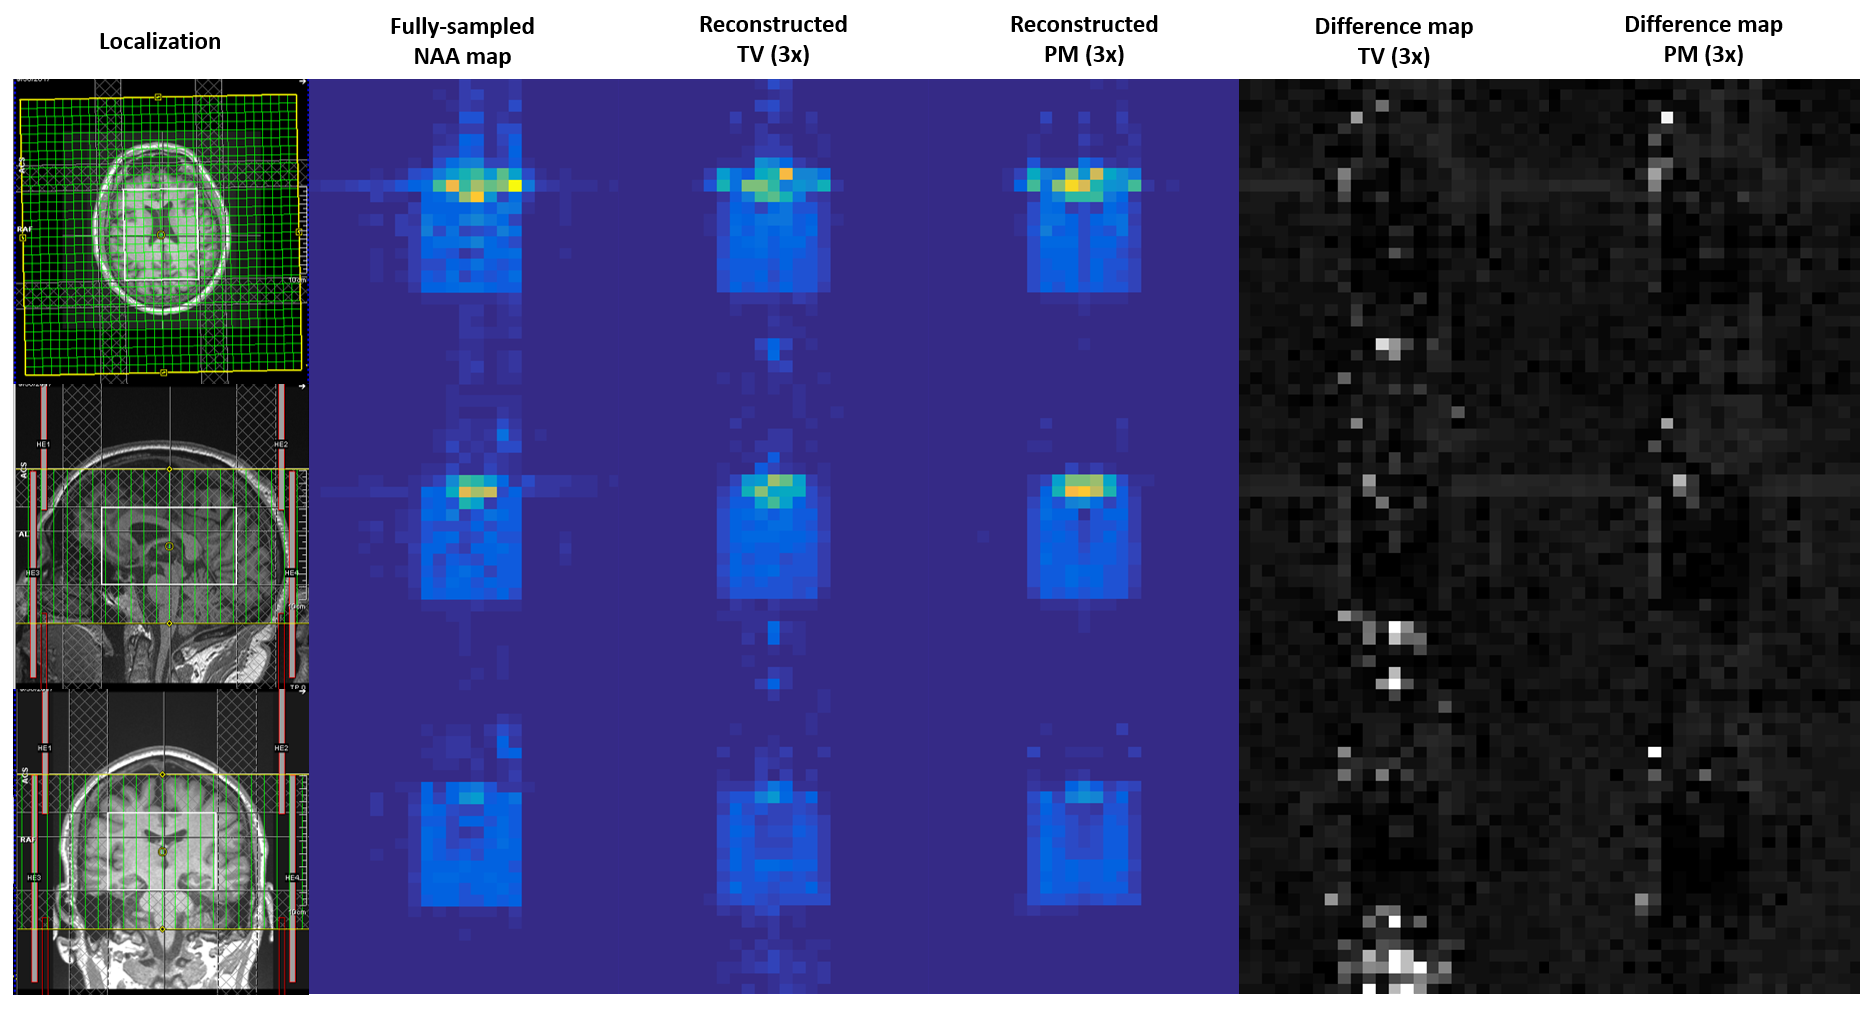
Figure 1 shows the reconstructed NAA metabolite maps from the retrospectively undersampled brain phantom data. As seen from all slices, PM reconstruction results in a better level of denoising than TV. For all acceleration factors, PM recovers the metabolite image with a greater level of fidelity than TV. Aliasing artifacts are also less evident in the PM reconstructed metabolite map. Figure 2 shows the NAA metabolite maps for the prospectively undersampled healthy brain data. At the relatively high acceleration factor of 3x, PM recovers the NAA map with reduced artifacts and improved denoising relative to TV. Figure 3 shows the reconstructed NAA maps from the prospectively undersampled (3x) HIV brain data. The absolute difference images indicate a higher level of reconstruction accuracy of PM compared to TV.
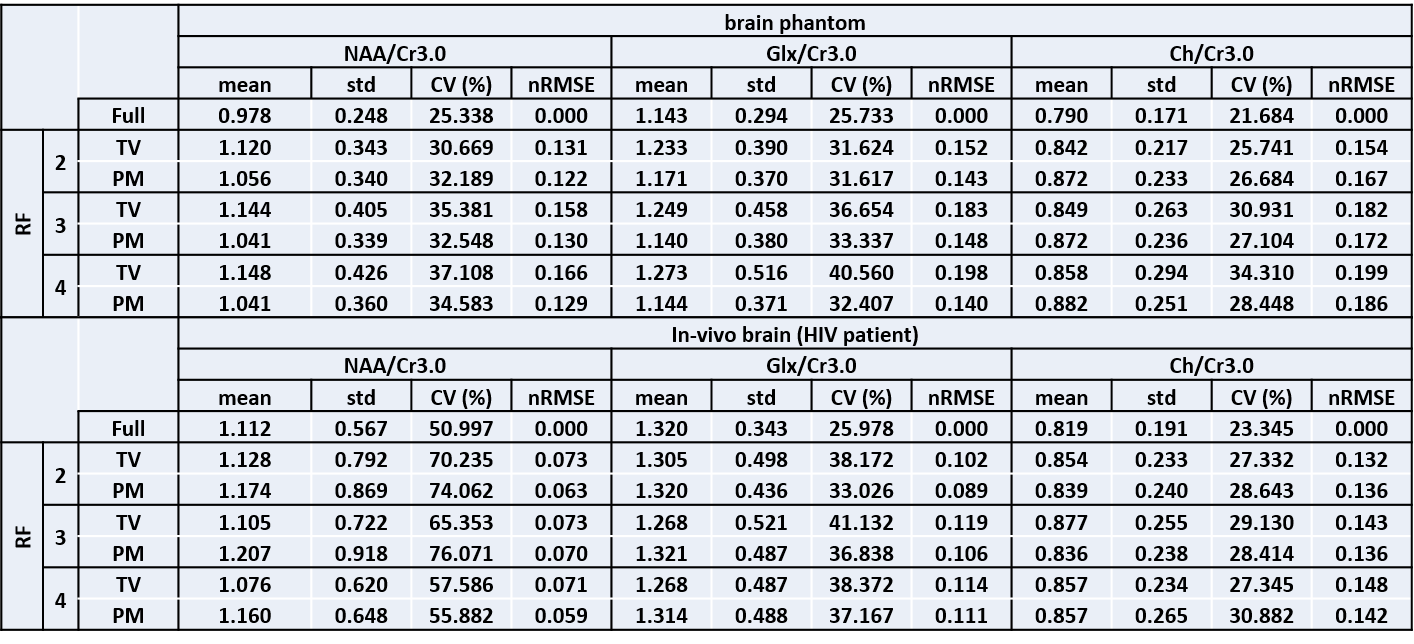
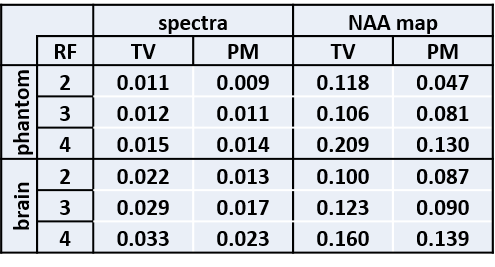
Quantitatively, Table 1 shows that PM more accurately recovers the metabolite ratios for all reduction factors. Table 2 indicates superior performance of PM based on lower nRMSE values of reconstructed spectra and the NAA metabolite map within the volume of interest (VOI).
Discussion
Good recovery of spectral peaks requires tuning of regularization parameter in TV whereas this tuning is not critical for PM diffusion for different datasets. Metabolite maps show reduced nRMSE with application of PM diffusion. The lower nRMSE values of PM indicates that it outperforms TV in denoising the spectra and in reconstructing the undersampled k-space. In terms of quantitation, PM offers a more accurate approach for recovering metabolite ratios compared to TV.Conclusion
Our pilot findings demonstrate that PM is an alternative to TV which is shown to produce improved reconstruction results for both retrospectively and prospectively undersampled 3D EPSI data. Its adaptive estimation of the contrast parameter eliminates the need for parameter tuning, giving it a great advantage over TV regularization.Acknowledgements
No acknowledgement found.References
1. Mansfield P. Spatial mapping of the chemical shift in NMR. Magnetic Resonance in Medicine, 1984; 1(3): 370-386.
2. Posse S., et al. High Speed 1H Spectroscopic Imaging in Human Brain by Echo Planar Spatial-Spectral Encoding. Magnetic Resonance in Medicine, 1995; 33(1): 34-40.
3. Furuyama JK., et al. Application of Compressed Sensing to Multidimensional Spectroscopic Imaging in Human Prostate. Magnetic Resonance in Medicine, 2012; 67(6): 1499-1505.
4. Cao P., Wu E. Accelerated Phase-Encoded Proton MR Spectroscopic Imaging by Compressed Sensing. Journal of Magnetic Resonance Imaging, 2015; 41(2): 487-495.
5. Joy A., Paul J.S. Multichannel Compressed Sensing MR Image Reconstruction using Statistically Optimized Nonlinear Diffusion. Magnetic Resonance in Medicine, 2017; 78(2): 754-762.
6. Goldstein T., Osher S. The Split Bregman Method for L1-Regularized Problems. SIAM J. Imaging Sciences, 2009; 2(2): 323-343.
Figures