3838
Levels of choline-containing compounds are not increased in human liver metastases of colorectal cancer: an assessment by 1H MR spectroscopy1Nuclear Medicine, University Hospital Zurich, Zurich, Switzerland, 2Radiology and Nuclear Medicine, Radboud University Medical Center, Nijmegen, Netherlands, 3Cancer Research UK Cambridge Institute, University of Cambridge, Cambridge, United Kingdom, 4Pathology, Radboud University Medical Center, Nijmegen, Netherlands, 5Medical Oncology, Academic Medical Center, University of Amsterdam, Amsterdam, Netherlands, 6Surgery, Radboud University Medical Center, Nijmegen, Netherlands, 7Medical Oncology, Radboud University Medical Center, Nijmegen, Netherlands
Synopsis
The commonly observed relative signal increase of choline-containing compounds (tCho) in 1H MR spectra of tumors may serve as a diagnostic biomarker. Here we evaluate the potential of this tCho signal in 1H MR spectra of the human liver to assess metastases of colorectal cancers. An increased tCho signal was not observed for these metastases. With increasing tumor volumes, the tissue levels of tCho decreased. The likely reason is a larger necrotic voxel fraction as it correlated with more higher ADC values assessed by diffusion weighted imaging. A Bland-Altman analysis revealed average repeatability in normal livers and poor repeatability in tumors.
Introduction
In 1H MR spectra of malignant tumors, such as in breast, brain and prostate, a high signal for choline-containing compounds (tCho), relative to normal appearing tissue, is commonly observed.1 These higher levels are associated with increased cell membrane turnover during cell proliferation, a poorer differentiation grade and a worse patient outcome. It is unclear if various tumors that may occur in the liver also show a relatively increased tCho.2 Here we evaluate the tCho content in human liver metastases of colorectal cancers, using a common 1H MRS localization sequence.Methods
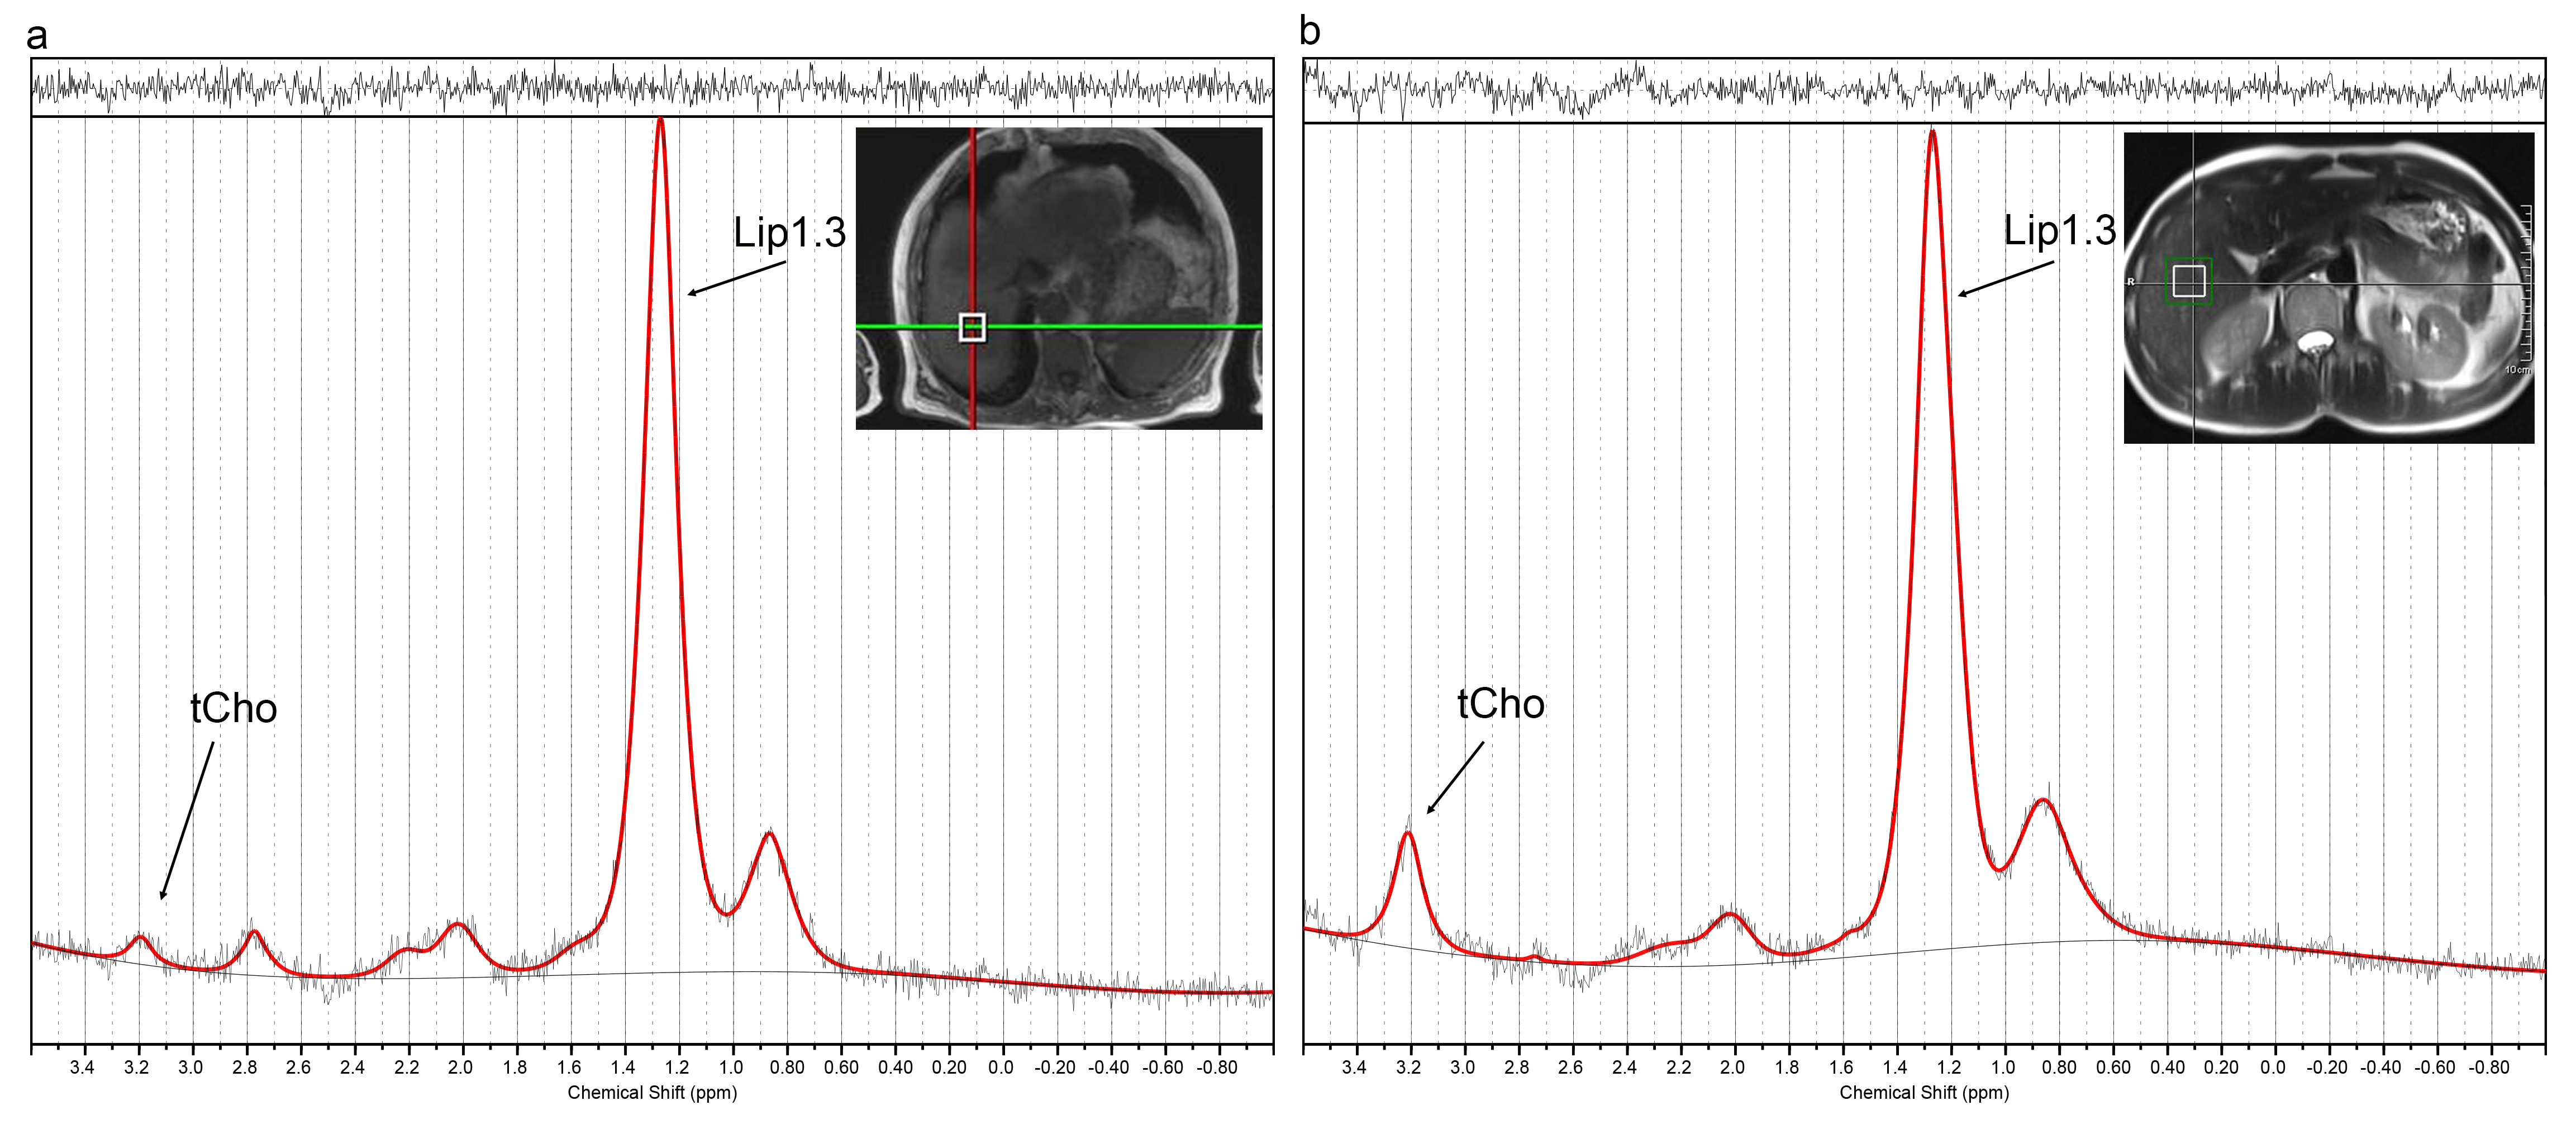
Twelve healthy volunteers and 20 patients with colorectal liver metastases were measured twice with PRESS single voxel MR spectroscopy at 3T. We used TR 2000ms, TE 30ms, bandwidth 1000Hz, vector size 1024, voxel size 20x20x20mm3, weak water suppression and a detection frequency at -1.5ppm from the water resonance, targeting that of choline at 3.2ppm. The number of acquisitions was 132 and individual spectra were phased and frequency aligned before averaging, to correct for motion artefacts. Similar, spectra without water suppression were recorded with a detection frequency on the water resonance and 20 repetitions.
In patients, the voxels were placed in the center of the metastasis guided by conventional T1- and T2-weighted MR images. In healthy volunteers voxels were placed in liver segment 2/3, 5/6 and 7/8. Spectral quality was assessed by 3 spectroscopists in consensus and spectra were only accepted if both repeat exams were of acceptable quality. Spectra were analyzed by LCModel and tissue levels were estimated by water referencing after which they were converted to absolute tissue concentrations in mmol/kg wet weight.3 For each volunteer and patient the arithmic mean of the repeat measurements was calculated.
Diffusion weighted imaging (DWI) was performed (TR 2000ms, TE 82ms, b-values: 50, 300, 600s/mm2, 2x2x6mm3 voxels, respiratory triggering) and the mean and the 90th percentile of all voxel values in a tumor ROI were calculated. Differences between metabolite contents were evaluated using Mann-Whitney and Wilcoxon tests for unpaired and paired nonparametric datasets, respectively. A difference was considered statistically significant when p<0.05. The repeatability of the tCho measurements were analyzed by Bland-Altman.
Results
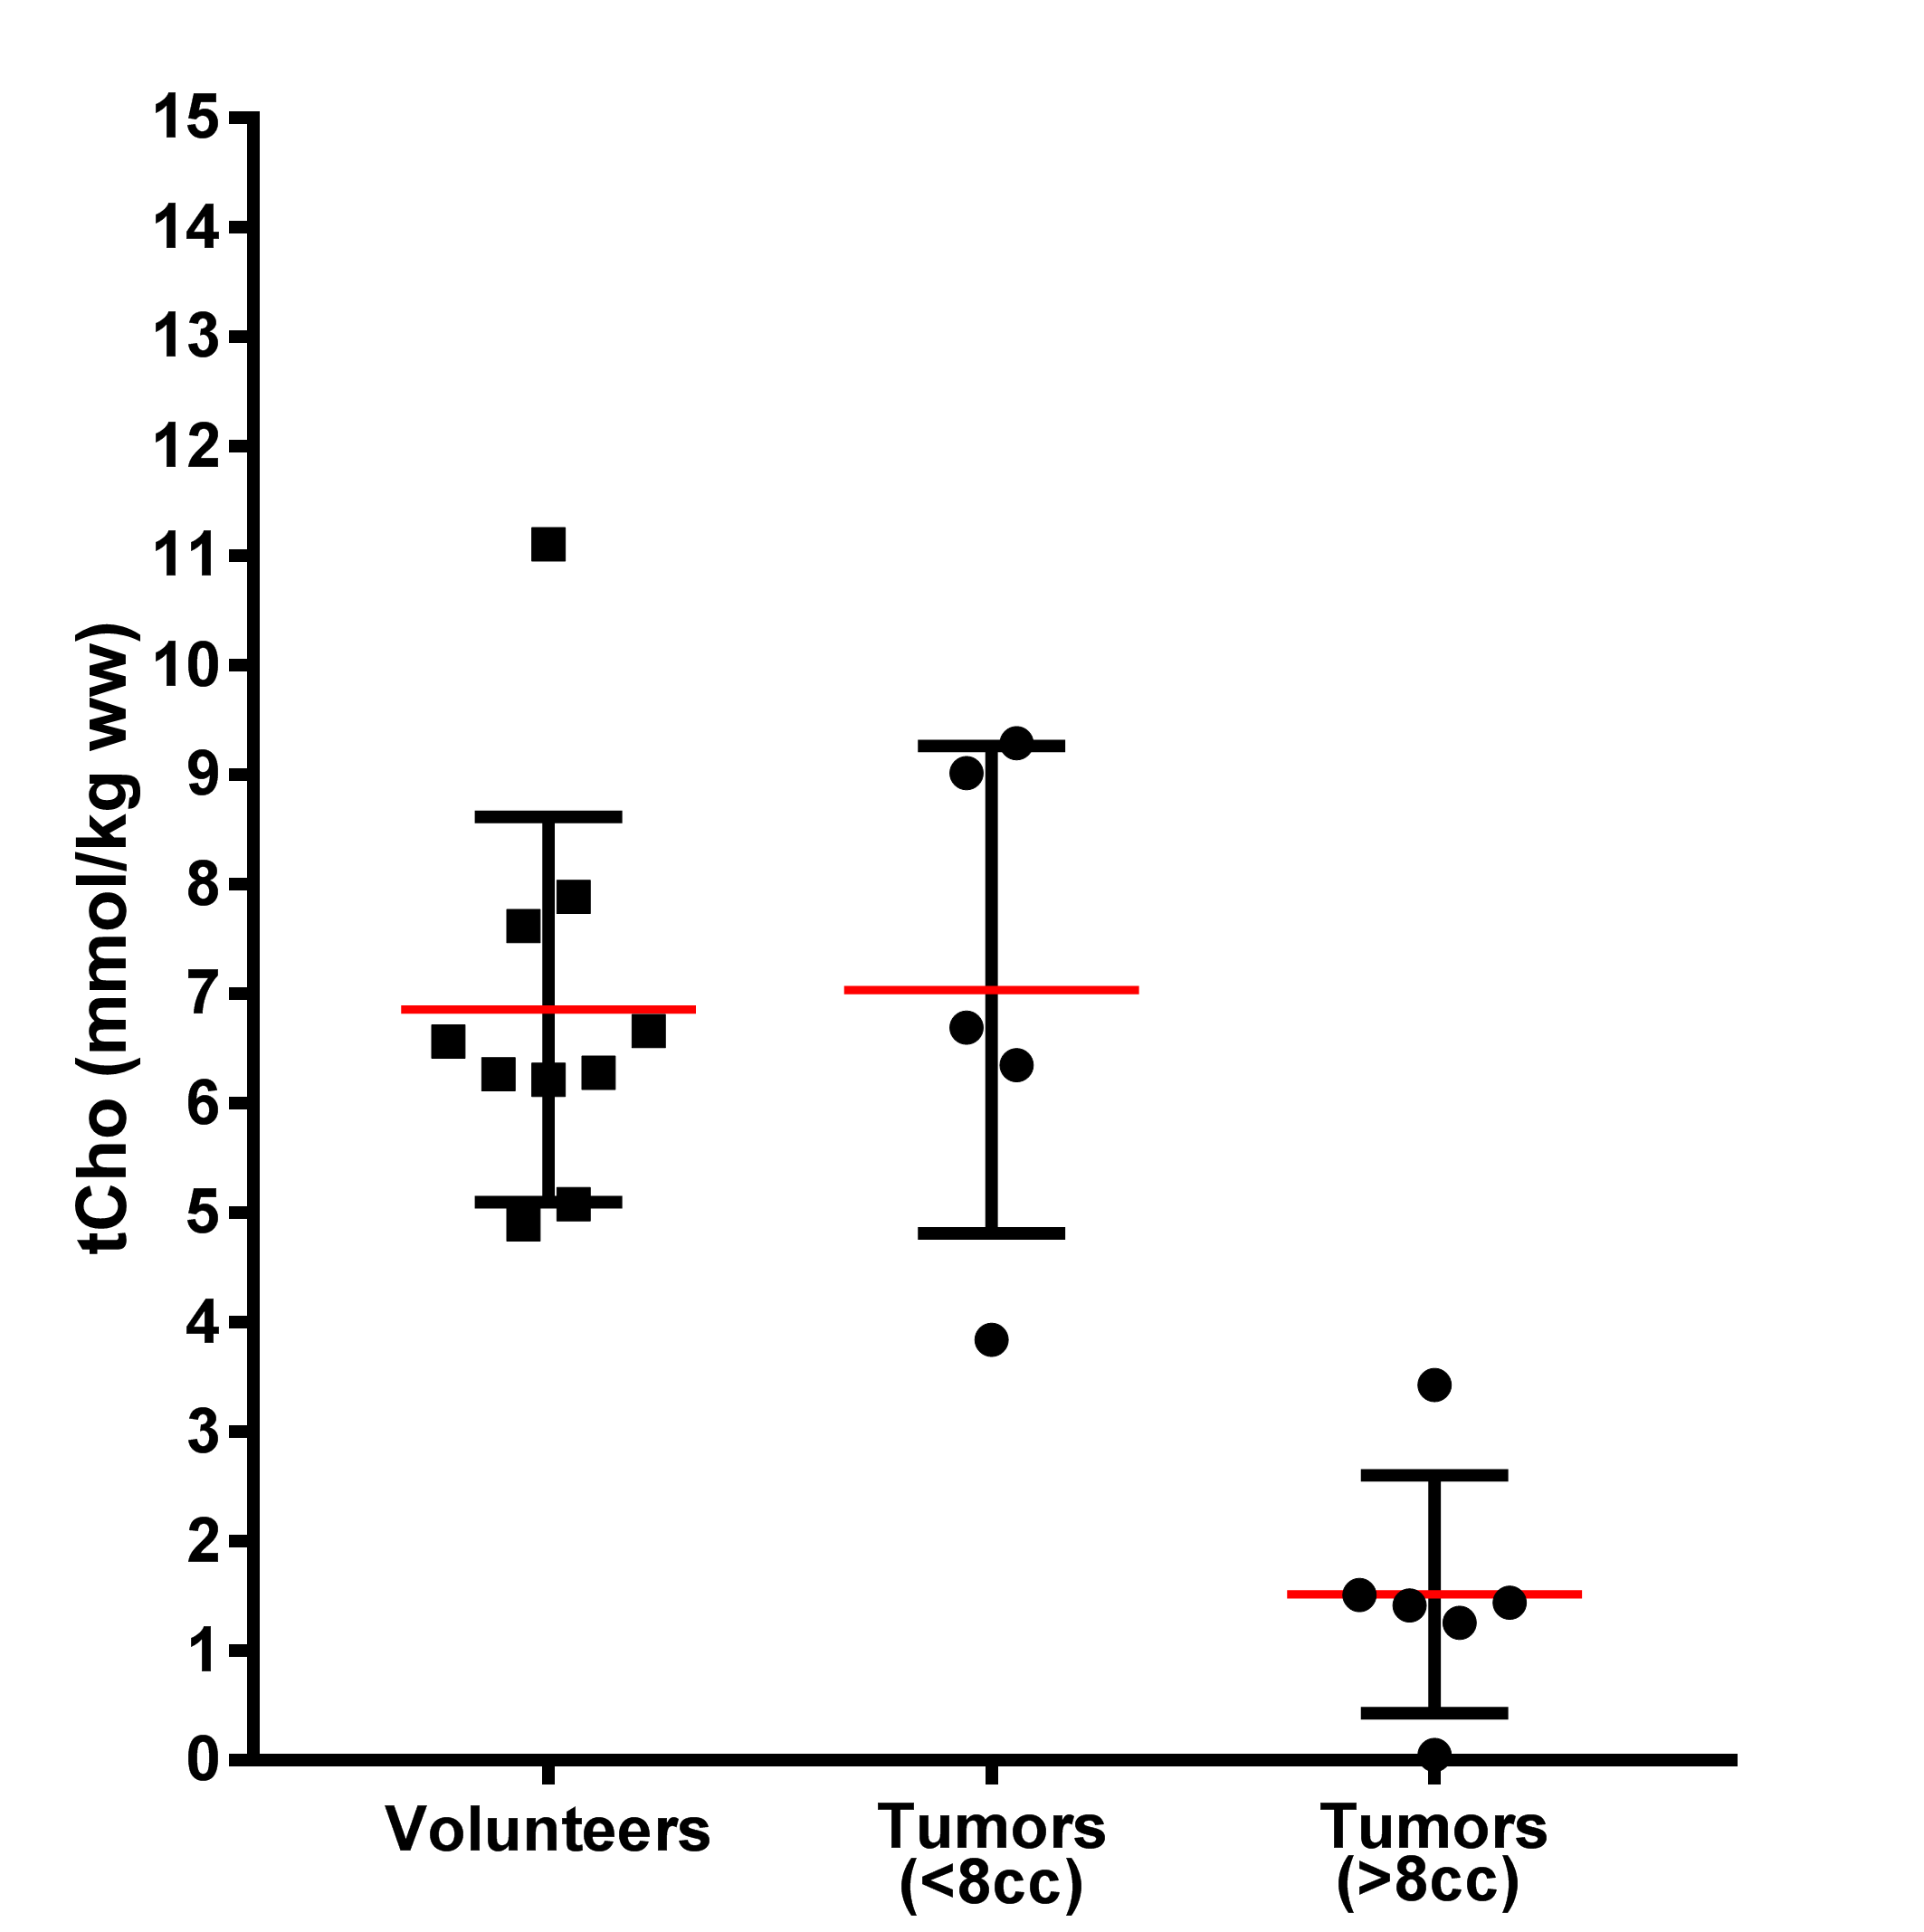
After quality control we included spectra from 11 patients and 10 volunteers (Figure 1). The tCho levels of the liver segments in healthy volunteers were not significantly different and the mean (and range) for tCho concentration in liver of these volunteers was 6.9 (4.9-11.1) mmol/kg wet weight.
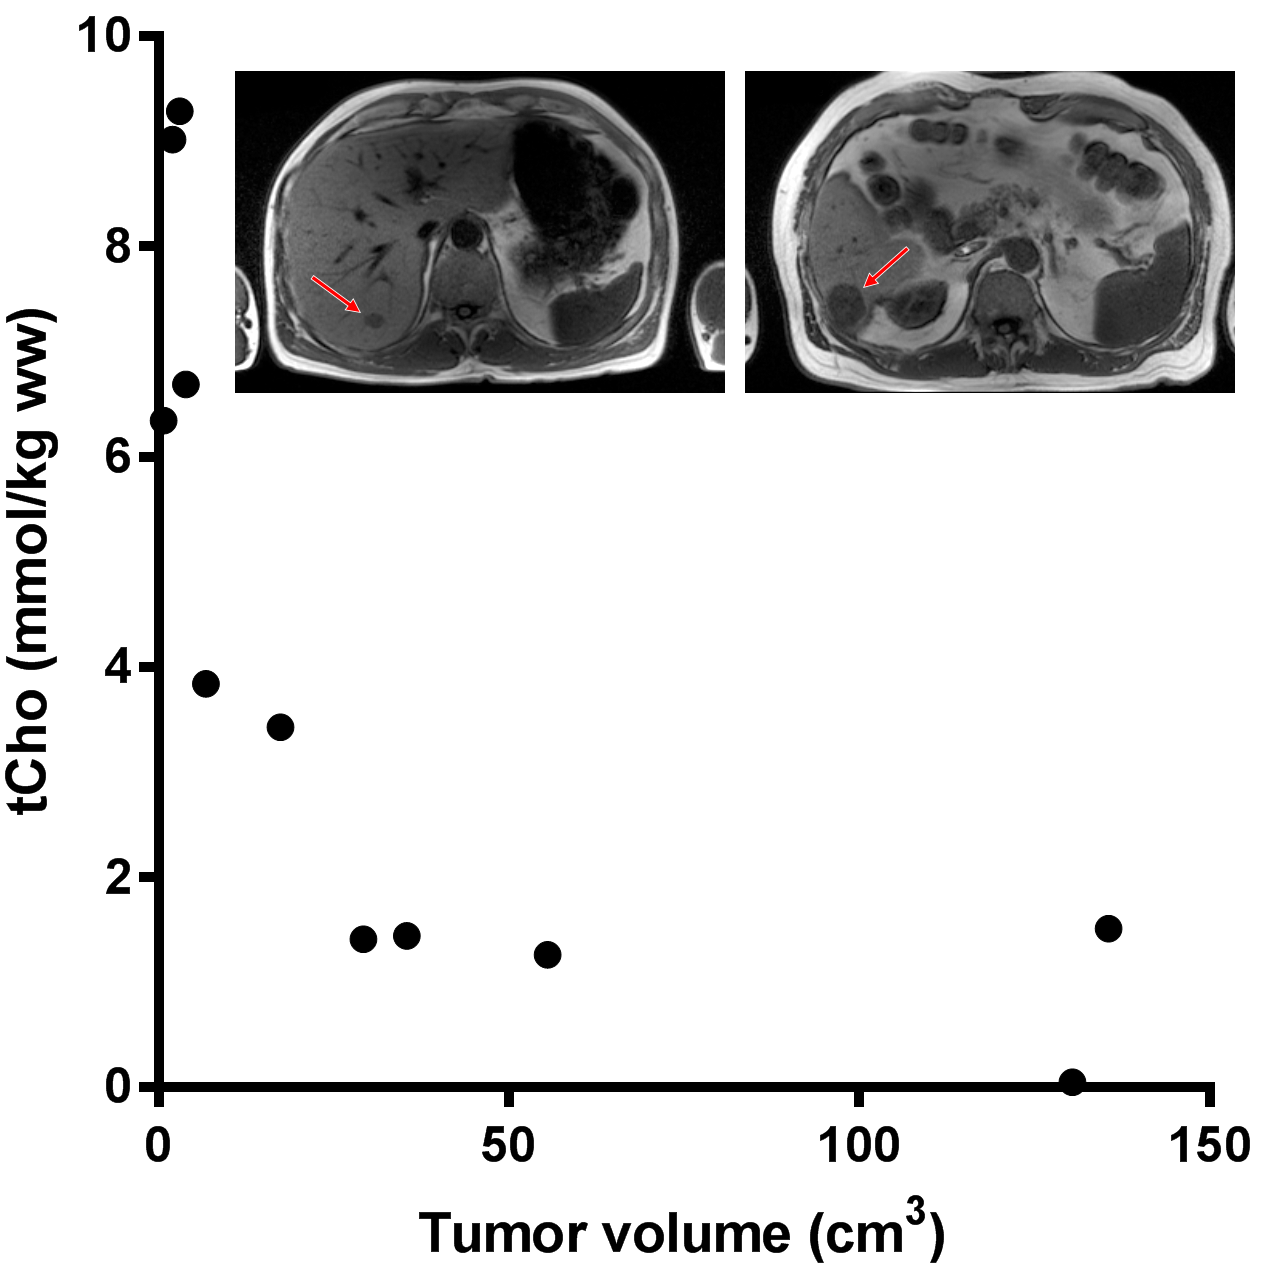
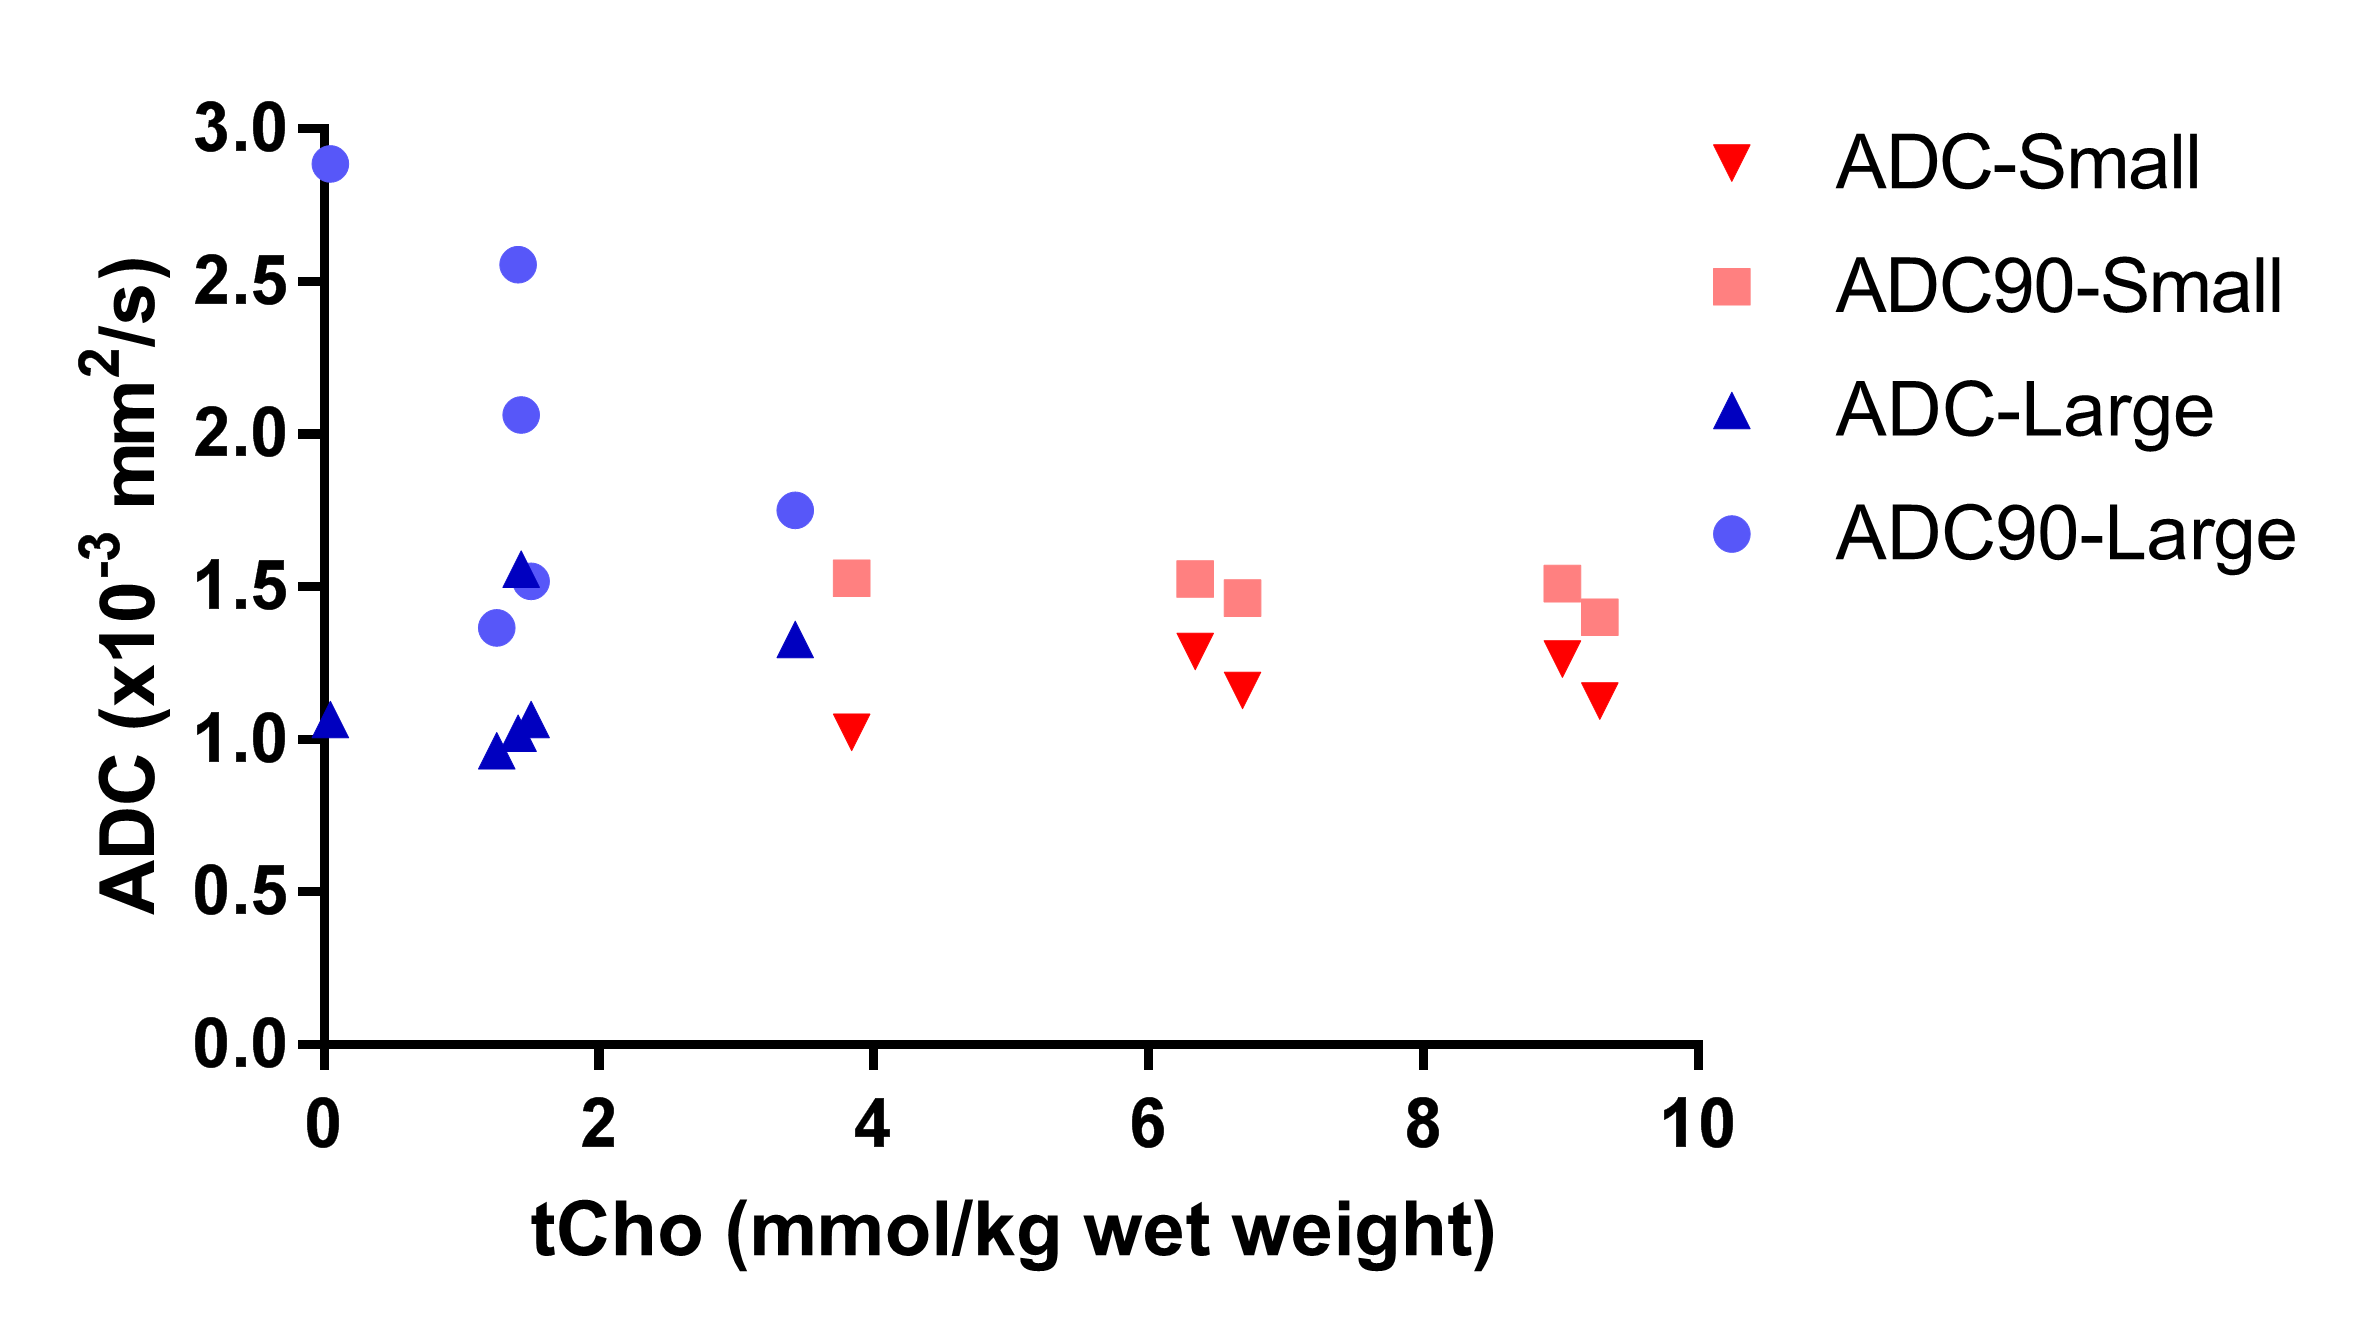
The tCho tissue concentration of tumors in individual patients decreased from about 9.0 mmol/kg wet weight in the smallest 2 cm3 tumor volume to 1.5 mmol/kg wet weight in the largest 136 cm3 volume (Figure 2). This indicates a partial volume effect for the smaller tumors and therefore we separated the spectra in those from tumors larger and smaller than the voxel size (8cm3). The tCho tissue concentration calculated for the small tumors, 7.0 (3.8-9.3) mmol/kg wet weight, was comparable to that of healthy liver. The group with larger tumors was, however, significantly (p<0.01) lower: 1.5 (0.0-3.4) mmol/kg wet weight (Figure 3). To assess the nature of this difference we measured the ADC values of the voxel ROIs and observed a higher percentile of the ADC in larger lesions (Figure 4), indicating a contribution of necrosis to these lesions.
The coefficient of repeatability in volunteers, in small (<8cm3) and larger tumors in patients was respectively 2.8, 9.3, and 2.6, corresponding to fractional repeatabilities of 0.4, 1.3, and 1.7 respectively.
Discussion
The tCho content estimated from single voxel 1H MRS of liver metastasis of colorectal cancer was either similar or smaller than that of normal liver tissue. Considering reported relaxation times for normal and tumorous liver tissue [e.g.3,4] this cannot be explained by relaxation time differences. This relatively low tCho content for metastasis may be due to the high background tCho signal for normal liver, to the presence of tumor necrosis, to an intrinsic lower tCho content of metastatic tissue or to a redistribution of the tissue content of different choline containing compounds, without an observable net change in the tCho signal. A Bland-Altman analysis revealed average repeatability in normal livers and poor repeatability in tumors, probably due to tumor heterogeneity and partial volume effects with normal appearing tissue. To minimize these effects spectroscopic imaging with small voxels and further movement correction would be desirable.5,6Conclusion
An increased tCho signal was not observed in 1H MR spectra of liver metastasis of colorectal cancer. With increasing tumor volumes, tCho tissue levels decreased with more higher ADC values, indicating a larger necrotic voxel fraction.Acknowledgements
No acknowledgement found.References
1. Glunde K, Bhujwalla ZM, Ronen SM, Choline metabolism in malignant transformation. Nat. Rev. Cancer, 2011;11:835-848
2. Fischbach F, et al. Quantitative proton magnetic resonance spectroscopy of the normal liver and malignant hepatic lesions at 3.0 Tesla. Eur. Radiol. 2008;18:2549-2558
3. Ouwerkerk R, Pettigrew RI, Gharib AM, Liver metabolite concentrations measured with 1H MR spectroscopy. Radiology 2012;265:565-575
4. Weis J, et al. Multiple breath-hold proton spectroscopy of human liver at 3T. Relaxation times and concentrations of glycogen, choline and lipids. J Magn Reson Imaging 2017
5. Steinseifer IK, et al. Improved volume selective (1) H MR spectroscopic imaging of the prostate with gradient offset independent adiabaticity pulses at 3 tesla. Magn. Reson. Med. 2015;74:915-924
6. Hock A, et al. Navigator based respiratory gating during acquisition and preparation phases for proton liver spectroscopy at 3T. NMR Biomed 2014;27(3):348
Figures