3836
CEST MRI to contrast chondrosarcoma tumors: two contrasts in one acquisition.1Université Clermont Auvergne, INSERM, U1240 Imagerie Moléculaire et Stratégies Théranostiques, Clermont-ferrand, France, 2AgroResonance - UR370 QuaPA, Saint Genès Champanelle, France
Synopsis
This study aims to develop a non-invasive CEST MRI method to evaluate simultaneously pH and glycoaminoglycans (GAG) as a new imaging method for assessing hypoxic and chondrogenic status in chondrosarcoma in vivo.
Introduction
Chondrosarcoma is a malignant tumor of cartilage characterized by a chondrogenic-rich extracellular matrix, i.e. poorly vascularized and rich in proteoglycans (PGs)1. These characteristics make this tumor both chemo and radio-resistants and thus difficult to cure. The development of new bispecific strategies which targets these two main characteristics offer a new approach to specifically target address cytotoxic agents. The strategy consists in linking a vector (a quaternary ammonium which targets PG2,3,4 to a hypoxia-activated prodrug5. If the hypoxic status of the tumors can be assessed by nuclear imaging with 18F MISO6 and proteoglycan status by 99mTc NTP 15-5 scintigaphy7,8,9 it requires however 2 separated acquisitions. Furthermore, the accuracy of these methods is still highly discussed. In this context we propose to develop an MR strategy based on Chemical Exchange Saturation Transfer (CEST) to simultaneously co-register both hypoxia (by assessing pH) and PGs (by quantifying glycoaminoglycans (GAG) content). The relevance of CEST MRI method will be validated in regards of standard MRI techniques to estimate pH and GAG concentration in vivo, i.e. by 31P MRS10 and 23Na MRI11, respectively.Methods
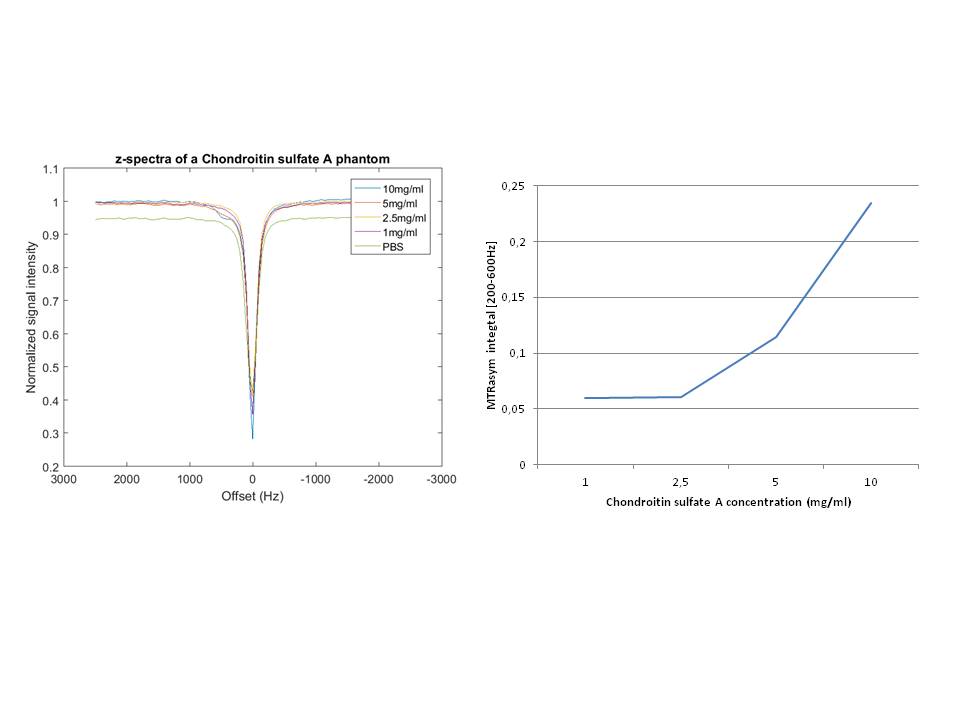
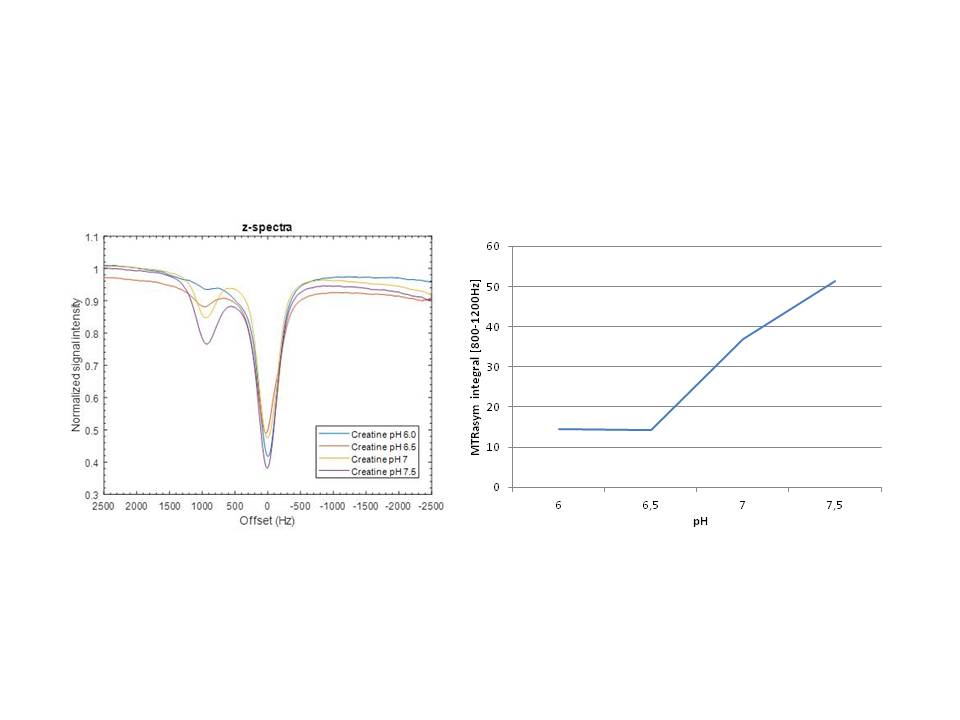
In vitro study: The work hypothesis was first tested in a Chondroitin sulfate A (type of GAG) phantom at different concentrations (1, 2.5, 5 and 10mg/mL) and a creatine phantom (50mM) at several pHs (6, 6.5, 7, 7.5).
In vivo study: NUDE mice (n=12) were implanted with HEMC-SS cells (human chondrosarcoma) in contact to tibia. Tumors were then allowed to growth for 7 weeks. MRI images were acquired at 11.7 T on a Bruker BioSpec117/16USR using a 40-mm quadratic volume coil. First, DWI imaging of chondrosarcoma was performed (20 slices, TR/TE=2000/26 ms; b = 500s/mm2; spatial resolution=0.1x0.1x1 mm3), then WASSR (B1=0,1μT for 1.5 sec, with saturation frequencies ranging from Δω=-260 Hz to 260Hz, BW=50Hz, spatial resolution=0.5x0.5x1 mm3) and CEST Z-spectra (B1=1.5μT for 4 sec, with saturation frequencies ranging from Δω=-2500 Hz to 2500Hz, BW=50Hz, spatial resolution=0.5x0.5x1 mm3) were acquired with EPI based sequences.31P MRS was performed thanks to a volume coil while 23Na imaging was recorded by using a 20-mm surface coil.
Data analysis: CEST data were analyzed using an in-house program written in Matlab® R2017a. Briefly, CEST analysis was performed on ROI(s) drawn around the chondrosarcoma. After correction for B0 inhomogeneity, the CEST maps were generated.
Results
Variations in GAG concentration (fig. 1) and in pH (fig. 2) were observed in vitro by CEST MRI by monitoring the magnetization transfer ratio asymmetry at 450 and 1000Hz, respectively.
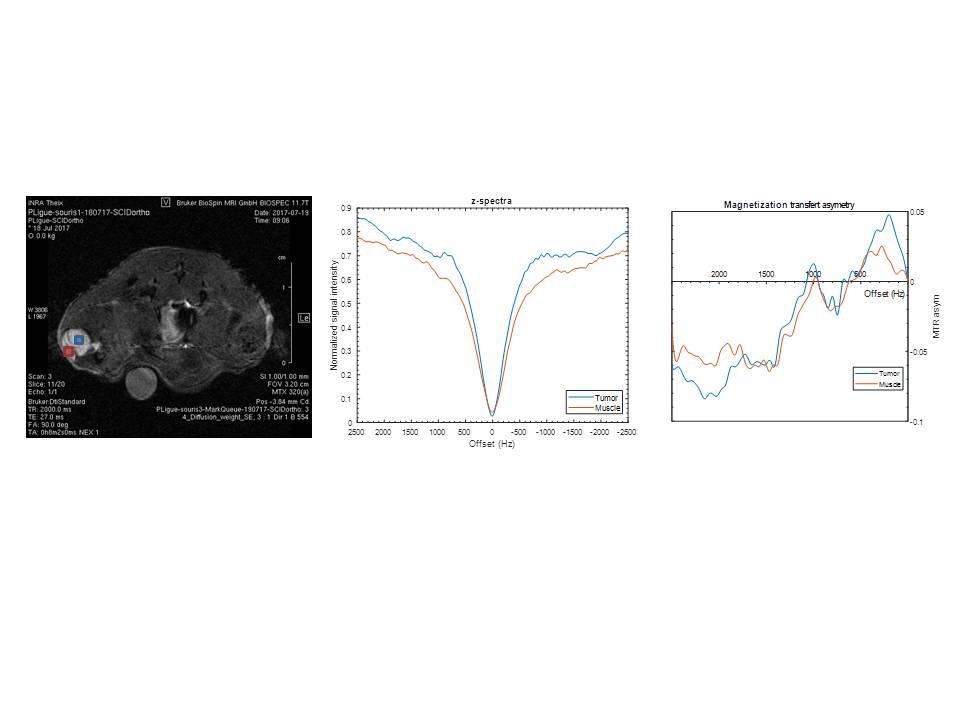
In vivo (Fig. 3), we observed an increase of asymmetry at 450Hz in the chondrosarcoma associated with the high PGs content. The asymmetry of the signal at 450Hz should increase with the pathology development. In vivo, in the z-spectrum we observed a reduction of asymmetry at 1000Hz in the chondrosarcoma associated with acidosis in the hypoxic core. Validation of these results by using well-accepted MRI/MRS methods is in progress.
Discussion
The phantom study demonstrated that CEST effect is sensitive to both the hydroxyl (at 450Hz pm from the water frequency) and amino (at 1000Hz) groups. These moieties allow extracting the GAG concentration and the pH, respectively. If GAG CEST MRI can be used to monitor the cartilage degradation in arthrosis12 by monitoring other exchangeable protons CEST MRI offers the possibility to obtain simultaneously several contrasts. Chondrosarcoma is a tumor combining both GAG concentration changes as well as pH evolution. By recording a full z-spectrum on a window from + 5 to – 5 ppm, GAG concentration and hypoxia status were simultaneously co-investigated in chondrosarcoma tumor. If the GAG content can be easily assessed in vivo, CEST signal from rom –NH moieties required more investigations because of the endogenous mobile proteins and peptides present in vivo which induce a negative background and reduce the signal detected during asymmetry analysis of z-spectra13. The two CEST images are currently being validated by 23Na imaging (GAG concentration) and 31P MRS (pH).Conclusion
CEST MRI can be used as a new strategy for non-invasive assessment of chondrosarcoma. CEST MRI offers the possibility to assess in the same exam the 2 mains characteristics of this tumor: pH and GAG contain. CEST MRI is able to identify and differentiate zones of hypoxia in-vivo. After the validation of the method, our next steps are (i) to compare CEST and nuclear images and (ii) to non-invasively evaluate drug therapeutic efficiency thanks to CEST MRI.Acknowledgements
Authors acknowledge the grant support of the Ligue Régionale Auvergne Rhône-Alpes Contre le Cancer.References
1. Angelini, A. et al. Clinical outcome of central conventional chondrosarcoma. J. Surg.Oncol. 106,929–937 (2012).
2. Peyrode, C. et al. Quaternary ammonium-melphalan conjugate for anticancer therapy of chondrosarcoma: in vitro and in vivo preclinical studies. Invest. New Drugs 30, 1782–1790 (2012).
3. Peyrode, C. et al. A‘Proteoglycan targeting strategy’ for the scintigraphic imaging and monitoring of the swarm rat chondrosarcoma orthotopic model. Sarcoma 2011, 691608 (2011).
4. Peyrode, C. et al. Proteoglycans as Target for an Innovative Therapeutic Approach in Chondrosarcoma: Preclinical Proof of Concept. Mol Cancer Ther. Nov;15(11):2575-2585. Epub (2016). 5. Voissiere A et al.targeting applied to hypoxia-activated prodrug therapy in chondrosarcoma:first proof-of-concept. Oncotarget (2017) in press.
6. Cornelis, F., De Clermont, H., Bernhard, J. C., Ravaud, A. & Grenier, N. L’imagerie d’évaluation thérapeutique en pratique clinique d’oncologie urologique. Prog. En Urol. 24,399–413 (2014).
7. Peyrode, C. et al. A‘Proteoglycan targeting strategy’ for the scintigraphic imaging and monitoring of the swarm rat chondrosarcoma orthotopic model. Sarcoma 2011,691608 (2011).
8. Miot Noirault, E. et al. In vivo scintigraphic imaging of proteoglycans. Methods Mol. Biol. Clifton NJ 836,183–198 (2012).
9. Miot Noirault, E. et al. 99mTc NTP 15-5 assessment of the early therapeutic response of chondrosarcoma to zoledronic acid in the Swarm rat orthotopic model. EJNMMI Res. 3, 40 (2013).
10. Stubbs et al. An assessment of 31P MRS as a method of measuring pH in rat tumours NMR in Biomed.5(6): 351-35 9(1992).
11. Shapiro et al. 23Na MRI Accurately Measures Fixed Charge Density in Articular Cartilage. Magn Reson Med. Feb; 47(2): 284–291 (2002).
12. Zhou Z et al. Quantitative chemical exchange saturation transfer MRI of intervertebral disc in a porcine model. Magn Reson Med. Dec;76(6):1677-1683 (2016).
13. Hua et al. Quantitative Description of the Asymmetry in Magnetization Transfer Effects around the Water Resonance in the Human Brain. Magn Reson Med. 58(4): 786–793 (2017).
Figures