3830
Visualization of Peritumoral Fasciae by Dual-band Long-T2 Saturation UTE at 7T MRI1CAS Center for Excellence in Nanoscience, National Center for Nanoscience and Technology, Chinese Academy of Sciences, Beijing, China, 2School of Future Technology, University of Chinese Academy of Sciences, Beijing, China, 3MR Research China, GE Healthcare, Beijing, China
Synopsis
Fasciae are related with the tumor invasion. To investigate the alteration of peritumoral fasciae during tumor invasion, a novel dual-bandlong-T2saturation UTE sequence was proposed in this study. This sequence was applied to suppress the signal from long-T2 tissue components, consequently directly providing short-T2 contrast. Tumor-bearing Balb/c mouse was scanned on a 7T MRI scanner with the proposed sequence and standard FLASH to compare the quality of fasciae imaging. The results showed that the long-T2 signal was effectively suppressed and the peritumoral fasciae was visualized with this novel technique. This technique will give potential clinical feasibility of the fascia-related diseases.
Introduction
Fasciae have been considered as continuous membranes which cover and penetrate organs, muscles, bones, nerves, blood vessels and lymph vessels[1]. During the tumor invasion, tumor cells must cross the extracellular matrix and the fasciae to invade other tissues. Hence the exploring of fasciae imaging methods is crucial for the tumor diagnosis and treatment. MRI can provide better soft tissue contrast than other clinical imaging methods such as CT and X-ray. However, fasciae with relative short-T2 exhibit low signal intensity upon conventional MRI sequences. Many methods have been proposed to imaging short-T2 components with ultra-short echo time (UTE) or zero echo time (ZTE). Suppressing the signal of long-T2 components, including water and fat, is crucial for directly imaging short-T2 components. A long duration 90°pulse of which the frequency ranges from water to fat was typically used to suppress the signal from long-T2 components. Nevertheless, the intensity distribution of the wide-bandwidth pulse is sharper than that of the narrow-bandwidth pulse. The high power intensity resulting from the sharp peak of the pulse will tip more short-T2 magnetization to the transverse plane, consequently retaining less longitudinal magnetization[2]. Therefore, the short-T2 contrast will be impaired. In addition, as the field increasing, the frequency difference between water and fat becomes larger, consequently the suppression of short-T2 components increases. Especially at 7T MRI, this suppression is much greater than that at 3T MRI. In this study, we introduced a novel dual-band long-T2 saturation UTE sequence to preserve more signal of the short-T2 components, therefore providing a better contrast for peritumoral fasciae of Balb/c mouse at 7T MRI.Methods
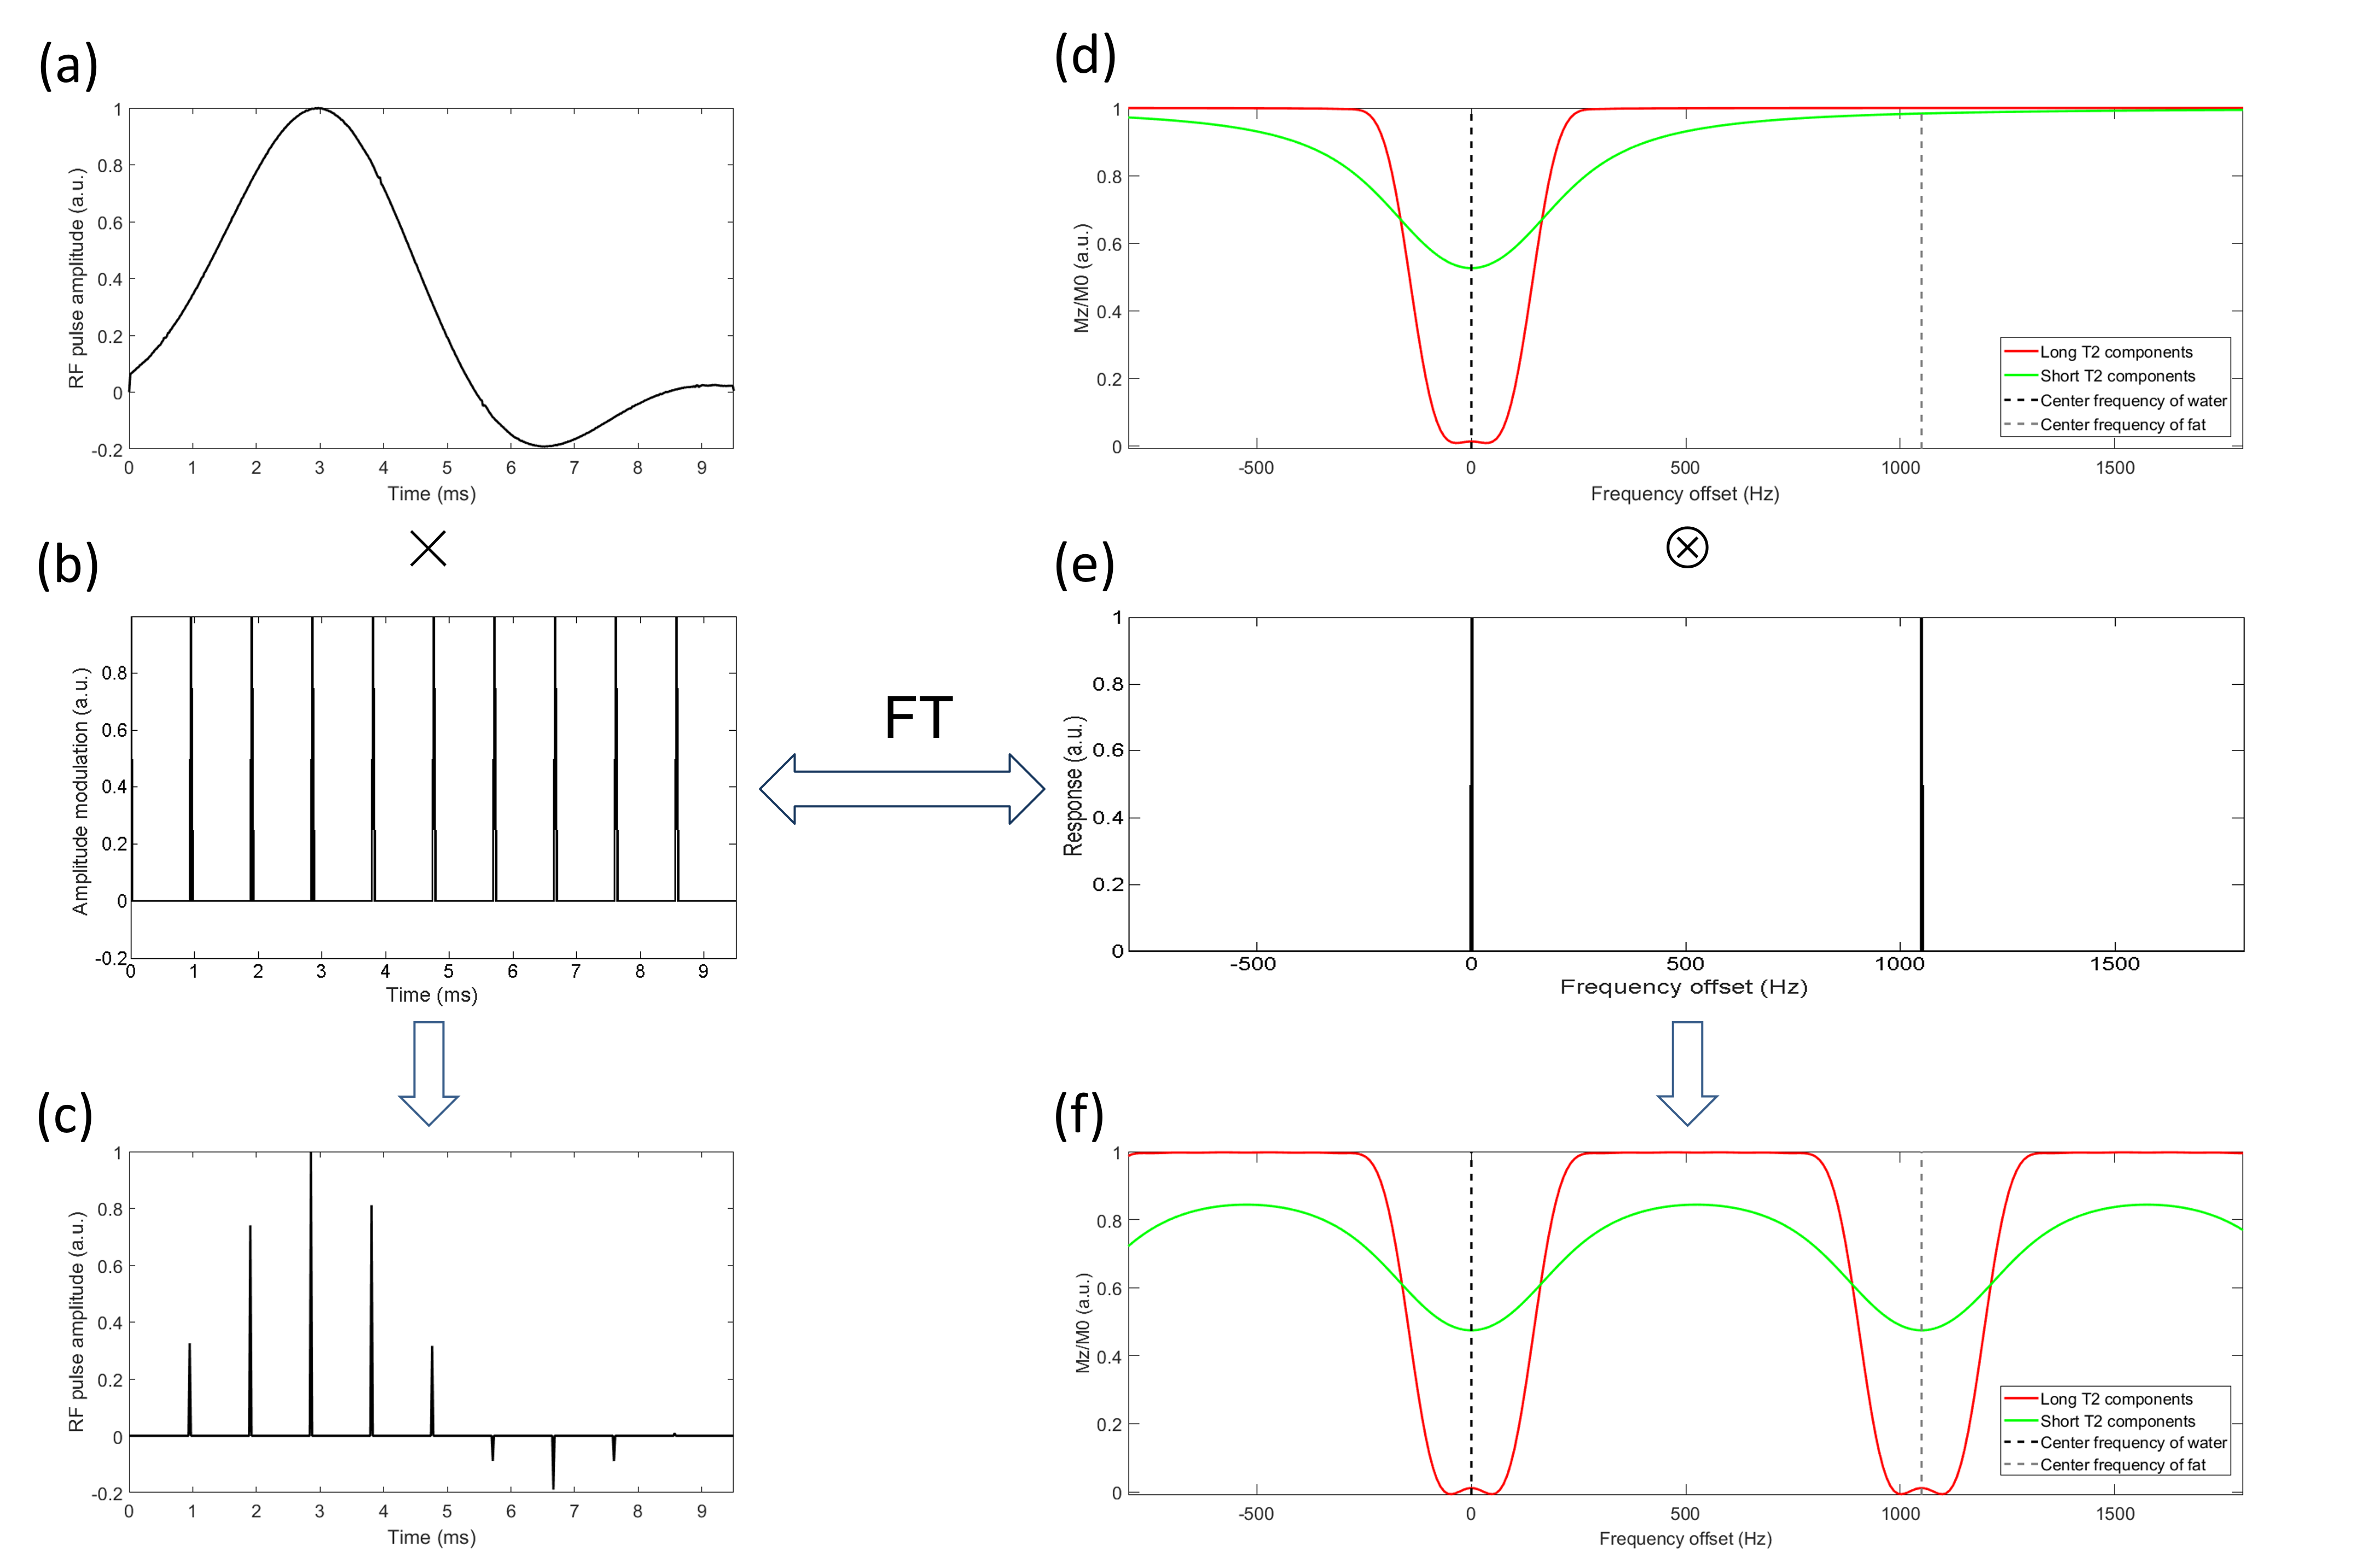
The Balb/c mouse was injected with B16F10 cells to establish the melanoma mouse model. As Fig. 1 (a) shows, a maximum phase saturation pulse (bandwidth 250Hz, duration 9.5ms) was designed to saturate the signal from water using the Shinnar-Le Roux algorithm[3]. To concurrently suppress the signal from fat, a modulation pulse was combined. Fig. 1 (b) shows the shape of this modulation pulse (duration 9.5ms, period 0.95ms) in time domain. After convolution of these two pulses in frequency domain, the modulated pulse was applied to suppress the long-T2 signal from both water and fat. In time domain, this modulated pulse was simply generated by multiplication of the saturation pulse and the modulation pulse, as shown in Fig. 1 (c). This modulation method contains less high intensity power part hence retaining more short-T2 components signal. The suppression effect simulations by the Bloch Equation for the signal of the long-T2 and short-T2 components under the modulated pulse is shown in Fig. 1 (f). Therefore, this method can provide better short-T2 contrast to visualize fasciae. The tumor-bearing mouse was scanned at the following parameters: 1. Dual-band long-T2saturation UTE sequence: TR=15ms, TE=0.008ms, 5° flip angle; 2. UTE sequence: TR=15ms, TE=0.008ms, 5° flip angle; 3. FLASH: TR= 20ms, TE=4ms, 10° flip angle, All FOVs and image sizes are 32mm×32mm×50mm, image size is 128×128×128.Results
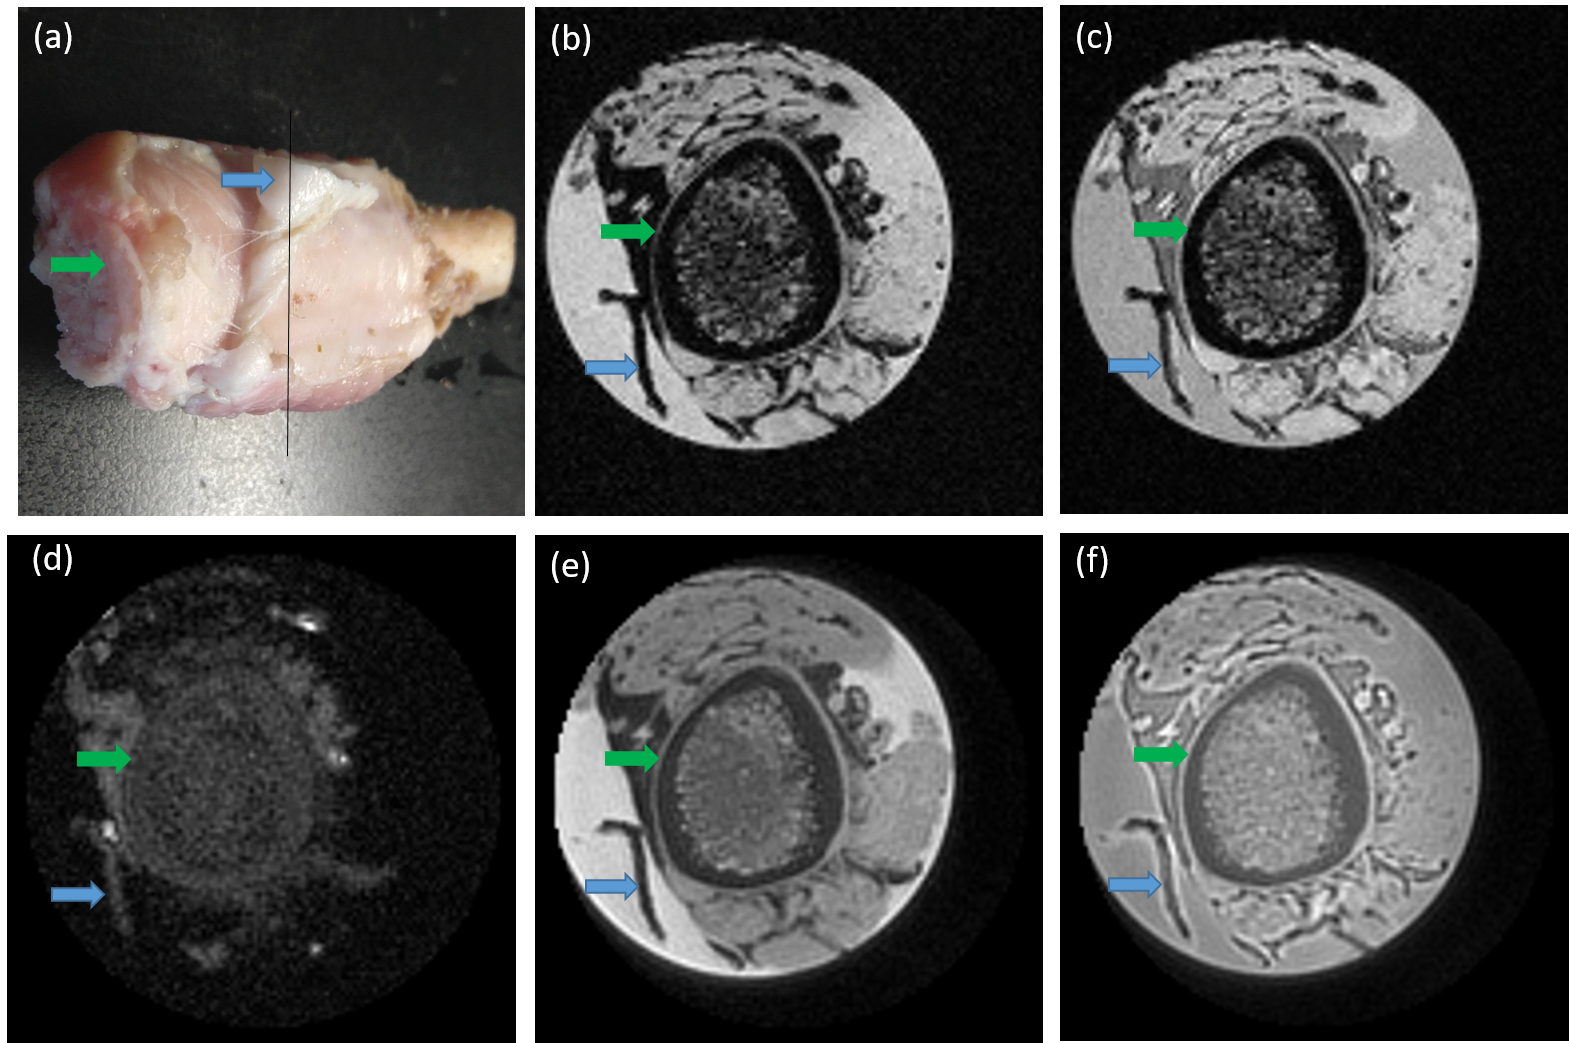
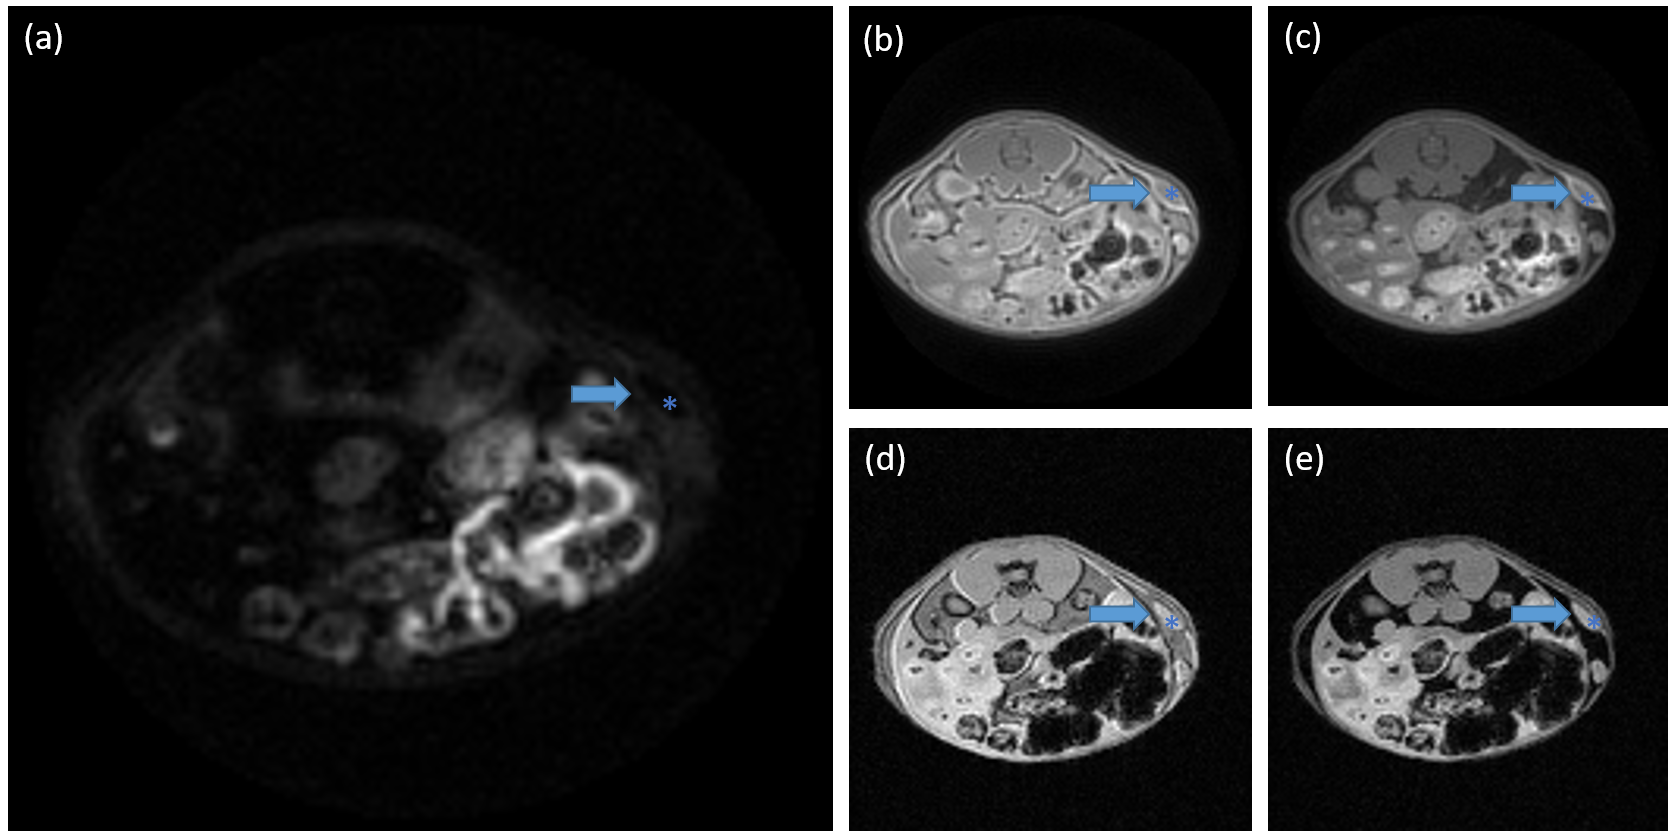
Fig. 2 compares the signal from pig rib which contained cortical bone and fasciae performance scanned between the proposed UTE, basic UTE and standard FLASH. The cortical bone and the region located at fascia show high signal intensity with the proposed UTE sequence. Nevertheless, the bone shows high signal intensity in the two basic UTE sequences, the region located at the fascia shows low signal intensity. The cortical bone and the region located by fascia show low signal intensity in the two FLASH sequences shown in Fig. 3 (d) and Fig. 3 (e). Fig. 3 compares the signal from fascia surrounding tumor performance between the proposed UTE, basic UTE and standard FLASH. Blue *s represent the tumor and blue arrows pointed fasciae surrounding tumor tissues. Fasciae show high signal intensity under proposed UTE sequence (Fig.3 (a)), UTE (Fig.3 (b)) and fat-saturation UTE (Fig. 3 (c)). The signal of tumor fascia are 2334±600, 14768±935 and 18738±2121 under Dual-band Long-T2 saturation sequence, fat-sat UTE and UTE, respectively. The signal of muscle are 341±131, 8747±320 and 12470±445 under Dual-band Long-T2 saturation sequence, fat-sat UTE and UTE, respectively.Discussion
According to the Fig. 2, this proposed UTE sequence is effective to imaging fasciae which are short-T2 component and difficult to be imaged in conventional FLASH sequence. In addition, the proposed UTE enhance the fasciae-to-muscle contrast from about 1.6 to 6.8 when compared to fat-sat UTE and basic UTE sequence. Therefore, the proposed Dual-band Long-T2 saturation UTE can be used to visualize the fascia and is promised to be applied in tumor invasion monitoring and other fascia-related researches.Acknowledgements
The authors will thank Han Dong Lab Team of National Center for Nanoscience and Technology for their help to this research.References
1. S. Finando and D. Finando, "Fascia and the mechanism of acupuncture," Journal of bodywork and movement therapies, vol. 15, no. 2, pp. 168-76, 2011-Apr 2011.
2. P. E. Z. Larson, P. T. Gurney, K. Nayak, G. E. Gold, J. M. Pauly, and D. G. Nishimura, "Designing long-T-2 suppression pulses for ultrashort echo time imaging," Magnetic Resonance in Medicine, vol. 56, no. 1, pp. 94-103, Jul 2006.
3. J. Pauly, R. P. Le, D. Nishimura, and A. Macovski, "Parameter relations for the Shinnar-Le Roux selective excitation pulse design algorithm [NMR imaging]," IEEE Transactions on Medical Imaging, vol. 10, no. 1, p. 53, 1991.
Figures